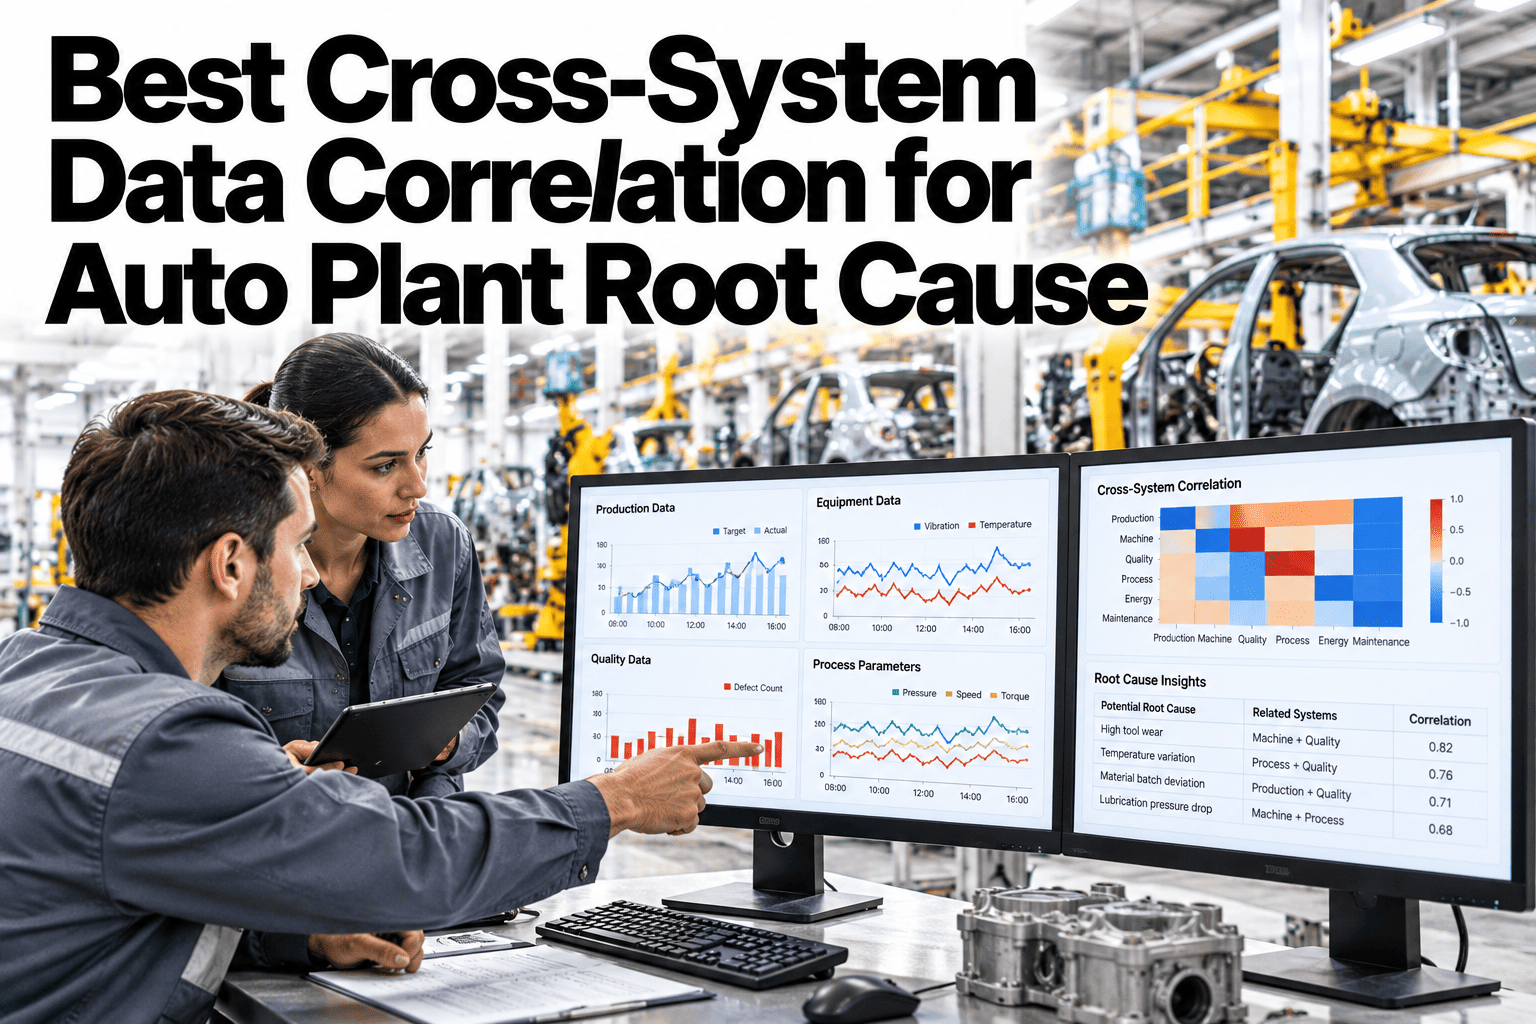
Root cause analysis in an auto plant usually starts the same way: an engineer pulling three exports into one spreadsheet and lining them up by eye. OEE data, quality data and maintenance data each hold a piece of the answer, and none of them hold it alone. This guide covers what it takes to join these three sources on VIN, station and time, so an investigation that used to take days can start from an already-correlated view. Teams ready to shrink their own RCA timelines can book a demo with the iFactory AI team.
Best Cross-System Data Correlation for Auto Plant Root Cause
Three timelines converging on one moment: joining OEE, quality and maintenance events by VIN, station and time turns a manual spreadsheet exercise into an automatic starting point for every investigation.
The Three Keys That Make Correlation Work
Correlation only works if every system records the same three facts about an event: which vehicle, which station and when. Miss any one of the three and the match becomes a guess instead of a fact.
Which vehicle
Ties a specific defect back to the exact build, and forward to every station it passed through.
Where and when
Pins the event to a specific point in the line, at a specific moment, so related events from other systems can be found.
From Days to Hours
The chart below shows an illustrative shift in RCA timelines before and after correlated data was available, for a sample of recurring quality issues on one line.
The time saved does not come from a faster spreadsheet. It comes from skipping the spreadsheet step entirely, since the correlated events are already sitting together when the investigation starts, rather than needing to be assembled first.
What a Correlated Investigation Looks Like
Instead of starting with a blank spreadsheet, an engineer starts with a pre-built timeline of every event tied to the vehicle, station or time window in question.
| Step | Without Correlation | With Correlation |
|---|---|---|
| Find related events | Manual export and cross-reference across three systems | Automatic, already joined on VIN, station and time |
| Confirm sequence | Eyeballing timestamps across different formats | A single aligned timeline |
| Check for repeats | A separate manual search per system | One query across all three sources |
Shrink Root Cause Analysis From Days to Hours
iFactory AI joins OEE, quality and maintenance events on VIN, station and time, giving every investigation a correlated starting point. Book a 30-minute walkthrough.
Common Correlation Pitfalls
A correlation layer is only as good as the data feeding it, and a few recurring gaps account for most of the false negatives, where a real link is missed because the data did not carry what the match needed.
Plain-Language Glossary
A shared vocabulary keeps engineering and quality teams reading the same correlated data the same way.
Expert Review
Quality engineers running RCA programs across auto plants keep returning to the same two notes.
VIN coverage matters most
A correlation layer is only as strong as its weakest tracking point. Confirming VIN capture at every relevant station is worth doing before trusting any cross-station match.
Widen the window for clock drift
Unsynchronized system clocks are a common, quiet cause of missed matches. A slightly wider matching window often compensates without introducing false positives.
Frequently Asked Questions
What data do we need before correlation will work?
Consistent VIN capture, station identification and reasonably synchronized timestamps across systems are the minimum. Book a demo to check your own data readiness.
How accurate is automatic correlation compared to manual review?
When the three keys are reliable, automatic correlation tends to catch matches a manual review would miss simply from volume, though spot-checking early results is still worthwhile.
Can this work without VIN-level tracking?
Station and time correlation alone still adds real value, though VIN-level tracking unlocks the strongest matches for vehicle-specific defects. Ask support what correlation looks like without full VIN tracking.
Does correlated data replace engineering judgment in an investigation?
No, it replaces the manual assembly step. The engineer still interprets the timeline, just starting from a more complete one. Book a demo to see how investigations actually use this data.
How often should correlation keys be reviewed?
A quarterly check against new stations, new systems or process changes keeps the matching reliable as the plant evolves.
Start Every Investigation From a Correlated Timeline
iFactory AI joins OEE, quality and maintenance events on VIN, station and time, so root cause analysis starts further along. Book a walkthrough built around your plant.