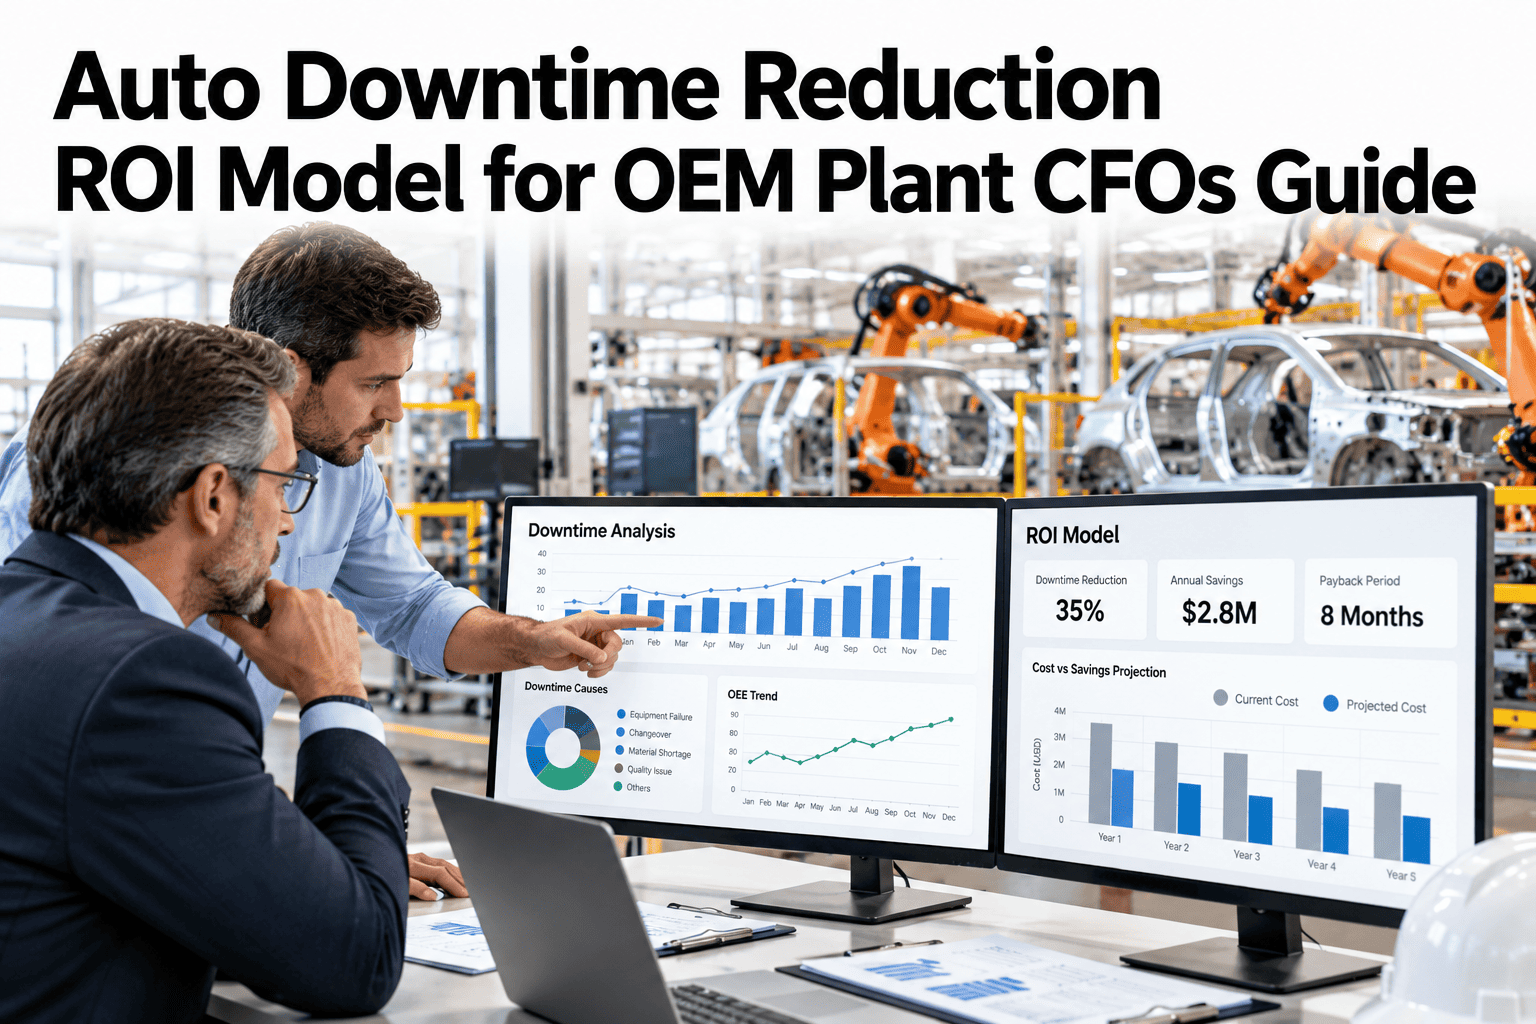
Ask five plants in the same OEM network to report OEE and you'll often get five different answers to what should be the same calculation, not because performance actually differs that much, but because each plant defines a planned stop, a minor loss and an availability window slightly differently. Comparing those numbers directly is comparing five different formulas wearing the same label. Standardizing event taxonomy, loss category mapping and the time model itself is what makes OEE actually comparable across a plant network, rather than a number each site can define favorably. Operations leaders can review their own cross-plant OEE consistency in a short session.
Five Plants, Five Different OEE Formulas, One Misleading Comparison
iFactory standardizes event taxonomy, loss categories and time models, so OEE actually means the same thing across every plant.
Why "As Reported" OEE Can't Be Compared
Plant A's 82% and Plant C's 90% look like a meaningful gap until you learn Plant C counts far more downtime as "planned" than Plant A does. Once both run through the same formula, the real gap often looks very different.
| Standardization Element | Problem Without It | Fix |
|---|---|---|
| Event taxonomy | Each plant names and categorizes stops differently | One shared taxonomy applied consistently across all plants |
| Loss category mapping | What counts as "planned" vs "unplanned" varies by site | Consistent rules for categorizing every loss type |
| Time model alignment | Available time is defined differently, skewing the denominator | One standard time model applied network-wide |
See Your Own Plants Compared on One Standard Formula
Book a 30-minute session and iFactory will recalculate your plant network's OEE using one consistent standard.
Three Pillars of OEE Standardization
Event Taxonomy
A single, shared list of stop and loss event types, applied consistently so a "changeover" means the same thing at every plant.
Loss Category Mapping
Consistent rules for what counts as availability loss, performance loss or quality loss, removing site-level interpretation.
Time Model Alignment
A shared definition of available time, planned downtime and calendar time, so the denominator is consistent across every plant.
Signals Your Network's OEE Isn't Really Comparable
Where iFactory Fits
iFactory applies one consistent taxonomy, loss mapping and time model across every plant in your network, automatically.
Shared Event Taxonomy
A single taxonomy is deployed and enforced across all plants, removing site-by-site naming drift.
Consistent Loss Mapping
Every loss type maps to availability, performance or quality consistently, regardless of which plant it occurred at.
Unified Time Model
Available time and planned downtime follow one standard definition network-wide.
True Cross-Plant Benchmarking
With a consistent formula, OEE comparisons across plants become genuinely meaningful for prioritizing investment.
Reviewed by iFactory's Operations Analytics team for alignment with standard OEE calculation practice. The comparison figures shown are illustrative; actual standardization should reflect your own network's equipment types and existing reporting conventions.
Frequently Asked Questions
Will standardization make every plant's OEE number change?
Likely yes for most plants, since few networks already use perfectly identical definitions. The point isn't to penalize any plant but to make comparisons across the network finally accurate. Support can walk through how this is typically communicated to plant teams.
How disruptive is this to existing plant-level reporting?
Plants can often keep their existing local reporting for day-to-day use while the standardized formula runs in parallel for network-wide comparison, reducing disruption during the transition.
Can historical OEE data be recalculated under the new standard?
Yes, as long as the underlying event and stop data exists, it can be reclassified against the new taxonomy to produce a standardized historical trend line, not just go-forward data. See historical recalculation demonstrated on your own data in a short session.
Does this work across plants with different equipment types?
Yes, the taxonomy and loss mapping are designed to apply consistently regardless of equipment type, since the standardization is about definitions and categorization, not the machines themselves.
How do plant managers react to a standardized OEE that lowers their number?
This is a common initial concern, and framing it as a move to accurate, comparable measurement rather than a performance judgment tends to ease the transition. Ask support how other OEM networks have managed this rollout.
Make OEE Actually Mean the Same Thing Everywhere
iFactory standardizes taxonomy, loss mapping and time models across your plant network. Book a walkthrough on your own data.