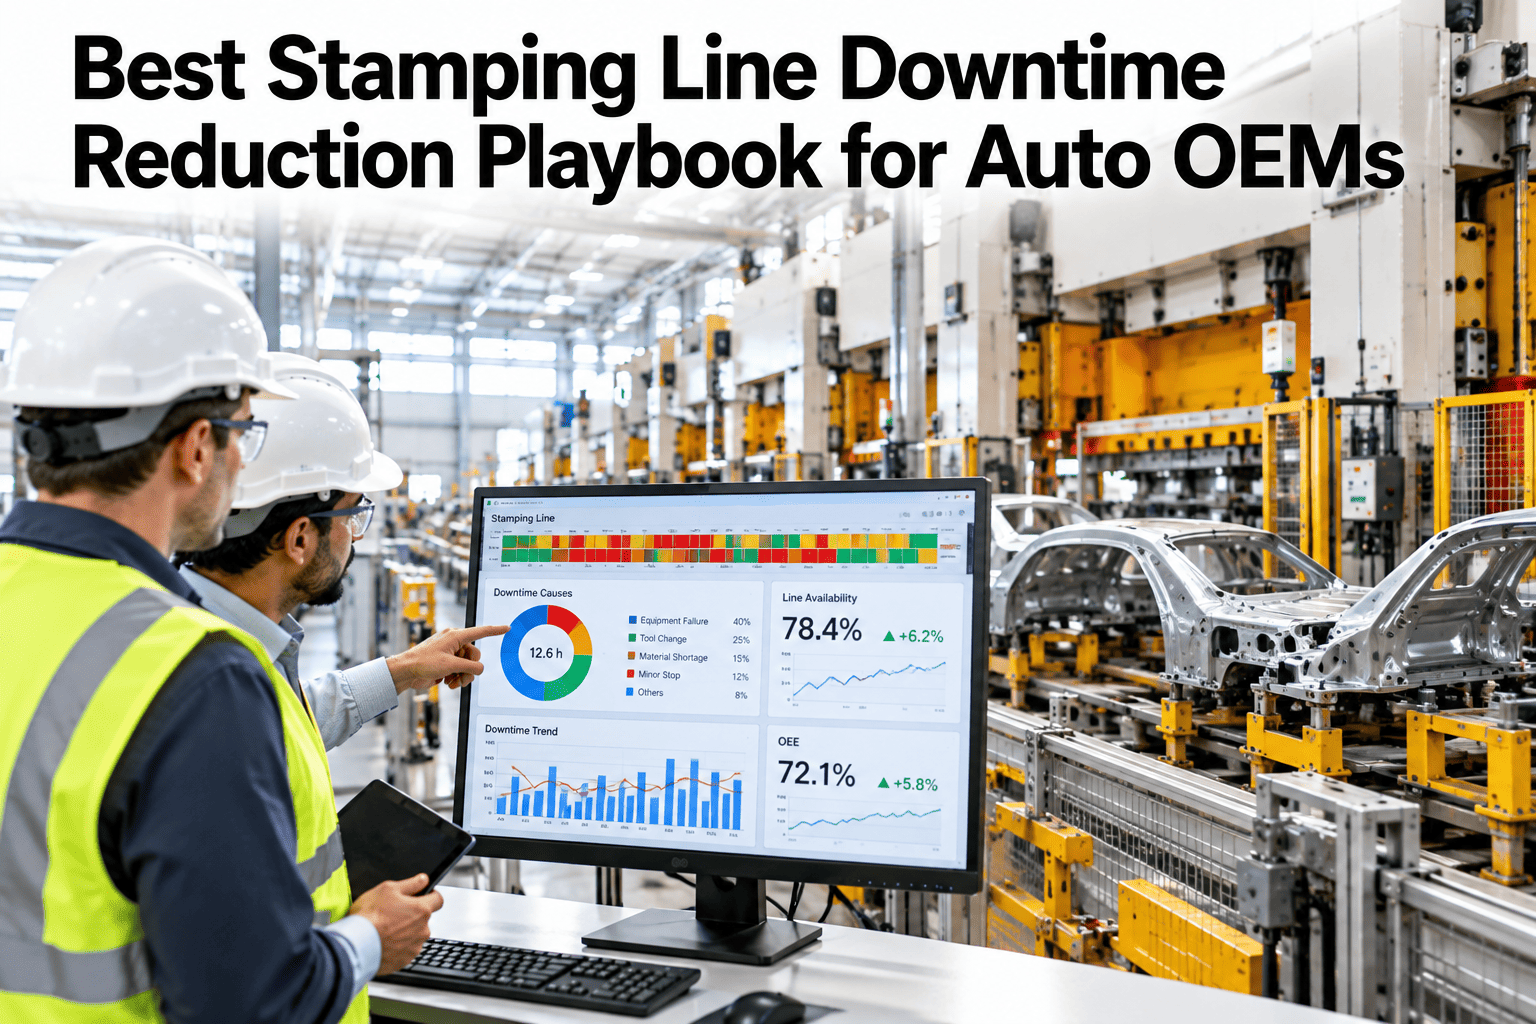
Most stamping line downtime does not come from a single catastrophic failure. It comes from the same handful of recoverable delays repeating shift after shift: a die change that runs long, a coil splice that stalls the feed, tooling that was not staged in time. None of these individually look like a crisis, but stacked across a week they can eat more line hours than any one breakdown would. A playbook built around the three biggest recoverable categories, die change SMED, tooling readiness, and coil-feed reliability, gives a plant a concrete place to start, and teams building that plan can walk through their own downtime log against this playbook.
The 20–35% Cut Starts With Three Categories, Not One Big Fix
Auto OEMs running this playbook typically cut stamping line downtime 20 to 35 percent by attacking die change time, tooling readiness and coil-feed reliability as one connected program instead of three separate fixes.
Why Downtime Reduction Fails When It Targets One Category
A plant that spends a quarter improving die change time while ignoring coil-feed reliability often finds total downtime barely moves, because the saved minutes on one side get absorbed by stalls on the other. Downtime categories compete for the same production hours, so a program that only tracks one metric can show local improvement while the line-level number stays flat.
Checklist One: Die Change SMED
Single-minute exchange of die, SMED, works by splitting every die change step into what can happen while the press is still running and what genuinely requires the press to be stopped. Most plants have never actually timed the split, so the first checklist pass is less about new equipment and more about an honest measurement.
Score Your Own Die Change Against This Checklist
Book a 30-minute session and bring your current die change timing. iFactory AI will show where the internal-versus-external split is costing you the most.
Checklist Two: Press-Tooling Readiness
A press that is mechanically ready to run is still down if the right tooling is not staged nearby. Tooling readiness failures are easy to miss in a downtime log because they get coded as "waiting," a catch-all category that hides exactly how much time is lost and why.
| Readiness Gap | Typical Cause | Fix |
|---|---|---|
| Die not pre-staged | Crane scheduling conflict | Lock crane time into the changeover schedule in advance |
| Wrong tooling pulled | Manual tooling log, no barcode check | Barcode or RFID verification before crane pull |
| Tooling needs repair on arrival | No pre-change inspection | Inspect tooling condition a shift ahead, not at the press |
| Die cart blocked in staging area | Poor staging area layout | Dedicate staging lanes by press, not shared general storage |
Why "Waiting" Hides the Real Downtime Driver
Most downtime logging systems include a generic "waiting" code that operators default to when the real cause is not obvious in the moment. That single catch-all bucket is often the largest category on a monthly downtime report, and it is also the least useful, because it tells a planner nothing about whether the wait was for tooling, a crane, a material delivery or a quality sign-off.
Splitting "waiting" into its real causes is usually the single highest-leverage change a plant can make before running any of the three checklists above, since it reveals which category actually deserves the next improvement project instead of relying on whichever problem was most recently visible on the floor.
Checklist Three: Coil-Feed Reliability
Coil-feed stalls, splice failures and material tracking errors interrupt a running press in a different way than a die change does: the press stops mid-cycle, often without warning, which makes these stalls harder to plan around and more disruptive to cycle rhythm than a scheduled changeover.
Splice Quality Checks
Standardize splice inspection before a coil is loaded, rather than discovering a weak splice mid-run when it tears the feed.
Loop Control Tuning
Keep feeder loop control tuned to current material gauge, since a stale tuning profile is a common source of intermittent stalls.
Material Changeover Tracking
Log gauge and grade changes against feed stall history to catch material-specific feed problems before they repeat.
Feed Roll Maintenance
Track feed roll wear on a condition basis rather than a calendar basis to catch slip-related stalls earlier.
Building the Business Case Across Departments
A downtime reduction playbook touches production, maintenance and finance at once, and each group tends to ask a different question before signing off. Production wants predictable changeover windows. Maintenance wants fewer emergency calls on the feeder line. Finance wants a number it can defend against the cost of implementation.
Running the Three Checklists as One Program
The value in this playbook is not any single checklist, it is tracking all three against the same downtime log so a plant can see which category is actually driving the week's losses instead of guessing. A plant that treats die change, tooling and coil-feed as separate initiatives usually ends up with three partial fixes and one flat downtime number.
A Composite Week: Before and After the Playbook
The scenario below reflects an illustrative stamping line running all three checklists together, comparing a baseline week against a week six months into the program. Nothing about the press fleet changed between the two weeks, only how changeover, tooling and feed events were tracked and acted on.
| Metric | Baseline Week | Six Months In |
|---|---|---|
| Average die change time | 38 minutes | 24 minutes |
| Tooling-wait incidents | 11 per week | 3 per week |
| Coil-feed stall events | 9 per week | 4 per week |
| Total recoverable downtime | Baseline | 26% lower |
Where iFactory AI Fits
Running this playbook by hand means reconciling press logs, tooling records and feeder data from different systems every week. iFactory AI connects those sources automatically, so the three checklists above are tracked against one live downtime record instead of three disconnected reports.
Automated Changeover Timing
Die change steps are timestamped automatically from press signals, splitting internal and external time without manual stopwatches.
Tooling Readiness Tracking
Barcode and crane-schedule data confirm tooling is staged ahead of changeover, flagging gaps before the press stops.
Coil-Feed Stall Analytics
Feeder stall events are logged with material gauge and grade context, surfacing patterns a manual log would miss.
One Unified Downtime Record
All three categories roll into a single report by press, shift and category, so the biggest loss driver is always visible.
Keeping the Playbook Alive After the First Quarter
The hardest part of a downtime reduction program is rarely the first improvement, it is keeping the discipline after the early wins. Teams often tighten die change time in the first quarter, see the number improve, and then let the measurement lapse once attention moves to the next priority. Coil-feed stalls and tooling gaps tend to creep back first, since they are the easiest to attribute to "just a bad shift" rather than a pattern worth tracking.
Keeping all three categories on the same live record, rather than a quarterly spreadsheet review, is what prevents that creep. A pattern that would take a month to notice manually shows up within days when the data updates automatically, which gives a planner time to intervene before the gain erodes back to baseline.
Expert Review
Stamping production leaders who have run downtime reduction programs tend to warn against the same trap: celebrating a win in one category while total downtime stays flat because another category quietly absorbed the gain. Running die change, tooling readiness and coil-feed reliability against one shared record is what keeps that from happening. Bring your current downtime log to a working session and see which category is actually driving your week's biggest losses.
Frequently Asked Questions
Which of the three categories should a plant tackle first?
It depends on where the current downtime log shows the biggest loss, which is why measuring all three against one shared record matters before committing budget to any single fix. Bring your downtime data to a session and get a category-by-category breakdown.
How is internal versus external die change time actually measured?
Internal time is any step that requires the press stopped, external time is everything that can happen while it is still running. Press signal timestamps mark the transition automatically once the system is connected.
Does this playbook apply to progressive dies as well as transfer dies?
Yes, the three categories apply to both die types, though the specific tooling readiness steps differ since progressive dies typically involve less crane movement than large transfer die sets.
How long before a plant sees the 20 to 35 percent reduction?
Most plants see measurable movement within the first two quarters once all three categories are tracked together, though the pace depends on how much of the current downtime is concentrated versus spread evenly across categories. Ask support how the timeline typically breaks down for a press mix like yours.
Does coil-feed tracking require new sensors on the feeder?
Most modern feeders already generate signals that can be tapped without new hardware, though older feeders sometimes need a retrofit sensor to capture stall events reliably. Ask support about your specific feeder model.
Run All Three Checklists Against One Record
iFactory AI connects die change, tooling readiness and coil-feed data into a single downtime report. Book a walkthrough using your own press data.