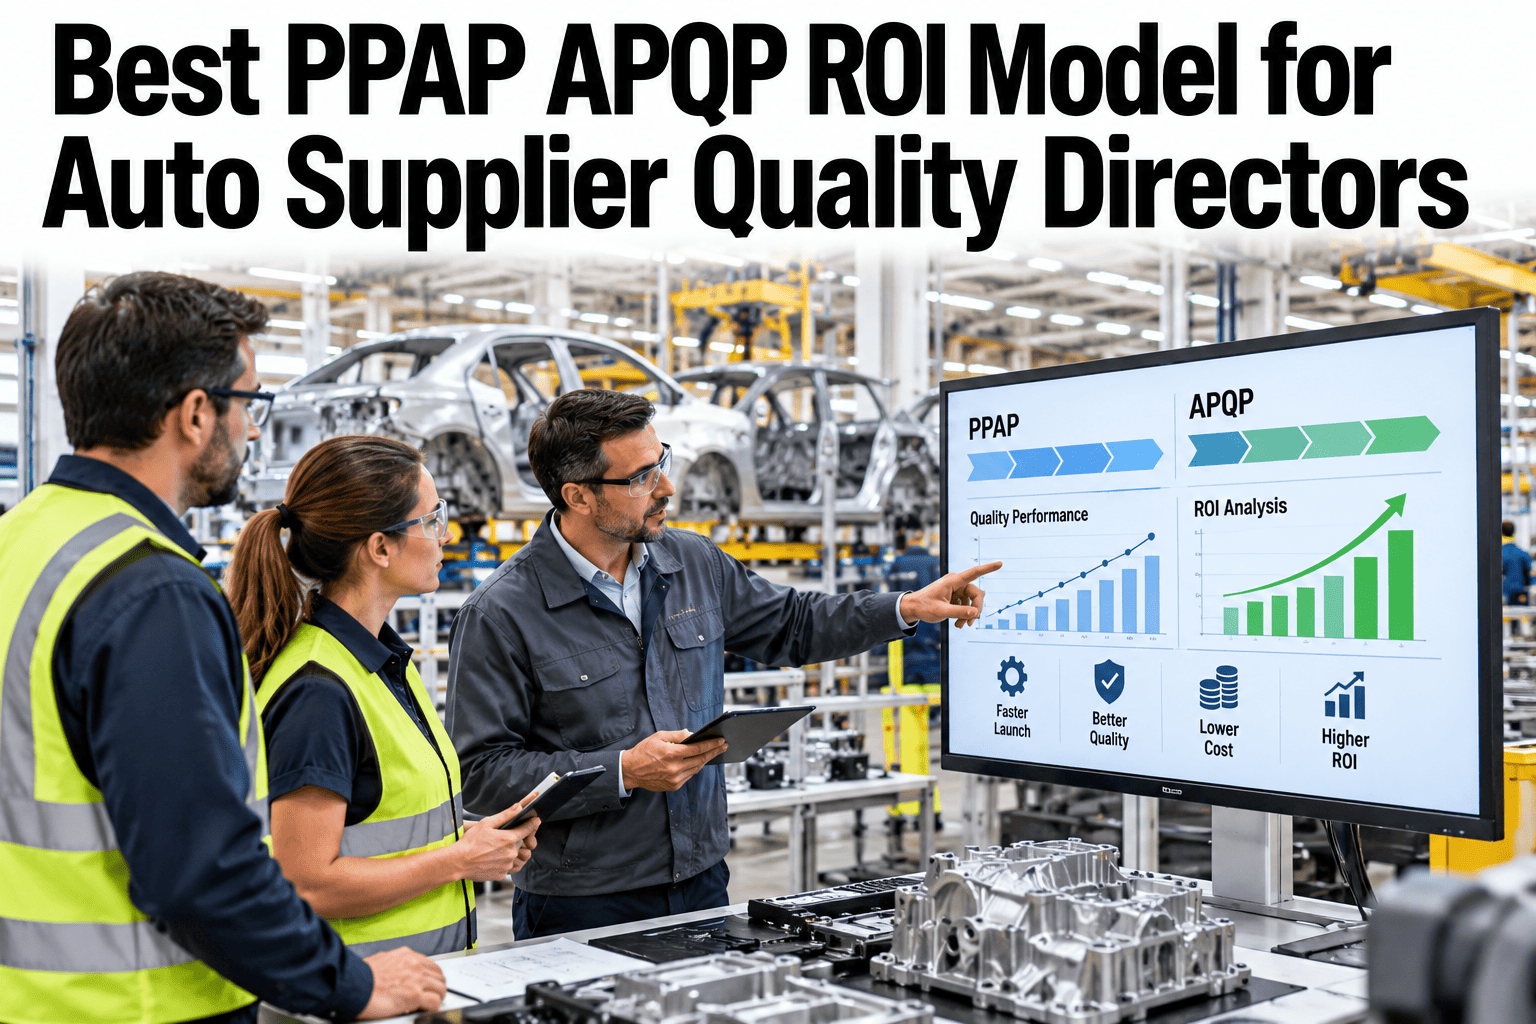
Quality directors are rarely asked whether PPAP and APQP matter. They are asked what automating them will return, and the answer has to survive a finance review. A defensible model counts only benefits it can measure, shows what happens if they fall short and keeps hopeful value out of the base case. Teams building that case can ask iFactory AI how a PPAP and APQP business case is structured.
Best PPAP and APQP ROI Model for Automotive Supplier Quality Directors
Stack cycle-time savings, quality-cost avoidance and OEM-relationship value into a model your finance partner can test. iFactory AI automates the PPAP, APQP, SPC and MSA work the model prices.
Why a Quality ROI Model Needs a Different Shape
Finance teams distrust quality ROI for good reason. Benefits are often soft, counted twice or assumed to arrive in full. A director who wants approval needs a model built the other way round: conservative inputs, three clear value stacks and a plain view of what happens if results come in lower.
Cycle time
Engineer hours and calendar days saved on every PPAP and APQP package. Measurable from timesheets and launch calendars.
Quality cost
Resubmissions, containment and scrap avoided. Measurable from your cost of quality records.
OEM relationship
Better scorecards and awards. Real but uncertain, so it stays outside the base case.
The rest of this page walks through each stack with illustrative numbers, then combines them into a three-year view with a sensitivity test. Replace every input with your own before using any figure internally.
What You Are Actually Pricing: The PPAP and APQP Facts
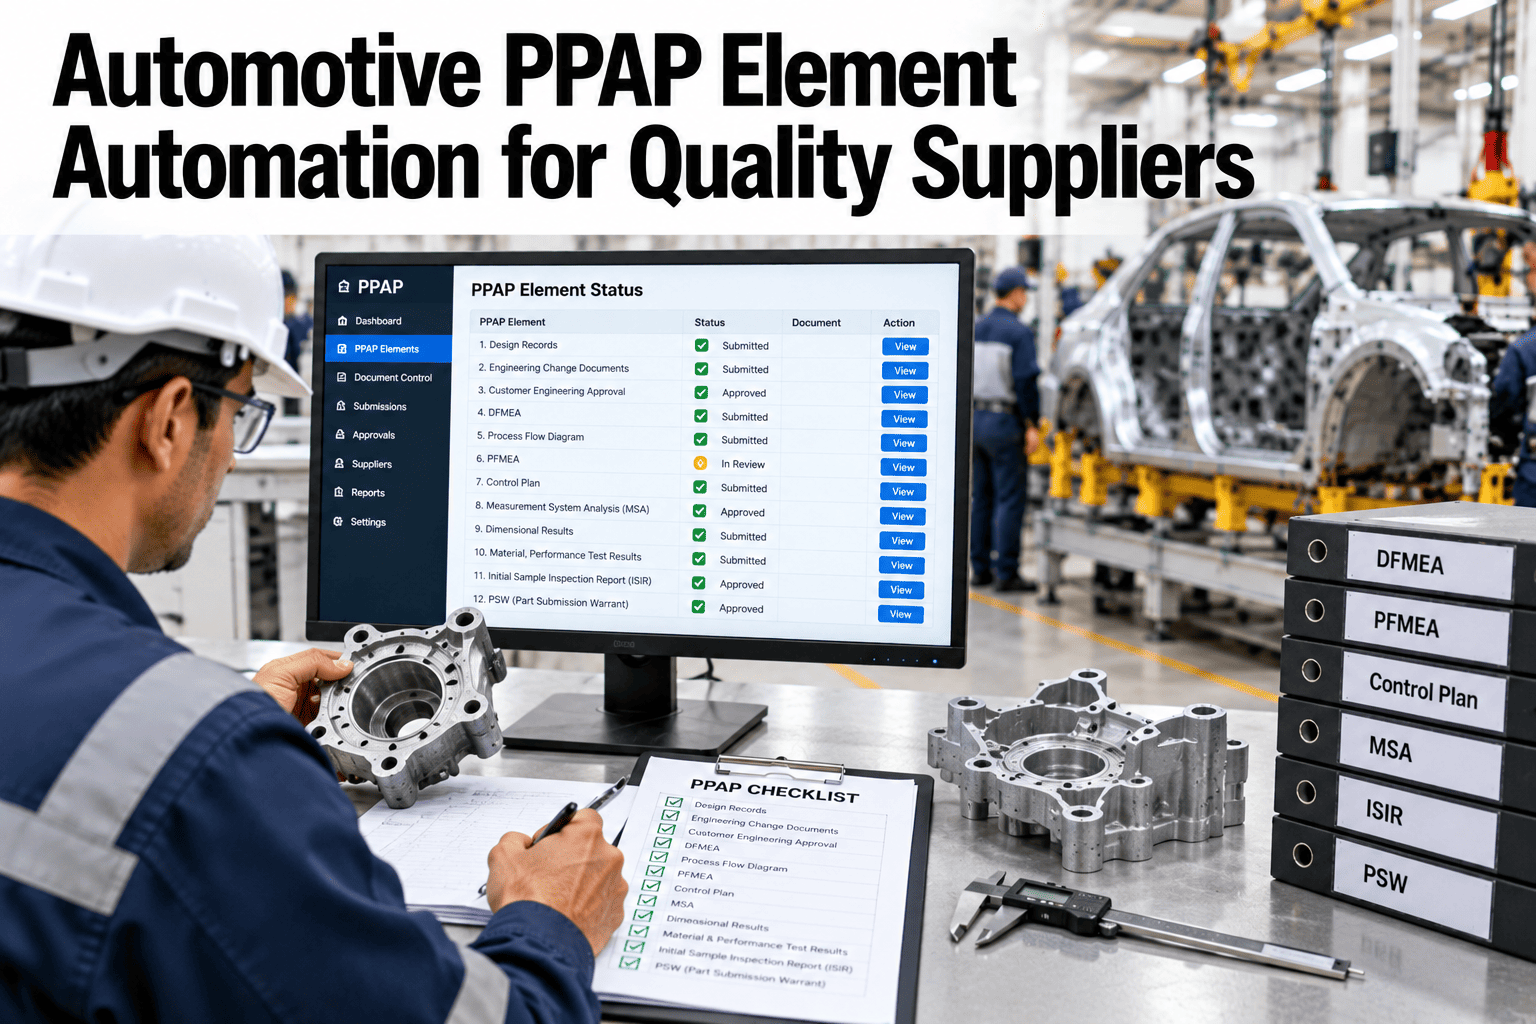
A few facts from the Kaizen Institute guide set the scene. A PPAP package has 18 elements and is required whenever a new part enters production, a design changes through an engineering change notice, tooling is replaced or added, the supplier or material source changes, or production moves. The customer sets the submission level, and Level 3 is the default in most automotive contexts.
| Common Rejection Reason | What It Means | Cost Lever in the Model |
|---|---|---|
| Disconnects between flow diagram, PFMEA and control plan | Documents do not agree with each other | Fewer resubmissions |
| PFMEA filled as a form | Not used as a decision tool | Fewer escapes later |
| Control plan lists controls not used on the line | Paper does not match practice | Fewer audit findings |
| MSA run on laboratory gauges | Not on production instruments | Fewer rejected studies |
| Capability study under trial conditions | Not at the quoted production rate | Fewer failed launches |
The guide also observes that PPAP is not a process but the output of one, and that a rejected submission is often a symptom of upstream APQP weakness made visible. That matters for the model: the largest savings come from fixing the upstream link, not from filling in forms faster.
Stack 1: Cycle-Time Savings
The first stack is the easiest to defend, because it prices hours your team already spends. Count submissions per year, hours per submission and the share of that work automation removes.
Where hours go
Chasing data, reformatting documents, linking records and rework. Automation targets these before engineering judgement.
Calendar days too
Shorter preparation can bring a launch forward. Price that separately only if you have a measured delay cost.
Redeploy, not fire
Say what the freed hours will do, such as more launches without more staff. Finance will ask.
Stack 2: Quality-Cost Avoidance
The second stack counts failures that cost money. Two are easy to measure: resubmissions after rejection, and containment or scrap events linked to weak process control.
The prevention rate is a judgement and the weakest number in the model, so use a low figure and show it plainly. SPC and MSA data that are connected to the control plan are what make early warning possible, but the model should not claim more than your history supports.
Put Real Numbers Into the Model
Book a 30-minute session and iFactory AI will help you size the three value stacks from your own submissions, rejections and containment history.
Stack 3: OEM-Relationship Value, Kept Out of the Base Case
Customers notice fast, clean submissions, and scorecards feed sourcing decisions. That value is real, but it is uncertain and hard to attribute, which makes it the first thing a finance reviewer will challenge. Show it as an upside, never as part of the return you promise.
The Three-Year Model
Combine the two measurable stacks and set them against costs. The base case counts 118,800 for cycle time, 49,200 for resubmissions and 25,000 for containment, 193,000 a year in total. Relationship value is excluded.
| Item | Year 1 | Year 2 | Year 3 | Total |
|---|---|---|---|---|
| Benefits | 193,000 | 193,000 | 193,000 | 579,000 |
| Software subscription | 90,000 | 90,000 | 90,000 | 270,000 |
| Implementation, one time | 40,000 | 0 | 0 | 40,000 |
| Internal time | 20,000 | 10,000 | 10,000 | 40,000 |
| Total cost | 150,000 | 100,000 | 100,000 | 350,000 |
| Net benefit | 43,000 | 93,000 | 93,000 | 229,000 |
Three-year return is 229,000 on 350,000 of cost, about 65 percent. Payback comes in roughly 9 months, since 150,000 divided by 193,000 is 0.78 of a year. Year one shows a 28.7 percent return on its own cost, with the rest arriving as the one-off cost falls away.
Sensitivity: What If Benefits Fall Short
A director who shows only the best case invites doubt. Show what happens at 75 and 50 percent realisation. The bars compare annual benefit with the level needed to break even over three years.
| Realisation | Three-Year Benefit | Three-Year Cost | Net |
|---|---|---|---|
| 100 percent | 579,000 | 350,000 | +229,000 |
| 75 percent | 434,250 | 350,000 | +84,250 |
| About 60 percent | 350,000 | 350,000 | 0 |
| 50 percent | 289,500 | 350,000 | -60,500 |
The model breaks even if the supplier realises about 60 percent of the benefit. That is a useful sentence for a finance review, because it tells them exactly how wrong the estimate can be before the project loses money.
Baseline Metrics to Collect Before You Start
You cannot prove a gain without a before. Collect these over the last 12 months, and keep the method fixed so the after can be compared fairly.
| Metric | How to Measure | Feeds Stack |
|---|---|---|
| Submissions per year | Count from the PPAP log by customer and level | 1 |
| Hours per submission | Timesheets or a sample of recent launches | 1 |
| Preparation days | Request date to submission date | 1 |
| First-time approval rate | Approved without resubmission, divided by total | 2 and 3 |
| Rejection reasons | Coded from customer feedback | 2 |
| Containment events and cost | Cost of quality records | 2 |
| Capability and MSA failures | Studies that missed targets, such as Cpk or Gage R&R | 2 |
| Customer scorecard | Quality and delivery ratings by customer | 3 |
If a number is not available, say so and use a range. A model with honest gaps is easier to approve than one that hides them.
Avoiding Double Counting
The most common reason a quality ROI case is rejected is that one benefit appears twice. Check these overlaps before the model goes to finance.
How to Judge the Best PPAP and APQP Software
The ROI model prices a tool, so the tool must deliver what the model assumes. Score each supplier against the same criteria. The weights are a starting point.
| Criterion | What to Ask | Weight |
|---|---|---|
| Element coverage | Does it cover all 18 PPAP elements and your customers' submission levels and formats? | 20 |
| Document linkage | Do the flow diagram, PFMEA and control plan stay in step when one changes? | 20 |
| Live data | Do SPC, capability and MSA studies pull from production gauges and rates? | 20 |
| APQP gates | Does it track phase gates, owners and open actions across programs? | 15 |
| Evidence for ROI | Can it report cycle time, first-time approval and rejection reasons? | 15 |
| Deployment and cost | How long does set-up take, and is the pricing clear? | 10 |
| Total | 100 |
Ask for a pilot on one live program. The measured results from the pilot are the best inputs you can give the model.
Presenting the Case to Finance and the Customer
A short, plain structure gets a quality case approved faster than a long deck. Aim for one page the finance partner can check line by line.
Offer to report actual results against the model after six months. Committing to measure yourself is the strongest signal that the numbers are meant seriously.
Where the Savings Come From Across APQP
Because PPAP is the output of APQP, many savings start well before the submission. Walk the program from concept to launch and ask, at each gate, what avoidable work or risk the tool removes. The Kaizen guide describes APQP as a structured, phase-gated method that runs from product concept through production validation.
| Stage | Typical Waste | What Automation Removes | Stack |
|---|---|---|---|
| Planning and feasibility | Requirements scattered across emails and files | One record of customer requirements and special characteristics | 1 |
| Process design | Flow diagram, PFMEA and control plan drift apart | Linked documents that change together | 1 and 2 |
| Product and process validation | Studies run on the wrong gauges or at the wrong rate | Capability and MSA studies fed from production data | 2 |
| Submission | Manual assembly of the package and format checks | Package built from live records | 1 |
| Launch and feedback | Findings not fed back into the next program | Lessons and rejection reasons logged by program | 2 and 3 |
This view also helps with ownership. Savings that appear in several departments need a named owner for each, or no one will confirm them later. Agree the owner of every line in the model before the case goes to finance.
Choosing the First Program for the Pilot
The pilot decides how credible the model becomes, so choose the program with care. A very easy one proves little, and a very hard one may fail for reasons unrelated to the tool.
A live launch
A real submission with a real deadline gives measurable hours and a customer verdict.
A typical complexity
Choose a Level 3 package with an average number of special characteristics, so the result scales to other programs.
The one-off monster
A safety-critical, reviewed-on-site launch is a poor test of everyday savings.
Record the same measures you took for the baseline: hours, preparation days, linkage errors found, approval result. Then compare like with like. If the pilot lands near your assumptions, the model gains weight. If it lands lower, refit the numbers and show the new break-even before anyone asks.
Keep the pilot team small and name one person to own the results. A pilot that belongs to everyone tends to be measured by no one, and the evidence that was meant to support the business case ends up as opinion.
After Year Three: Keeping the Gains
A good model does not stop at payback. Once the cost is recovered, the question becomes whether the gains last and where they go next. Plan for that now, so the benefit does not quietly fade.
Review the numbers every quarter
Track hours per submission, first-time approval and containment cost against the baseline. If a measure slips, find out why while it is still small.
Spread to more programs
Extend from the pilot program to the rest of the portfolio, and use the freed hours for more launches without more headcount.
Report results to the same finance partner who approved the case. Showing actual figures against the model, including the misses, builds the credibility you will need for the next request.
A 90-Day Path to Measured Results
iFactory AI is built as a turnkey server that racks in, plugs in and goes live in roughly 6 to 12 weeks, so a PPAP and APQP pilot fits inside a quarter.
What iFactory AI Adds
iFactory AI is smart manufacturing and industrial software. For automotive quality it connects PPAP, APQP, SPC and MSA work to live plant data.
Plain-Language Glossary
Shared words keep quality, finance and program teams aligned.
Frequently Asked Questions
What should an ROI model for PPAP and APQP include?
Three stacks: cycle-time savings, quality-cost avoidance and OEM-relationship value. Count the first two in the base case, and show the third as upside so the payback stays defensible.
How do we avoid overstating the return?
Use measured baselines, apply low prevention rates and show results at 75 and 50 percent of the benefit. State the break-even point, as finance reviewers value that. Ask support for a sensitivity template you can reuse.
Which inputs matter most?
Submissions per year, hours per submission and the first-time approval rate usually move the result most. Check these against real records before anything else, since small errors here change the whole case.
How long until we can show results?
A pilot on one live program can show measured cycle time and linkage errors within a quarter. Use those results to replace assumptions and refit the model before any wider commitment.
Should customer relationship value be counted?
Show it, but outside the payback. Scorecards and awards depend on many factors, so attach only a small, evidenced share and label it clearly as upside to the measured benefits.
Build a PPAP and APQP Case Finance Will Trust
iFactory AI helps quality directors measure cycle time, rejections and containment, then turn them into a defensible three-year return. Book a walkthrough on your own program data.