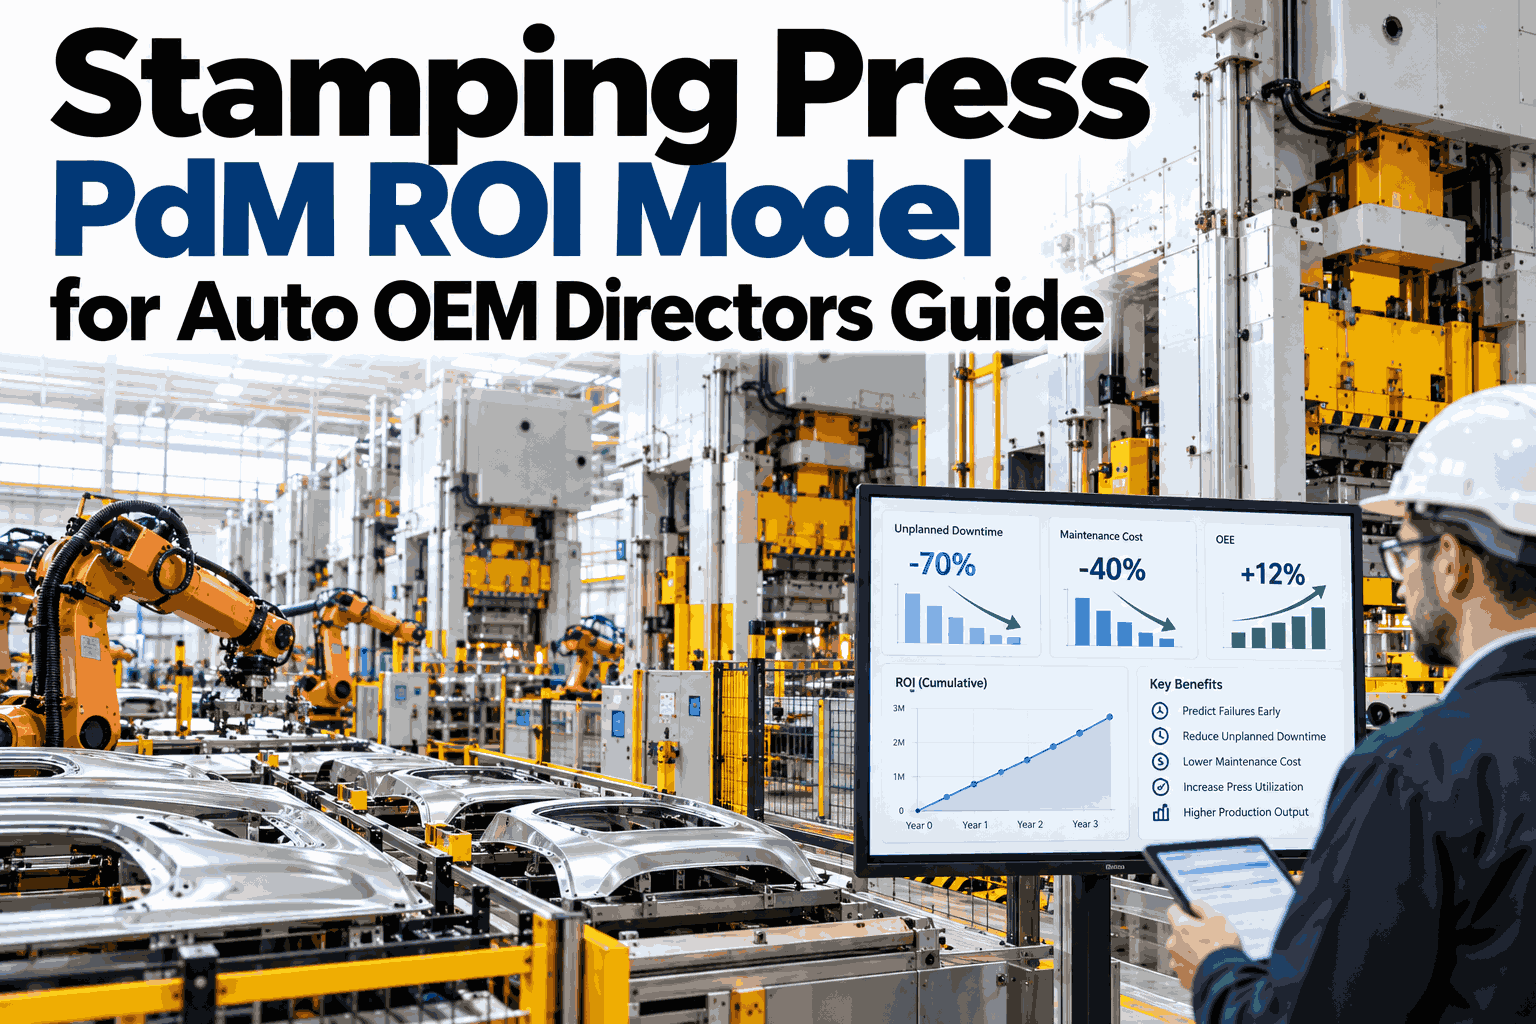
A predictive maintenance pitch that leads with a vendor's case study rarely survives a finance review. A model built from the plant's own downtime hours, its own die regrind costs, and a conservative uptime assumption usually does. The difference between the two is not the software, it's whether the numbers in the model came from your press shop or from someone else's. Directors who want this built against their own stamping data can walk through a 3-year model on their own press line in a short session.
A Model a Finance Committee Can't Wave Off
iFactory AI stacks avoided press downtime, die-life extension, and reduced repair cost into a 3-year model built from your own stamping line, not a vendor's borrowed case study.
Three Buckets, Stacked in Order of What Actually Moves the Needle
Not every savings category in a PdM case carries equal weight. Stacking them in the order they typically move the total keeps the model honest about where the real number comes from.
The Cost Side Needs Three Lines, Not One
A model that shows only the benefit side invites the obvious question of what it actually costs to get there. The spend side of a PdM program breaks into three categories, and a director should be ready to name all three.
Hardware
Sensors on each press and die, typically the smallest recurring line once the initial installation is complete.
Software
Usually priced per asset or per plant as an ongoing subscription, scaling with the number of presses covered.
Services & enablement
Onboarding, training, and ongoing analyst support — easy to underestimate, and the first place a budget gets squeezed.
Cost per asset, per year
All three lines summed and divided by presses covered — the single figure finance teams use to benchmark against other vendors.
The Baseline a Director Should Actually Defend
The single most common way a PdM case falls apart in a finance review is an uptime-improvement assumption nobody can trace back to anything. A conservative, staged assumption survives scrutiny better than an aggressive one that doesn't.
Build the Staged Model on Your Own Press Data
Book a 30-minute session and iFactory AI will walk through a conservative-to-base-case model using your own downtime and die records.
Where Each Number Should Actually Come From
A model that cites a vendor's case study instead of the plant's own records invites the exact question it can't answer. Sourcing each input from somewhere traceable is what turns a pitch into a model.
| Model input | Where to source it | Why it's defensible |
|---|---|---|
| Annual unplanned downtime hours | Plant maintenance log, by press | Already tracked, not estimated |
| Hourly production margin | Finance, per line, not plant average | Reflects this press's real output value |
| Average regrind interval and cost | Tool room records | Tied to the dies actually running |
| Emergency repair premium | Work order history, premium vs planned | A real multiplier, not a borrowed one |
| Uptime improvement assumption | Independent research, staged conservatively | Not a vendor's self-reported outcome |
What a Finance Committee Actually Asks
A director who has sat through a few of these reviews knows the questions in advance. Building the model to answer them before they're asked is most of the preparation.
Payback Period, Not Just a 3-Year Total
A 3-year number is the headline, but the payback period is usually the number that actually gets the funding approved. Most PdM programs that are properly scoped land in a predictable window.
Discounting the Model, Not Just Totaling It
A 3-year total that simply adds up undiscounted annual savings looks optimistic to anyone who reviews capital projects for a living. Running the same figures through the organization's own hurdle rate is a short step that changes how the model is received.
See the Payback Math on Your Own Line
iFactory AI can walk through what a realistic payback period looks like once coverage starts on your stamping presses.
Why the Die-Life Bucket Needs Its Own Verification
Die-life extension is the hardest of the three buckets to source cleanly, because it depends entirely on what "extended life" is being measured against. A director should ask the same question of any figure handed to them, including iFactory's own.
What Goes Wrong Without This Discipline
A model built without sourced inputs, a staged assumption, and a discounted total doesn't just look weaker — it tends to fail in specific, predictable ways once it reaches a finance review.
A Worked Illustration of the Stack
The following is an illustrative structure, not a specific plant's actual figures, meant to show how the three buckets combine into a single model rather than three separate pitches.
The Downside Case Belongs in the Model Too
A committee that only sees a base case will ask what happens if coverage rolls out slower, or if the uptime gain lands at the low end of the range for longer than planned. Having that answer ready, rather than scrambling for it, is what separates a prepared director from an unprepared one.
Who Presents What, in the Review
A PdM business case usually gets better reception when more than one voice is behind the numbers. Splitting the model by who owns which part keeps each section answerable by the person who actually knows it.
Running the Model at Three Confidence Levels
A single-number total invites a single-number challenge. Presenting the same model at three confidence levels gives the committee a range to react to instead of one figure to accept or reject.
Where iFactory AI Fits
Building a defensible model needs real downtime and die-wear data, not a borrowed case study. iFactory AI supplies the data; the model itself is built from your plant's own numbers.
Press-Level Downtime Data
Actual unplanned downtime hours per press, not a plant-wide estimate standing in for the real figure.
Die Wear Tracking
Force and acoustic signals show real remaining die life, which is what the extension bucket should be measured against.
Repair-Cost Visibility
Planned versus emergency work order costs, broken out so the repair-cost bucket has a real baseline.
Staged Rollout Reporting
Quarter-over-quarter downtime-hours-avoided reporting, the KPI finance committees actually want to see.
Frequently Asked Questions
What uptime improvement should the model actually assume?
Independent research broadly supports a 10 to 20 percent uptime improvement range for predictive maintenance programs. A staged model that starts near 10 percent in year one and scales toward 20 percent as sensor coverage matures tends to survive finance scrutiny better than a flat, aggressive number applied from day one. Support can walk through how to stage this for a specific press count.
Should the 3-year number be discounted to present value?
Most finance committees expect it, and a model that only shows an undiscounted total invites the obvious follow-up question. Apply the organization's own hurdle rate to each year's projected savings before summing them. A non-positive NPV at year three is usually a sign the program is under-scoped or the cost side of the model needs revisiting, not a reason to inflate the benefit side instead.
How should die-life extension be verified before it goes in the model?
Compare any extended-life figure, whether it's a vendor's outcome claim or an internal estimate, against the plant's own regrind history for the specific die types involved. A figure with no stated baseline or time period should be treated as a hypothesis to test, not a number to build the case on directly. Ask how to validate a die-life figure against your own tool room data in a short session.
What if the first year doesn't hit the projected savings?
A well-built conservative model should still show a reasonable payback even under a slower-than-planned rollout, which is the entire point of staging the uptime assumption rather than front-loading it. If year one falls meaningfully short of even the conservative case, that's a signal to revisit the downtime-hours baseline or the press coverage plan, not to abandon the program.
How long before there's a real number to bring to the committee?
A first documented savings event typically shows up within 60 to 90 days of sensors going live, since force and downtime data are already present every shift. A full staged 3-year model can be drafted once a few months of baseline data confirm the plant's own downtime and die-wear patterns. Ask support about the baseline timeline for your specific press count.
Bring a Model, Not a Pitch, to the Next Review
iFactory AI supplies the downtime and die-wear data behind a 3-year ROI model built from your own stamping line. Book a walkthrough before your next budget cycle.


.png)