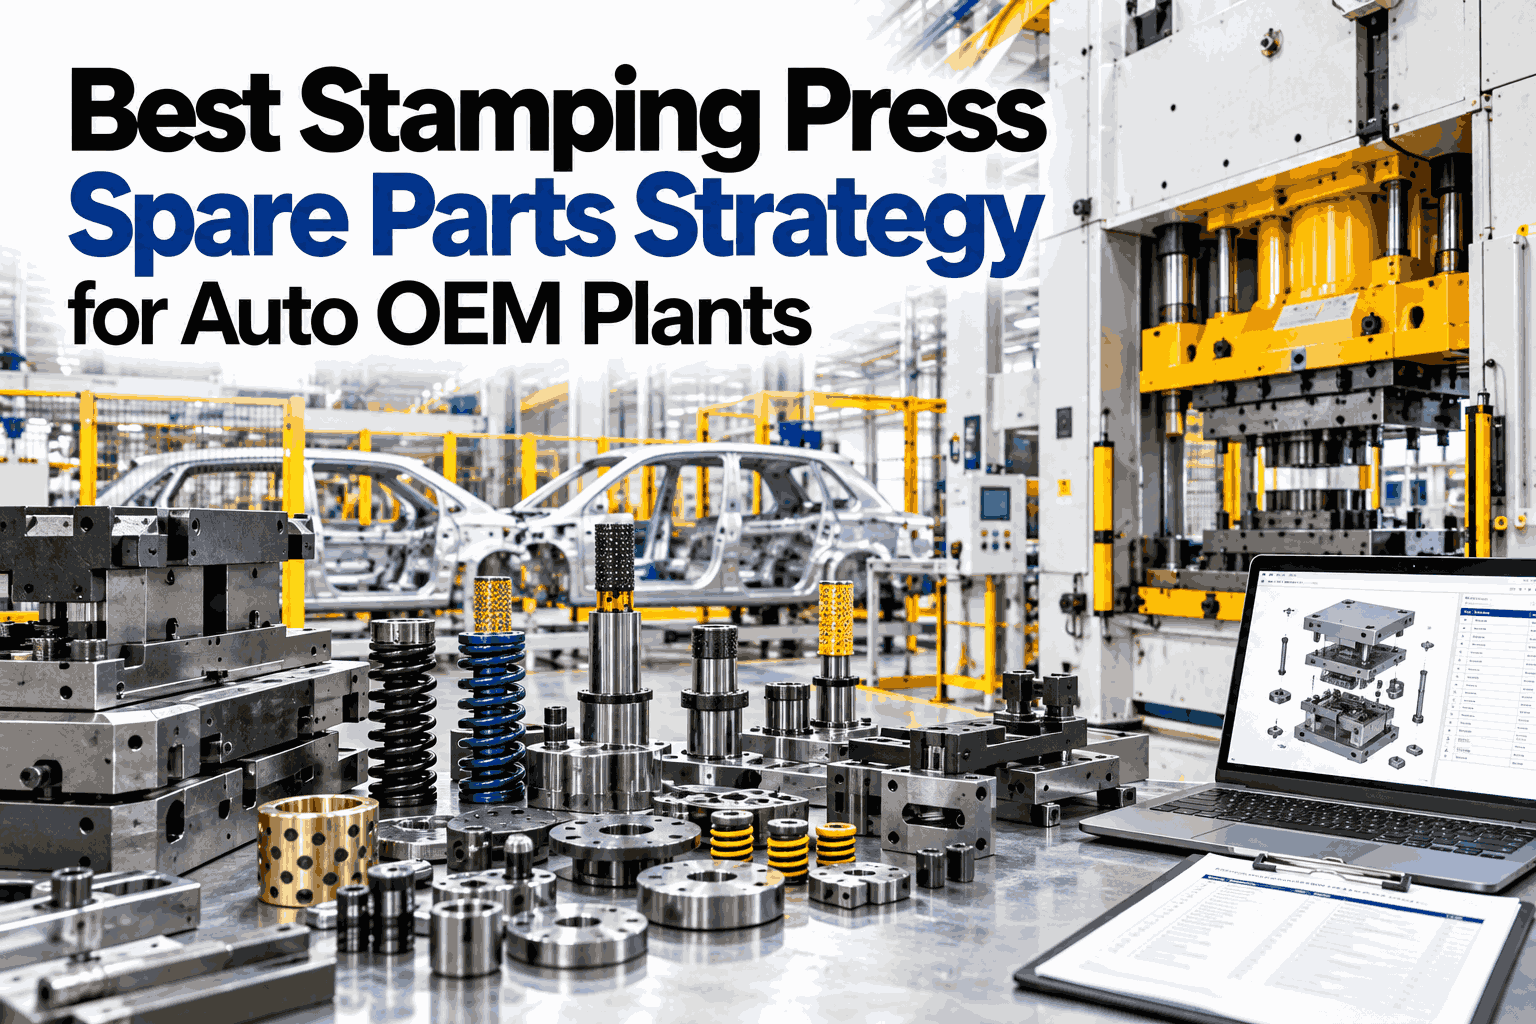
Every spare part on a stamping press shelf is a bet: that holding it costs less than the downtime of not having it when a die fails. Get the bet wrong in one direction and cash sits idle on a shelf for years. Get it wrong in the other, and a five-day vendor lead time turns a worn guide bushing into a five-day line stoppage. The decision is not emotional, it is arithmetic — and the number that decides it is usually missing from the spreadsheet. Plants weighing this on their own press line can walk through the hold-or-order math on a real die in a short session.
Stock the Spare, or Trust the Lead Time?
iFactory AI turns die and press wear data into the one number a spares decision actually needs — how many weeks of warning you really have before a failure.
The Arithmetic Behind Every Spares Decision
Stocking a spare is not a safety instinct, it is a comparison of two costs. Holding the part costs money every year it sits on a shelf. Not holding it costs money only in the years it actually fails and the line has to wait. The decision is simply whichever number is bigger.
What's Actually Inside Each Cost
Both sides of the comparison hide more than a single number. Breaking each one into its parts is what keeps the comparison honest, rather than a rough guess dressed up as a calculation.
Why the Same Part Gets a Different Answer on Different Lines
The same guide bushing or die component can be worth stocking on one press and not worth stocking on another. The part hasn't changed — the cost of being without it has.
Run the Hold-or-Order Math on Your Own Press Line
Book a 30-minute session and iFactory AI will map wear data on your dies to a real spares holding decision, not a guess.
Three Tiers, Three Different Rules
Not every part on a stamping line needs the same level of analysis. Sorting the inventory by value and criticality first means the hard thinking only goes where it actually matters.
Sorting by Value Isn't the Same as Sorting by Risk
Value-based tiering answers which parts cost the most. It doesn't answer which failures hurt the most, and those are not always the same parts. A cheap guide pin that stops a bottleneck press can matter more than an expensive component on a line with a backup.
Lead Time Is the Variable That Moves the Decision
Of everything in the equation, vendor lead time is the one that swings the answer the hardest. A short lead time can turn a stock-it decision into a reorder-on-demand decision without the part's value or criticality changing at all.
What Wear Prediction Actually Changes
A spares policy built on failure probability alone treats every die the same: a fixed percentage chance of failing in a given year. Wear prediction replaces that guess with an actual countdown, which changes what "critical" even means for a specific die, right now.
When Stocking Nothing Is the Right Call
A spares strategy isn't only about deciding what to stock. Sometimes the honest answer is to stock nothing and accept the risk, which is a harder thing to put in a plan than "buy more."
The Vendor Relationship Nobody Reviews
A spares list treats the vendor's lead time as a fixed fact, when it is usually the most negotiable number in the whole equation. A six-week lead time quoted once rarely gets challenged again, even after the market, the vendor's own backlog, or the shipping route behind it has changed more than once.
Turn Die Wear Data Into an Order Trigger
See how iFactory AI's wear signals can flag a reorder point before a die failure, not after a line stop.
Where the Spreadsheet Usually Gets It Wrong
Most stamping plants already have a spares list. What tends to be missing is not the list — it's the two numbers that should have decided what's on it, and the habit of checking them again once a year has actually passed.
A Composite Case: The Die Component That Almost Wasn't Stocked
The following is an illustrative composite, not a single named plant, but it reflects a pattern that shows up often enough across stamping operations to be worth walking through.
Who Actually Owns This Decision
A spares strategy touches more than one desk. Each role asks a different question of the same wear and cost data, which is why the numbers need to live somewhere all three can see.
A Worked Comparison, Step by Step
Seeing the arithmetic laid out once makes it easier to repeat for every A-tier part on a spares list. None of the inputs below require special software — just the plant's own numbers, written down and multiplied.
| Input | Illustrative value | Role in the comparison |
|---|---|---|
| Part value | Price of the die component | Multiplied by the holding rate |
| Holding rate | 15–30% annually | Sets the yearly cost of holding the part |
| Downtime cost per hour | Press-specific, not plant-wide | Scales the cost of waiting for a replacement |
| Vendor lead time | Current, re-confirmed figure | Converts to hours of downtime if a stockout occurs |
| Annual failure probability | From wear data, not a flat guess | Weights the stockout cost to an expected value |
Where iFactory AI Fits
A sound spares strategy needs three inputs: real wear data, real downtime cost per press, and current vendor lead times. Collecting all three by hand, press by press, part by part, is where most plants run out of time before they run out of will. iFactory AI supplies the first and makes the other two visible in the same place.
Die Wear Signals
Force, acoustic, and stroke-load data show a die's actual remaining life, not an assumed failure rate.
Press-Level Downtime Cost
Each press's real downtime impact, not a single plant-wide average applied everywhere.
Lead-Time-Aware Alerts
Wear trend compared against vendor lead time, flagging the order point before the failure point.
Per-Press Criticality
The same part classified differently on a bottleneck press than on a redundant line, automatically.
When Demand Swings, So Does the Answer
A spares comparison built on a steady annual failure rate quietly assumes the line runs the same way all year. A model-year changeover or a seasonal production surge can change both sides of the equation at once, which is exactly when an old answer stops being the right one — and exactly when a plant can least afford to find that out the hard way.
Frequently Asked Questions
Does this replace our existing ERP or inventory system?
No. iFactory AI is not an inventory or purchasing system. It supplies the wear data and downtime-cost context that your existing ERP or spares list is usually missing, so the stocking decisions it already supports are based on real numbers rather than habit. Your current purchasing workflow stays exactly where it is. Support can walk through how the data feeds your current system.
How is this different from a standard ABC inventory classification?
ABC classification sorts parts by value and volume, which is a useful starting filter but says nothing about how close a specific die actually is to failing. This approach adds the wear signal and the current vendor lead time on top of that sort, so the A-tier parts — the ones worth the analysis — get an answer based on real condition data rather than a generic annual failure assumption.
What if our vendor lead times change often?
They usually do, more often than most spares lists get reviewed. Because lead time is one of the two numbers that decides the stocking answer, a list that hasn't been checked in a year or more is likely carrying a stale assumption. Revisiting lead times whenever a part's order comes in keeps the comparison current without turning it into a full annual audit. Ask about mapping current lead times against your dies in a short session.
Can the same part really need a different answer on two different presses?
Yes, and this is one of the most common mistakes in a plant-wide spares list. The part's price doesn't change between presses, but the downtime cost during a wait absolutely does — a bottleneck press with no backup carries far more expected stockout cost than a press with redundancy. Classify by the press's exposure first, not only the part's value. A plant running the same part number across five presses with five different criticality levels can easily end up with five different right answers, not one blanket policy.
How long before wear data is reliable enough to drive a stocking decision?
A baseline on actively running dies can build within the rollout window, since force and acoustic signals are already present every stroke. Confidence grows as more wear cycles and, ideally, a regrind or two are observed and compared against the predicted trend. Dies with a steady, well-documented wear history tend to calibrate fastest, while newer tooling with little run history takes a few more cycles before the prediction earns the same confidence. Ask support about the baseline-building timeline for your specific die types.
Stop Guessing Which Spares Are Worth Stocking
iFactory AI turns die wear data and vendor lead times into a real hold-or-order answer for every critical part. Book a walkthrough on your own press line.