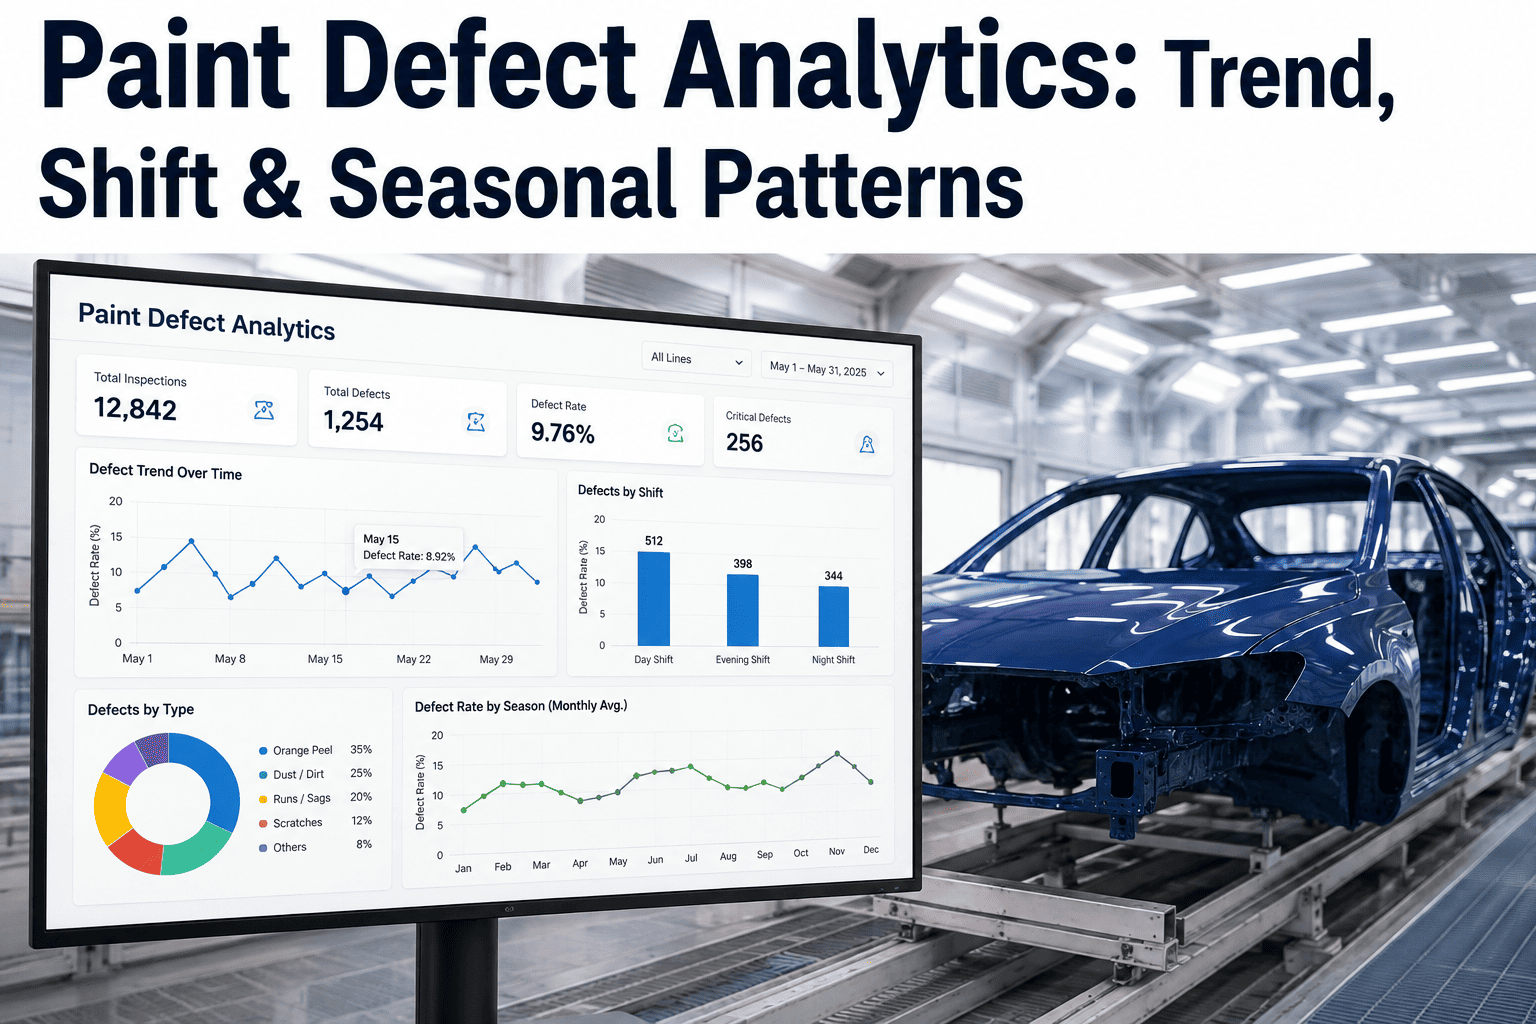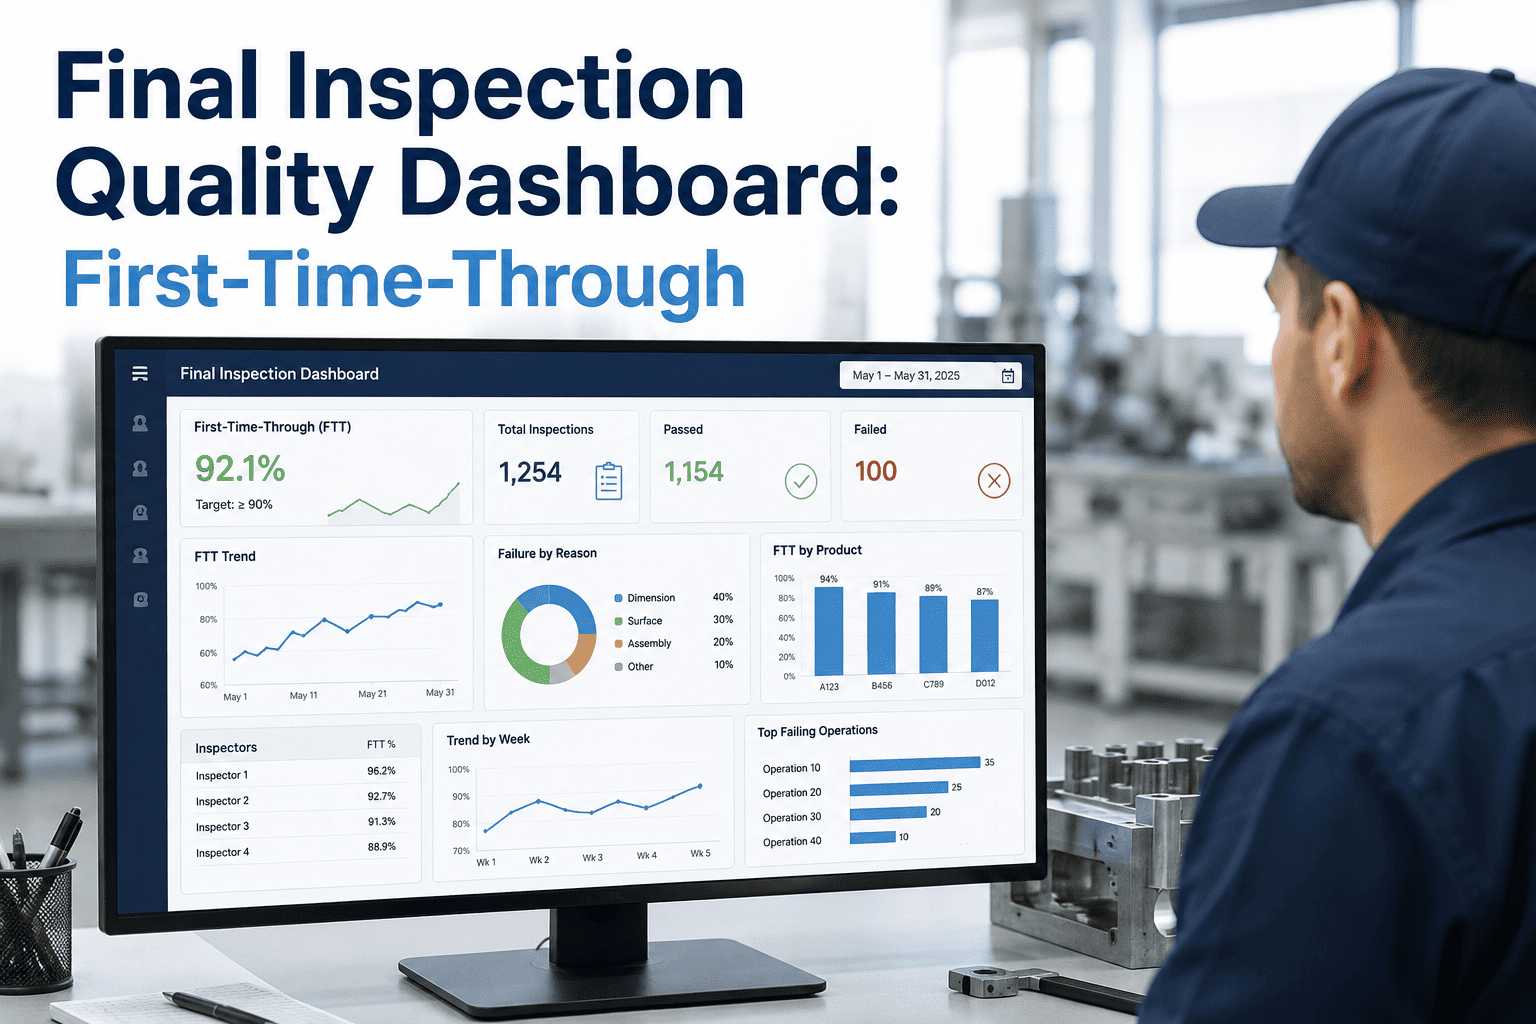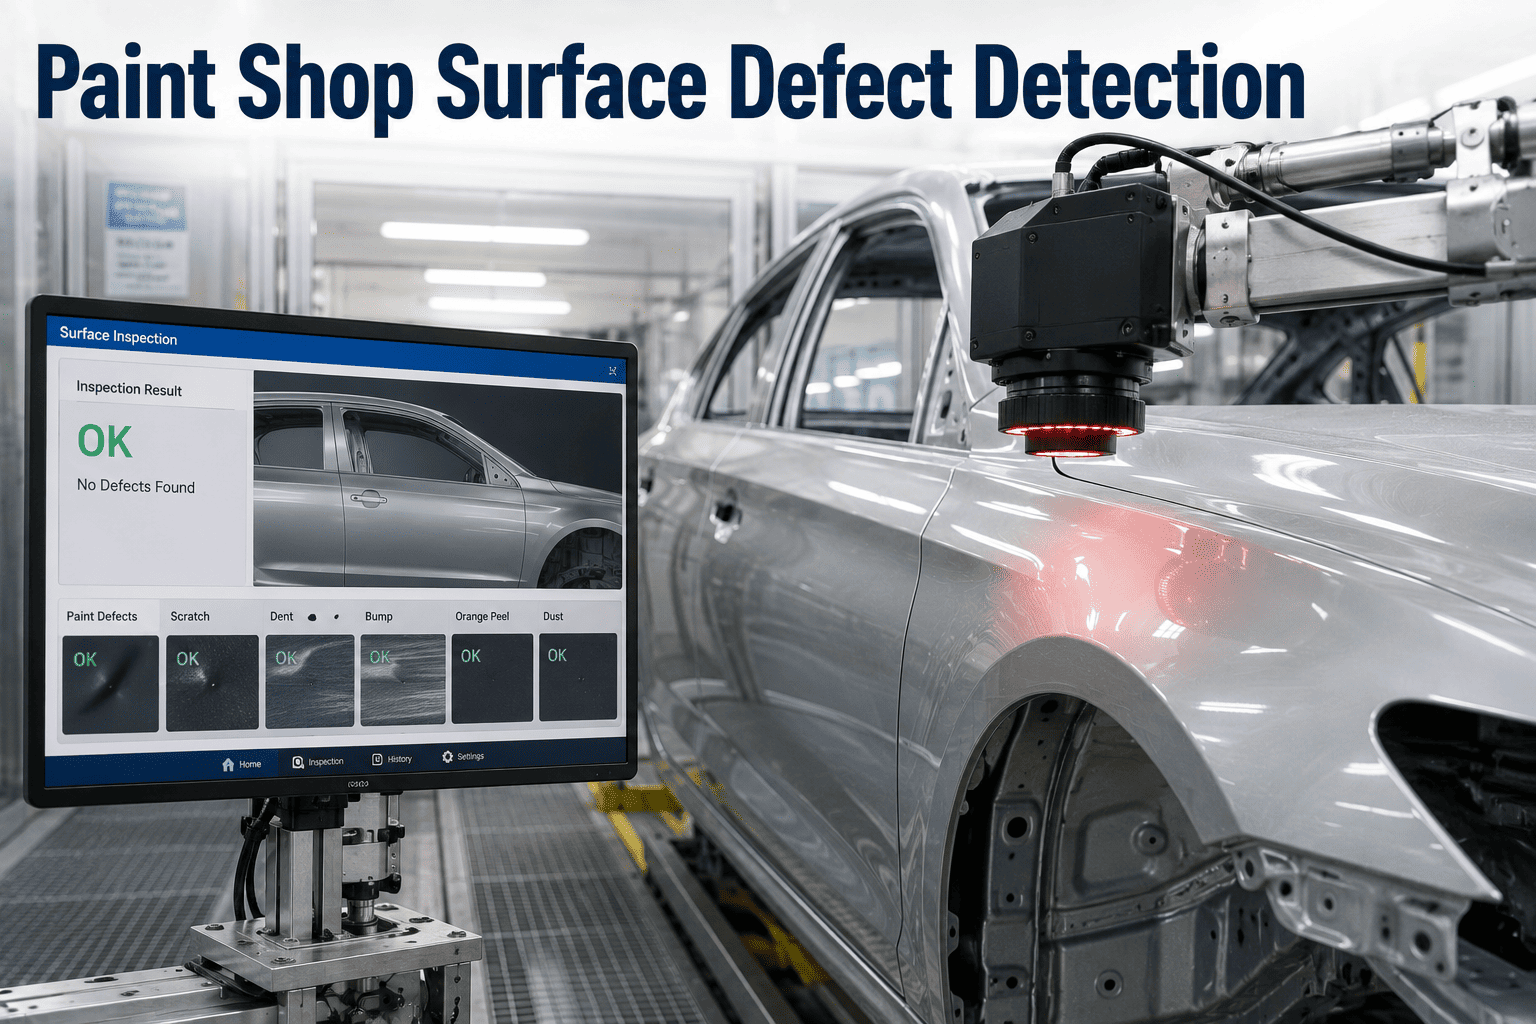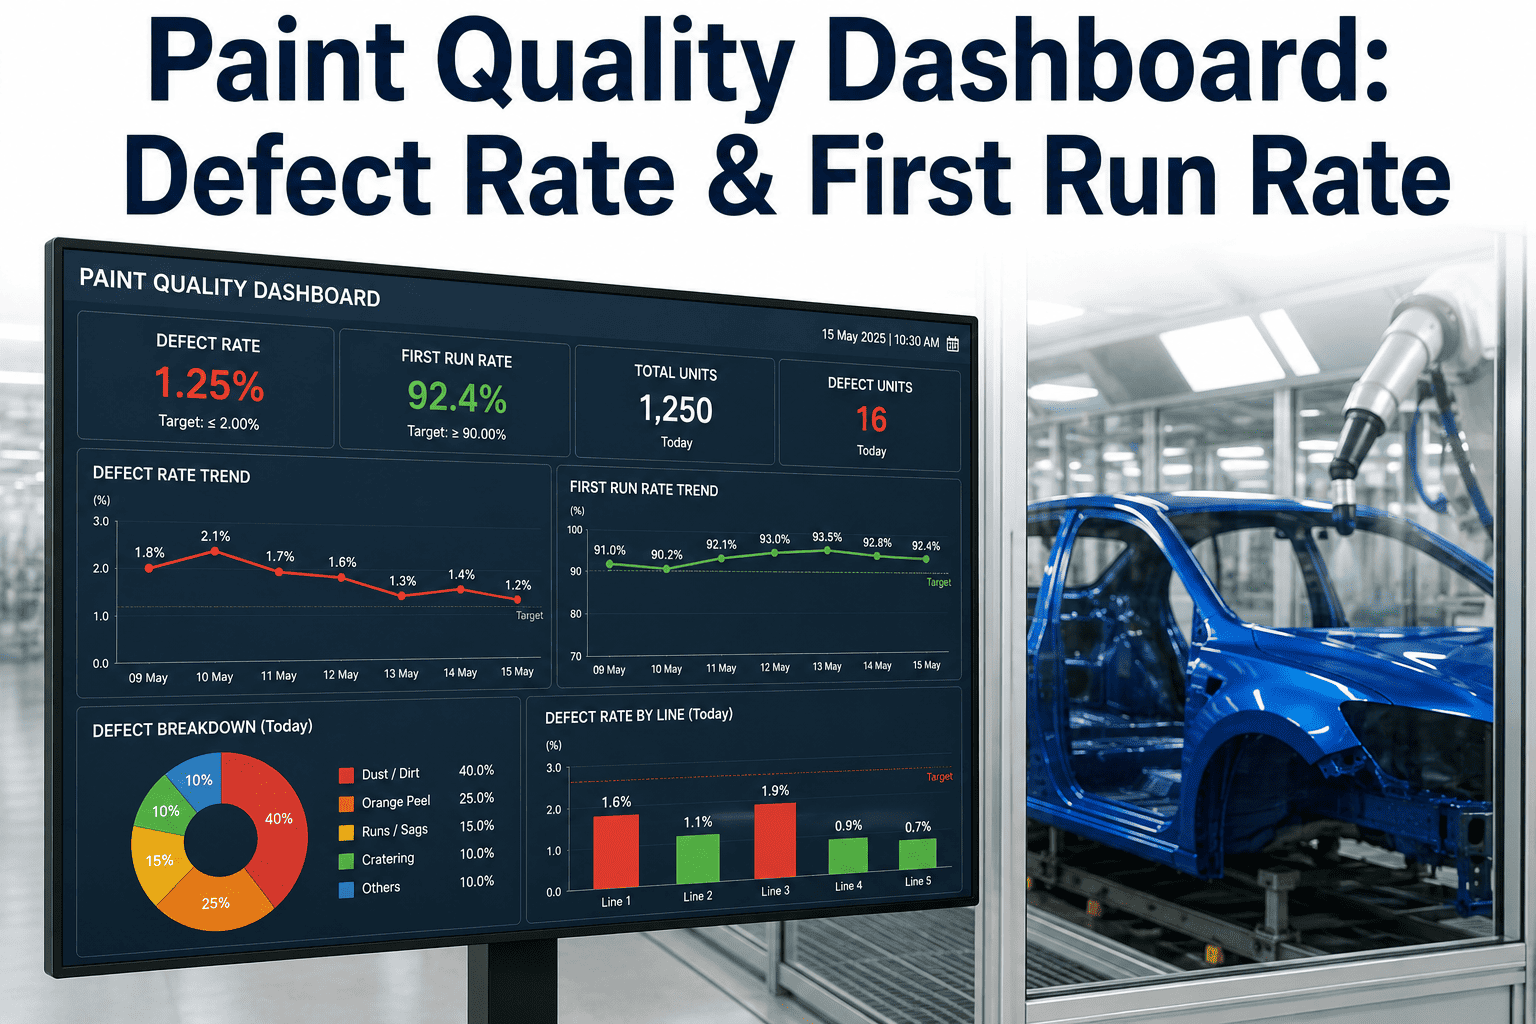
Ask a paint shop manager how the line is running and the answer usually comes back as a feeling — "pretty good today" or "we had a rough patch on second shift" — because the actual numbers are scattered across a quality binder, an MES screen nobody checks between shift changes, and a warranty spreadsheet that updates monthly. A paint quality dashboard exists to replace that feeling with four numbers everyone on the floor can see and agree on: defect rate, first-run rate, rework percentage, and the warranty trend those first three numbers are quietly predicting weeks in advance. iFactory builds that dashboard directly from booth-exit inspection data, not a manual report compiled after the fact.
Four Numbers That Should Be on Every Screen in the Paint Shop, Updated in Real Time
Defect rate, first-run rate, rework percentage, and warranty trend aren't four separate reports — they're one connected story about paint shop performance, and a dashboard that shows all four together is what actually changes behavior on the floor.
Four KPIs, Four Different Questions Each One Answers
Each of the four core paint quality metrics exists to answer a distinct question, and none of them substitutes for the others. A dashboard built around only one — usually defect rate, because it's the easiest to count — leaves the other three questions unanswered until they surface as a much more expensive problem downstream.
The reason all four matter together rather than any one alone comes down to what each metric can and can't see. Defect rate tells you what's wrong today. First-run rate tells you whether the process itself is stable. Rework percentage tells you what instability actually costs in labor and throughput. Warranty trend tells you what all three of the others missed. A dashboard leaning on just one of these is answering only a quarter of the question a paint shop manager actually needs answered.
How Many Defects, Where
The raw count of defects per vehicle or per hundred units, broken down by defect type and booth zone, showing what's actually going wrong right now.
How Many Pass Without Touching
The share of vehicles that clear final inspection with zero rework required, the single clearest signal of whether the process itself is stable.
What It's Actually Costing
The share of production hours and labor consumed correcting defects after the fact, converting a quality number into a cost number leadership actually reacts to.
What Escaped the Plant Entirely
Paint-related warranty claims tracked back to the production window that built the vehicle, revealing which defects the plant's own inspection never caught at all.
Why First-Run Rate Matters More Than the Final Defect Count
A plant that looks fine on final defect count can still be running an expensive, unstable process, because a low final defect number often just means the rework loop is doing a lot of invisible work to get there. First-run rate cuts through that by measuring what passed inspection the first time, before any correction — which is the number that actually reflects whether the paint process itself is under control.
This distinction matters because final defect count and first-run rate can diverge sharply without either number looking alarming on its own. A shop where every vehicle eventually clears inspection, but a rising share needs a second or third pass to get there, will show a stable final defect count month over month while first-run rate quietly erodes underneath it — and that erosion is precisely the leading indicator a dashboard built around final counts alone will never surface in time to act on.
A vehicle that needed three rework passes to clear inspection counts identically to one that passed clean the first time
Hides a growing rework burden behind a final number that still looks acceptable
Every vehicle that needed even one rework pass is counted separately from a true first-time pass
Surfaces process instability weeks before it would otherwise show up as a rising cost line
A first-run rate holding above roughly 95% is generally considered strong performance in a high-volume paint shop, and a plant tracking only final defect count has no way to know if it's actually operating near that level or quietly compensating for a process problem through repeated rework.
A Clean Final Number Can Hide an Expensive Rework Loop Underneath It
iFactory tracks first-run rate alongside defect count, so process instability shows up before it becomes a cost problem nobody can explain.
The Escalating Cost of the Same Defect, Depending on Where It's Caught
The same physical paint defect costs dramatically different amounts depending on which stage catches it, which is exactly why a dashboard connecting defect rate to rework percentage in real time is worth more than either metric reviewed in isolation after the fact.
This cost escalation is precisely what makes rework percentage such a valuable metric to track continuously rather than reviewing after a batch of rework has already accumulated. A defect corrected within the same shift it was created, while the relevant booth parameters and material batch are still fresh in everyone's mind, is a fundamentally cheaper and easier fix than the same defect diagnosed days later during a periodic report review, once the specific conditions that caused it have already changed.
Caught Before Cure
A defect flagged and corrected while the clear coat is still wet costs a small fraction of what the same defect costs at any later stage, since the fix is often a quick wipe or touch-up rather than a full rework cycle.
Caught After Cure
Once the finish has cured, correcting a defect requires sanding, re-coating, and re-curing — a meaningfully more expensive process consuming both material and booth time.
Found at the Dealer
A defect that escapes the plant entirely and surfaces at the dealership costs several times more again, factoring in dealer labor, parts, and the warranty administration overhead layered on top.
This cost curve is exactly why the dashboard's fourth metric — warranty trend — matters as much as the three plant-floor numbers. A rising warranty trend on a specific defect type, traced back to the production window that built those vehicles, is the clearest evidence available that the first three metrics missed something real.
Connecting the Four Metrics Into One Continuous Signal
The real value of a paint quality dashboard isn't any single metric — it's the connection between them, since a shift in one almost always shows up as a lagging signal in the next. A dashboard that displays all four together, correlated by time and production window, turns four separate numbers into one early-warning system.
Building that connection requires more than putting four charts on the same screen — it requires the underlying data to share a common reference, typically the vehicle identification number and production timestamp, so that a defect logged at booth exit, a rework hour logged in the MES, and a warranty claim logged months later can all be traced back to the exact same build window automatically, rather than requiring someone to manually cross-reference three separate systems every time a pattern needs investigating.
Defect Rate Rises First
A process drift shows up as an increase in defects per vehicle before it shows up anywhere else, making this the earliest signal in the chain.
First-Run Rate Falls Next
More defects mean fewer vehicles clearing inspection clean, so first-run rate drops shortly after the defect rate climbs.
Rework Percentage and Warranty Trend Follow
Rework cost climbs immediately after, and if the underlying issue isn't caught internally, a warranty trend uptick appears weeks later tied back to the same production window.
Four Metrics Reviewed Separately Miss the Story They're Telling Together
iFactory correlates defect rate, first-run rate, rework percentage, and warranty trend on one live dashboard, so a shift in one surfaces the coming shift in the others.
A Composite Scenario: The Rising Rework Percentage That Predicted a Warranty Spike
A composite mid-size assembly plant running roughly 55 vehicles per hour through its paint shop had been reviewing defect and rework data on a weekly summary report, with warranty claims tracked separately by the customer service team on a monthly cadence. Over a three-week stretch, rework percentage on one specific defect type — clear coat orange peel — climbed steadily, though the weekly summary report didn't flag it as unusual since the overall defect rate stayed within normal range.
Roughly six weeks later, warranty claims for the same defect type began climbing, traced back to vehicles built during that same three-week window. Once the plant implemented a connected real-time dashboard tying all four metrics together, a similar rework percentage rise on a different defect type was caught within days rather than weeks, triggering an immediate booth parameter review that identified a humidity control drift before it produced a comparable warranty spike.
Assumptions That Undermine a Paint Quality Dashboard
A low final defect count on its own is enough to confirm the paint process is under control.
A low final count can mask an expensive, growing rework loop working hard to get there, which is exactly why first-run rate needs to be tracked alongside it rather than assumed from the final number alone.
Warranty data belongs to customer service and doesn't need to connect back to plant-floor quality metrics.
Warranty trend is the clearest evidence of what the plant's own inspection missed, and disconnecting it from production data removes the feedback loop that would otherwise catch a recurring defect pattern early.
A weekly or monthly summary report is frequent enough to catch a developing quality issue.
A process drift can compound for days or weeks between summary reports, and by the time a periodic report reflects it, the affected vehicles have often already shipped.
A Checklist for Evaluating a Paint Quality Dashboard
All four core metrics display together, not as separate reports
A dashboard forcing someone to manually cross-reference four separate sources defeats the purpose of connecting them at all.
Warranty data ties back to a specific production window
Warranty trend only becomes useful as a feedback signal when it's traceable to the shift, line, and time period that built the affected vehicles.
The dashboard updates in real time, not on a periodic report cycle
A metric that only refreshes weekly gives a process drift days to compound before anyone sees it.
Data is broken down by defect type and booth zone, not just a single blended total
A single overall number can hide a serious problem concentrated in one specific zone or defect category.
Frequently Asked Questions
What first-run rate is considered strong performance for an automotive paint shop?
A first-run rate holding above roughly 95% is generally considered strong performance in a high-volume paint shop, though the specific target can vary somewhat depending on vehicle complexity, color mix, and the plant's own historical baseline. Visit support to establish a realistic target for a specific line.
How does warranty data actually get connected back to a specific production window?
Vehicle identification numbers link a warranty claim back to the specific build date, shift, and line the vehicle came from, which lets a dashboard correlate a rising warranty trend on a defect type with the production data from that same window.
Does tracking rework percentage require a separate data collection process from defect tracking?
No — rework percentage is derived from the same booth-exit inspection data used for defect rate, since every unit flagged for rework is already being counted as part of the defect detection process. Book a demo to see how the two metrics share the same underlying data source.
How quickly should a dashboard surface a developing defect pattern to be useful?
A dashboard updating within the same shift the defects occurred gives a plant the chance to investigate and correct a process issue before another full shift of vehicles is affected, which is meaningfully faster than a weekly or monthly summary report allows.
Can a paint quality dashboard integrate with an existing MES rather than replacing it?
Yes — a paint quality dashboard typically pulls defect and inspection data into an existing MES environment and adds the quality-specific correlation layer, rather than requiring a separate standalone system disconnected from production data. Contact support to review integration with a specific existing MES setup.
See Defect Rate, First-Run Rate, Rework, and Warranty Trend on One Screen
iFactory connects booth-exit inspection data to a live paint quality dashboard, so a process drift shows up while it's still cheap to fix.