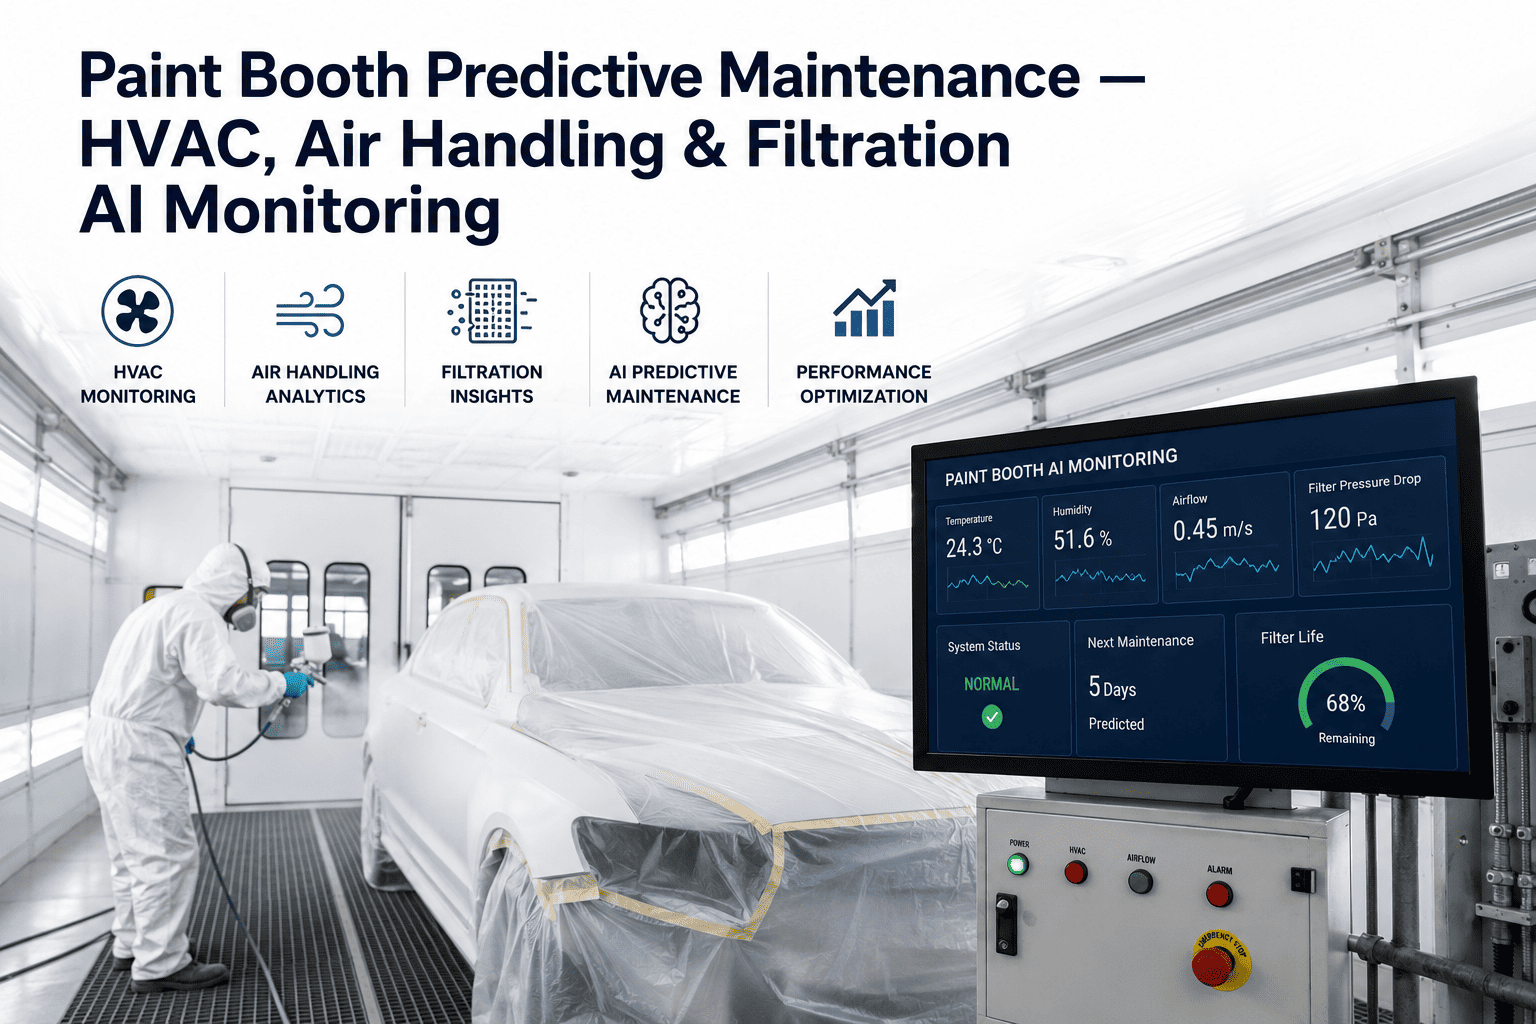
A paint booth running two degrees warmer than spec doesn't trip an alarm, doesn't stop the line, and doesn't show up on any report until a batch of bodies comes back from inspection with orange peel or blistering nobody can explain. Temperature, humidity, and air balance inside a spray booth interact in ways that are invisible to the eye but decisive for finish quality, and most plants only discover they've drifted out of range after the defect rate has already climbed for a shift or two. The plants that have stopped guessing are the ones streaming booth conditions live and catching the drift before the first panel goes bad — if that sounds like where your paint shop needs to be, book a walkthrough with an iFactory environmental control specialist to see it running on your own booth data.
iFactory Paint Shop Intelligence
Paint Booth Environmental Control: AI Management of Air Balance, Humidity, and Temperature
Finish quality is decided by conditions inside the booth long before the gun ever fires — and those conditions shift with every season, every door opening, every change in outside air. This guide covers what to measure, why the tolerance window is so narrow, and how AI keeps every booth inside specification across every shift and every month of the year.
Why Booth Conditions Move More Than Most Teams Realize
A spray booth is not a sealed chamber — it is a constant exchange of large volumes of conditioned air with an outside environment that is never stable. Every truck door opening, every seasonal shift, every filter loading incrementally changes the humidity and temperature the paint actually experiences as it leaves the gun. Waterborne coatings are especially sensitive: too much moisture in the air and the film retains water that later escapes as blistering in the oven; too little moisture and the paint flashes off too fast, losing flow and leaving a rough, textured surface.
Most booths are managed against a fixed target with periodic spot checks from a technician carrying a handheld meter. That approach catches gross failures — a broken heater, a failed humidifier — but it rarely catches the slow drift that happens over a single shift as ambient conditions change outside, and it never catches the difference between one bay and another inside the same booth.
The Business Case for Live Booth Environmental Monitoring
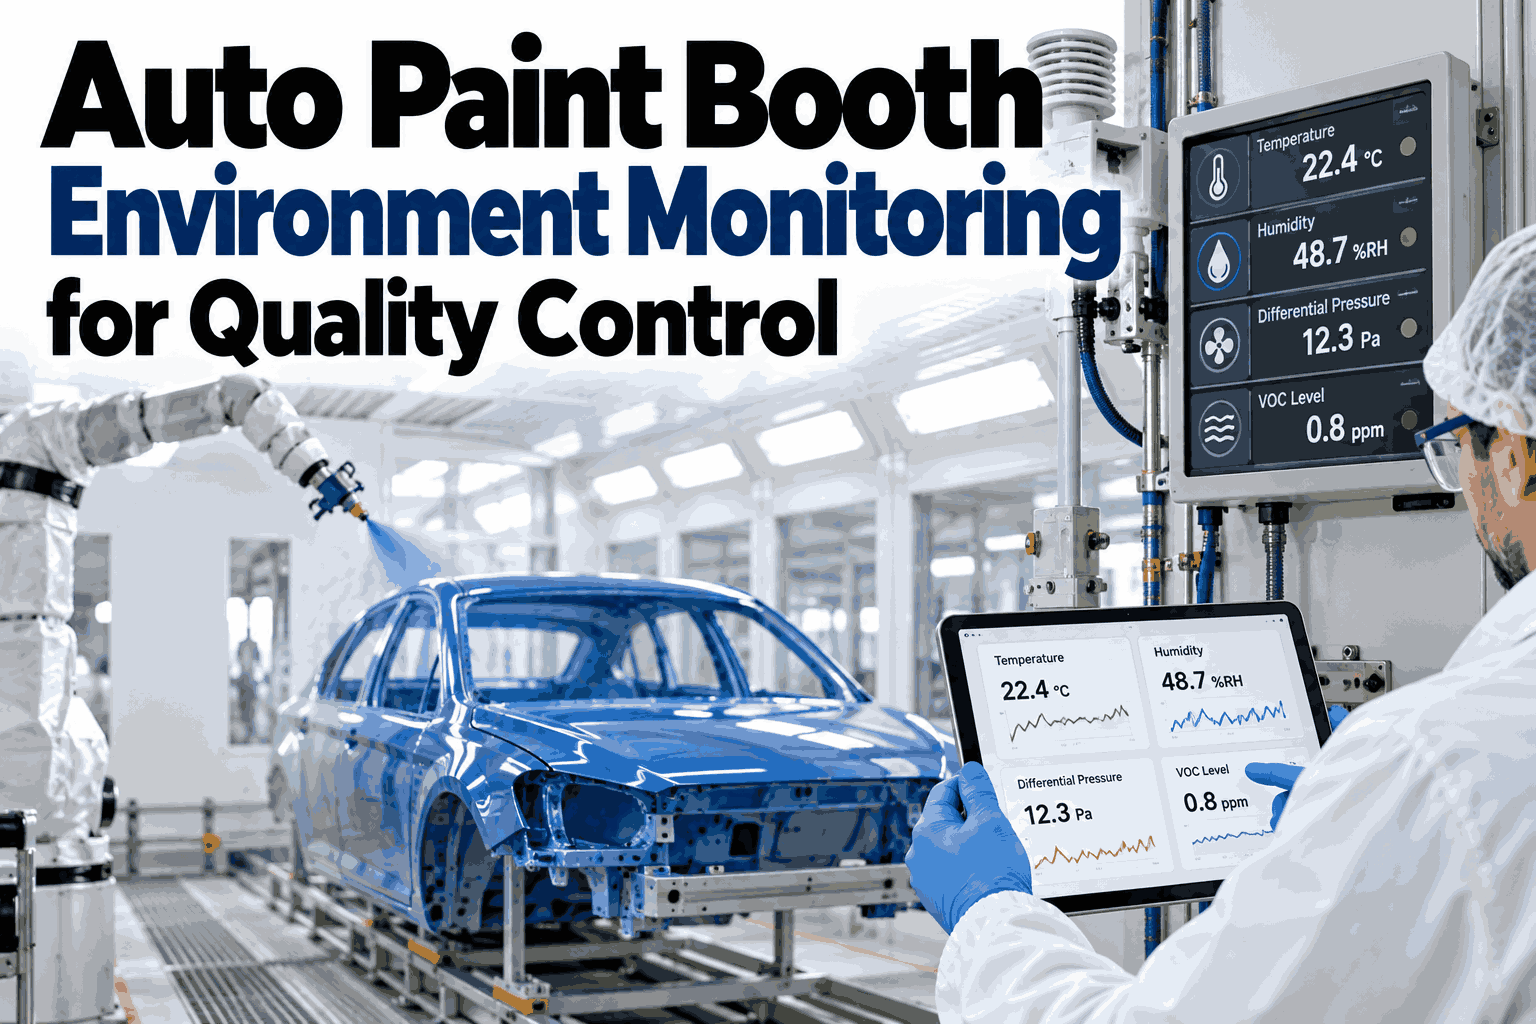
- Continuous temperature and humidity tracking closes the gap between spot checks, catching drift within minutes instead of a full shift
- Zone-level monitoring across booth bays identifies localized imbalance that a single central sensor would never detect
- Seasonal defect spikes become predictable and preventable rather than a recurring surprise every winter and summer
Request an Environmental Audit →
The Three Conditions That Decide Finish Quality
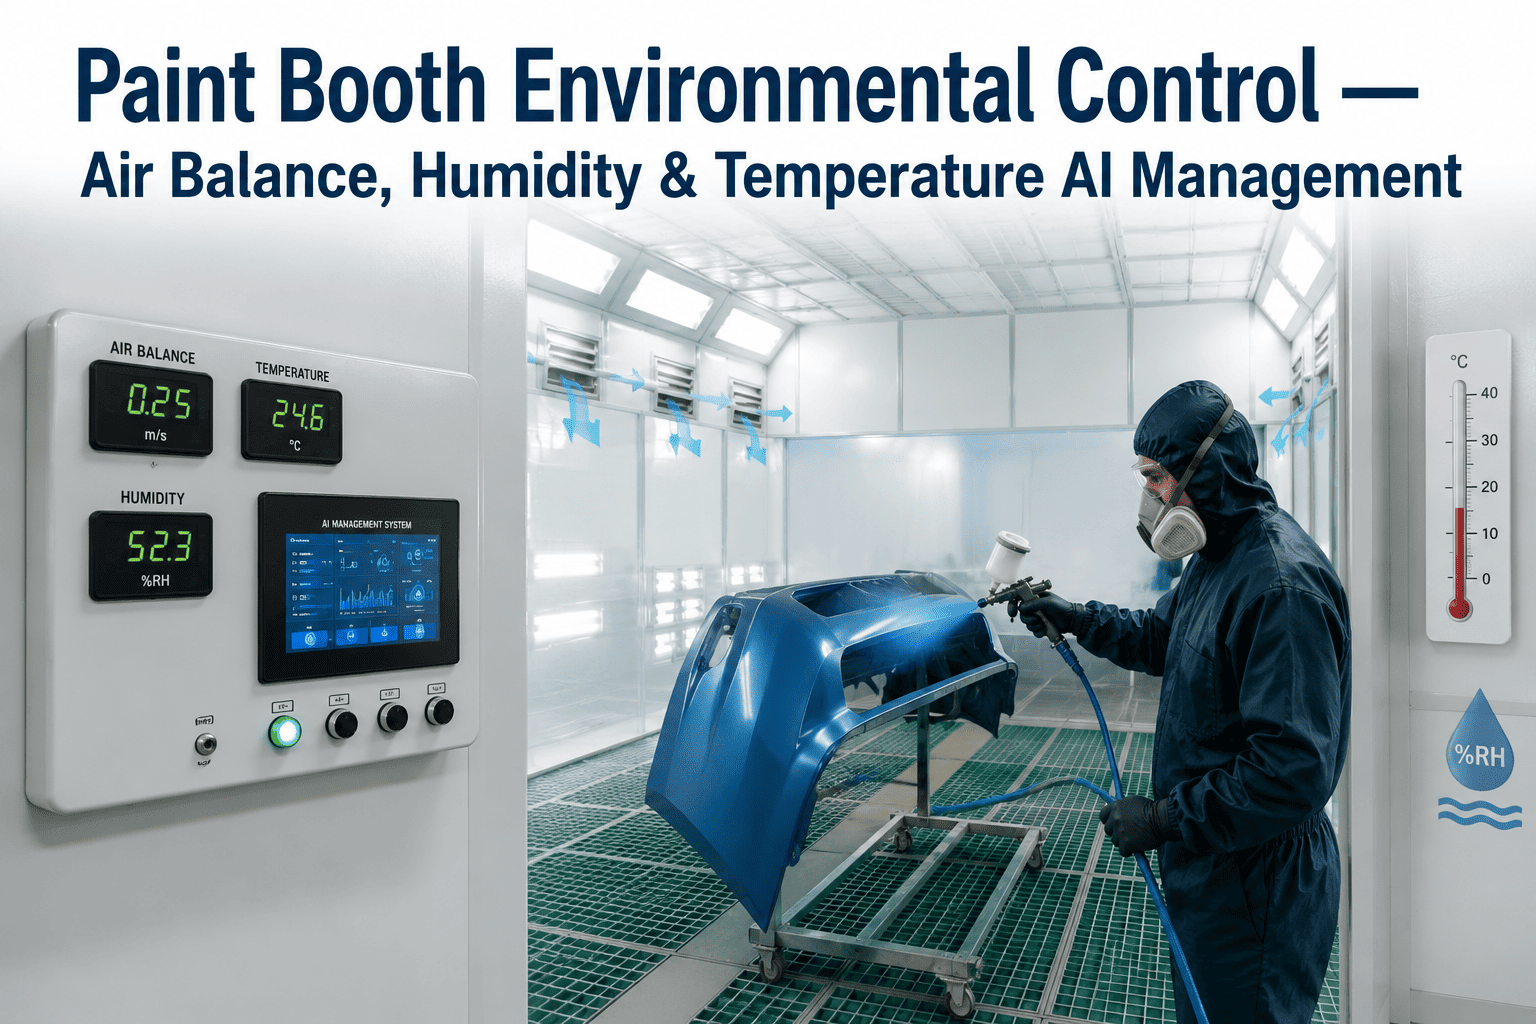
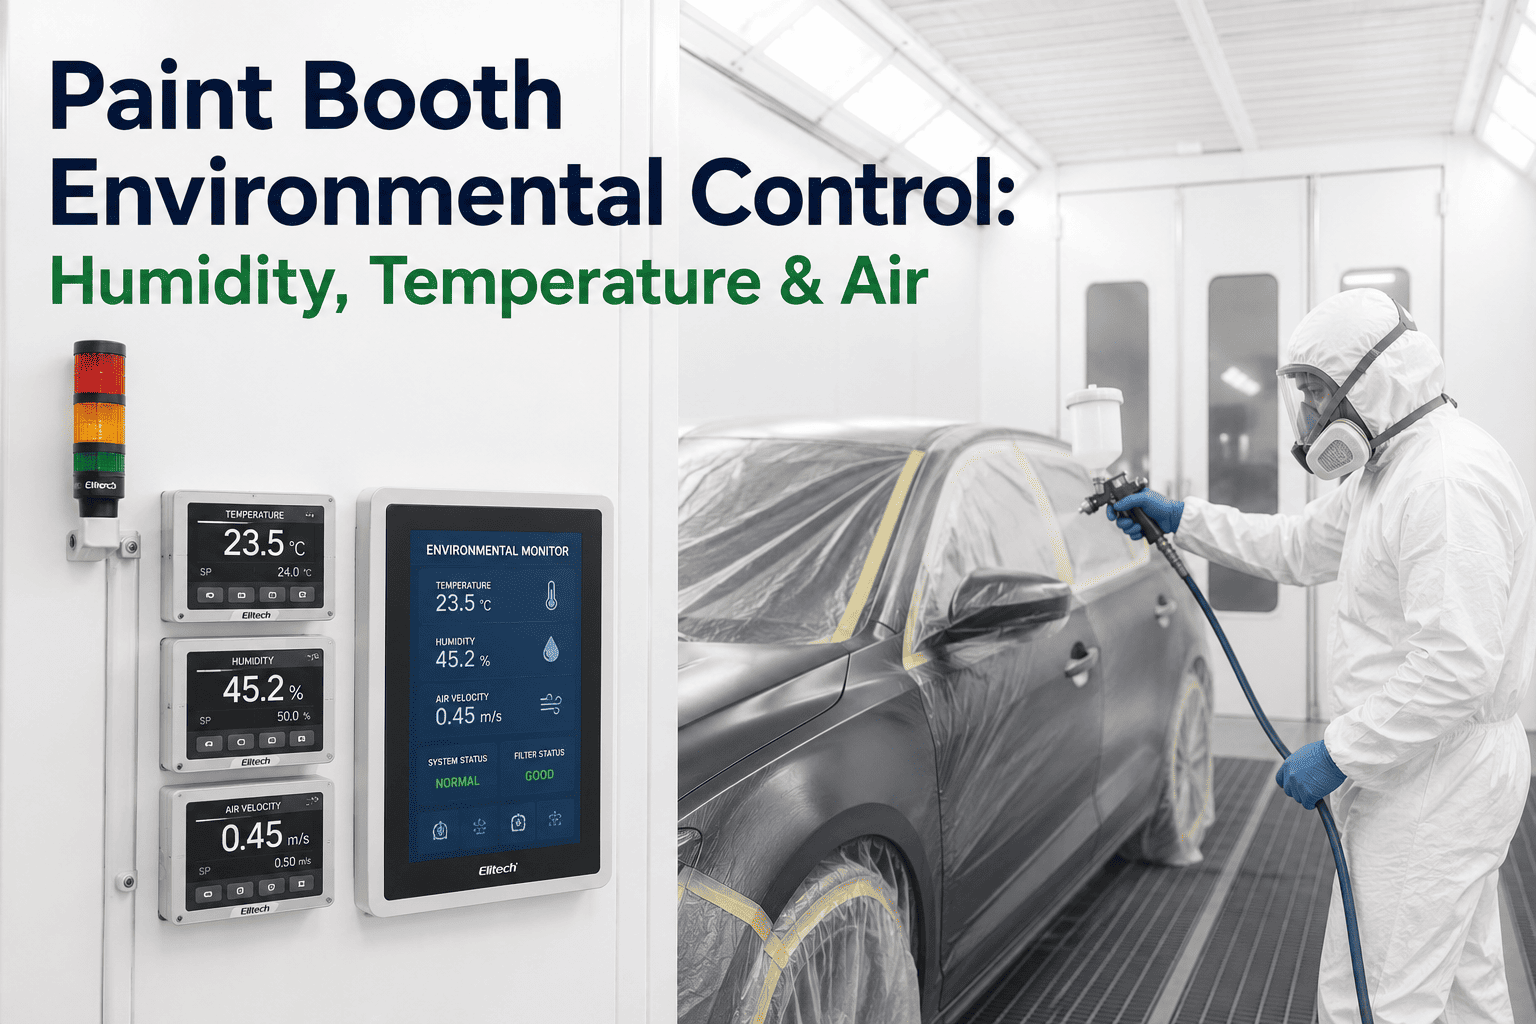
Every booth environmental control programme comes down to keeping three interacting variables inside a narrow band at the same time. The visual below shows the target zone for each, and how far outside that zone typical uncontrolled booths tend to drift across a production day.
Temperature
Target band: 65°F - 75°F (18°C - 24°C)
Drives flash time, flow, and cure onset. Outside this band, viscosity and leveling both suffer.
Relative Humidity
Target band: 40% - 60% RH
Controls solvent and water release rate. High RH causes blushing; low RH causes dry spray and static.
Air Balance
Target band: neutral to slightly positive pressure
Prevents contamination ingress and overspray migration between booth zones.
Legacy Spot-Check Management vs. Live Environmental Control
| Decision Area |
Handheld Spot Checks |
Continuous AI Monitoring |
| Detection Speed |
Technician measures once or twice per shift; drift between checks goes unnoticed. |
Temperature, humidity, and pressure streamed continuously across every booth zone. |
| Zone Coverage |
One reading assumed to represent the entire booth, even across multiple bays. |
Independent sensors per zone catch localized imbalance a single reading would miss. |
| Seasonal Adjustment |
HVAC setpoints adjusted manually and reactively after defects are already reported. |
AI anticipates seasonal drift patterns and recommends setpoint changes proactively. |
| Root Cause Analysis |
Defect investigation relies on memory of conditions from hours or days earlier. |
Every defect batch can be cross-referenced against logged booth conditions at time of spray. |
| Energy Cost |
HVAC runs on fixed schedules regardless of actual booth demand or outside conditions. |
Conditioning output modulates against live demand, reducing energy waste without risking quality. |
See live temperature, humidity, and pressure dashboards for every bay in your booth
Book a Demo
How Seasonal Conditions Change Your Defect Risk
The same booth, running the same paint system, behaves differently in January than it does in July. Understanding the seasonal pattern is the first step to controlling it rather than reacting to it every year.
Winter
Dry outside air pulls booth humidity down fast. Static buildup increases, paint flashes before leveling, and dry spray defects climb without active humidification.
Spring
Rapid swings in outside temperature and humidity strain HVAC systems designed for steady-state operation, producing the widest day-to-day variance of any season.
Summer
High ambient humidity slows solvent and water release, increasing blushing risk and extending flash times unless dehumidification keeps pace with makeup air load.
Fall
Transition season where HVAC setpoints often lag behind actual outside conditions, creating a recurring window of avoidable defect spikes each year.
Deployment Timeline: From Sensor Install to Predictive Setpoint Control
Week 1-2
Temperature, humidity, and differential pressure sensors installed per booth zone
Wireless sensors placed across each bay and connected to existing HVAC control systems without production disruption.
Week 3-4
Live environmental dashboards active for paint shop supervisors
Zone-level readings visible in real time, with historical trend data compared against defect logs.
Week 5-8
AI correlates booth conditions with quality inspection results
Defect patterns matched against environmental history to validate which variables drive which failure modes at your plant.
Month 3-6
Predictive setpoint recommendations ahead of seasonal transitions
HVAC adjustments recommended proactively based on weather forecasts and learned seasonal defect patterns.
Frequently Asked Questions
Do we need to replace our existing HVAC and booth control system?
No. iFactory's environmental monitoring layer connects to your existing booth HVAC and building management system through standard protocols, adding live visibility and predictive alerts without requiring a hardware replacement. Most plants keep their current conditioning equipment and simply gain a real-time analytics layer on top. You can review your specific HVAC setup with a specialist through
iFactory support.
How many sensors are needed to properly cover one paint booth?
Coverage depends on booth size and bay configuration, but most automotive booths require between six and twelve zone sensors to capture meaningful variation across the spray area, flash zone, and bake oven entry. A site assessment determines exact placement based on airflow patterns and known problem areas from your defect history.
Can this system predict seasonal defect spikes before they happen?
Yes. Once the AI model has learned your plant's specific relationship between environmental conditions and defect rates, it can flag rising risk as outside weather trends toward historically problematic ranges, giving supervisors days of lead time to adjust HVAC setpoints proactively rather than reacting after defect rates have already climbed.
Will tighter environmental control increase our energy costs?
In most deployments, energy costs actually decrease because HVAC output is modulated against live demand rather than run on a fixed schedule regardless of actual need. Booths often overcondition during mild weather out of caution; live data allows conditioning to scale down safely when outside conditions already favor the target range, recovering energy spend previously spent on unnecessary overcorrection.
How long before we see a measurable reduction in defect rate?
Most plants see the first measurable improvement in defect rate within six to eight weeks of go-live, once the model has correlated enough shift data against quality outcomes to validate its recommendations. Full seasonal benefit is typically confirmed after the platform has observed at least one complete seasonal transition, which our team can walk through when you
schedule a session with an engineer.
Stop Reacting to Seasonal Defect Spikes
Your Booth Conditions Are Shifting Right Now. Are They Inside Spec?
iFactory's live environmental dashboards give paint shop teams zone-level visibility into every condition that decides finish quality — and the predictive lead time to act before a defect batch happens. Sensor install in two weeks. First quality correlation within eight.