Quality Prediction Digital Twin: Process Parameter Model

By James Smith on September 9, 2026

quality-prediction-digital-twin-process-parameter-model

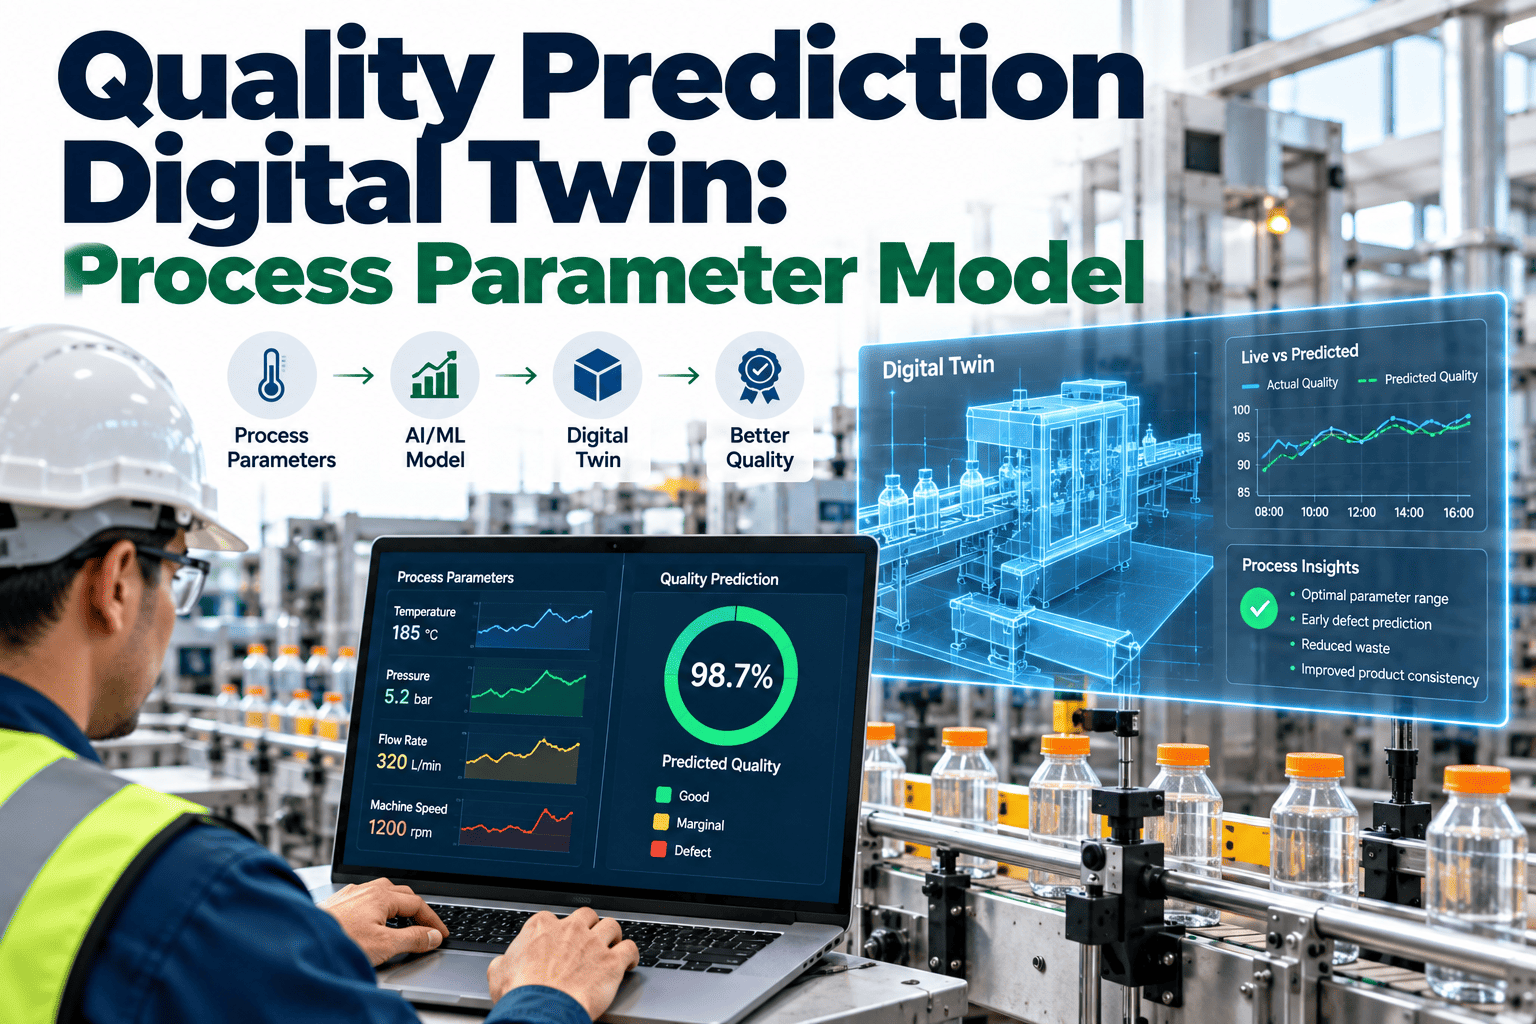
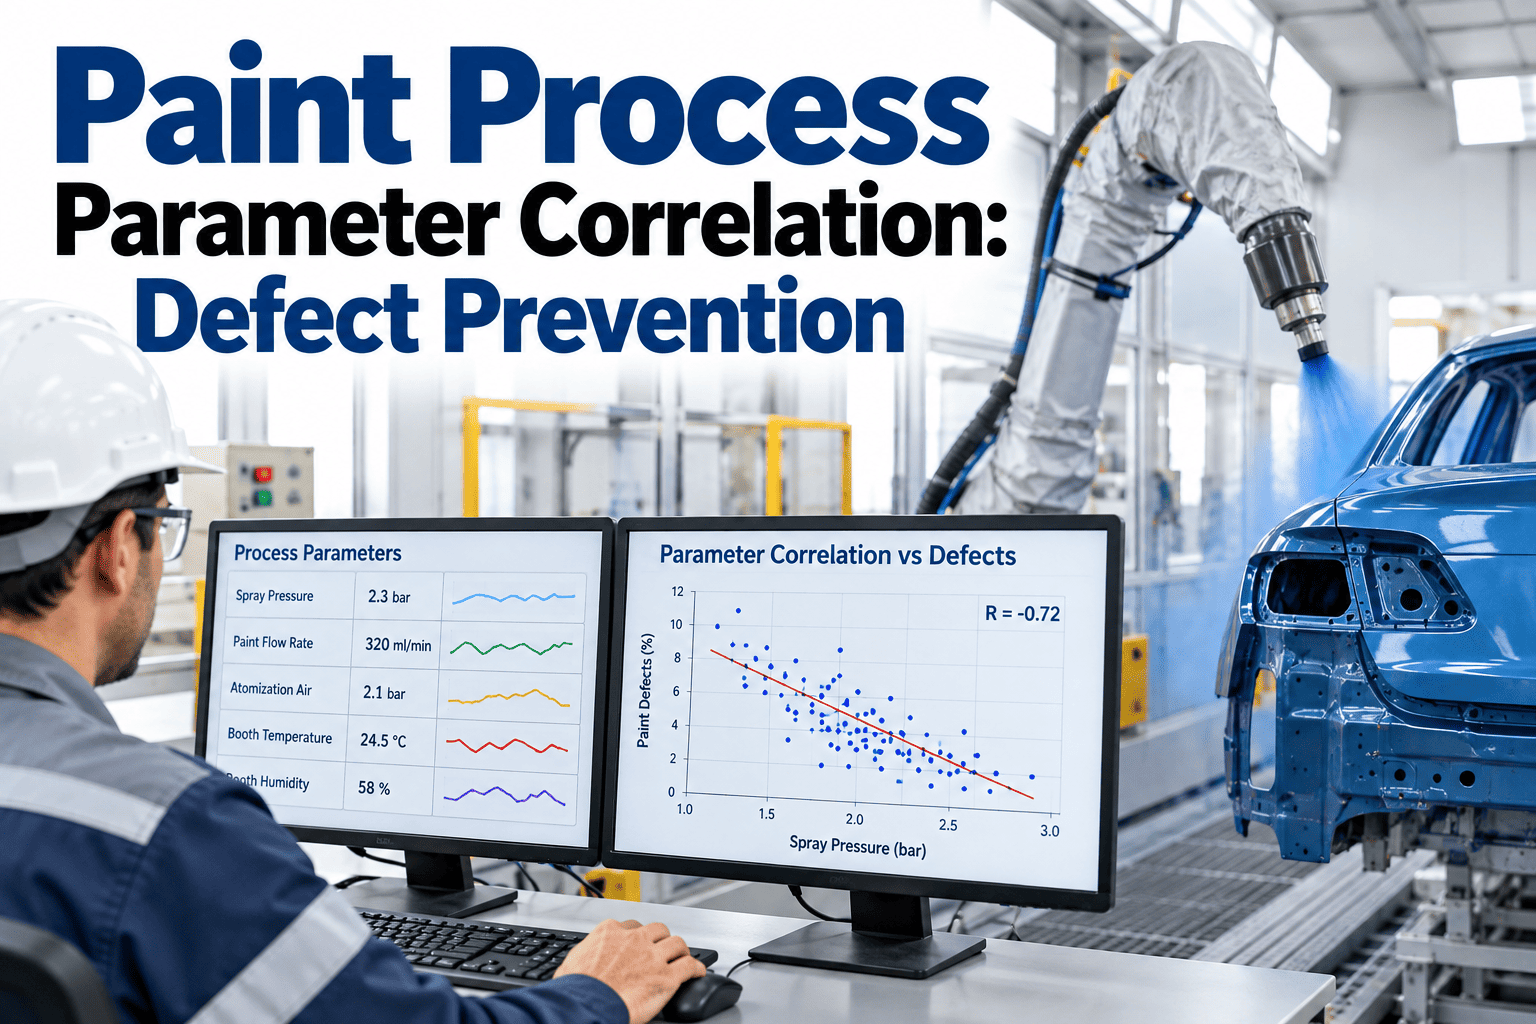
By the time a defect shows up on the inspection line, the process parameters that actually caused it were set hours earlier, and the connection between the two is usually reconstructed after the fact through a root cause investigation rather than known in advance. A quality prediction digital twin flips this sequence: instead of waiting for a defect to occur and then tracing it backward to a process cause, the model learns the relationship between process parameters and defect probability directly from historical production data, then predicts the likelihood of a quality problem before the parts are even made. This shift from reactive investigation to proactive prediction is a meaningful change in how a quality team spends its time, moving engineering attention away from repeated after-the-fact root cause exercises and toward preventing the same category of problem from recurring in the first place. This lets engineers adjust settings proactively when the model flags a parameter combination trending toward a known defect signature, rather than discovering the problem only after a batch has already been produced. If you want to see what your own process data reveals about parameter-to-defect relationships, you can book a demo with iFactory's team.

DIGITAL TWIN · QUALITY PREDICTION · PROCESS PARAMETERS

Predict Defect Probability From Process Parameters Before Parts Are Made

iFactory's quality prediction model learns the relationship between your process parameters and defect outcomes, flagging risky settings combinations before they produce a bad part.

PARAMETER SENSITIVITY

Not Every Process Parameter Affects Quality Equally

A typical automotive process has dozens of adjustable parameters, but only a handful of them actually drive meaningful variation in defect rate. Identifying which parameters matter most is the first output of a quality prediction model, and it is often surprising to engineers who assumed a different parameter was the dominant factor, since intuition built from years of experience does not always match what the actual historical data shows once it is analyzed rigorously rather than relied upon anecdotally.

Injection Temperature
High Sensitivity
Hold Pressure
High Sensitivity
Cycle Time
Moderate Sensitivity
Mold Cooling Rate
Moderate Sensitivity
Ambient Humidity
Low Sensitivity
HOW THE MODEL LEARNS

Building a Prediction Model From Your Own Production History

The prediction model is not a generic industry formula. It is trained specifically on your process, using the actual relationship between parameter settings and quality outcomes observed in your own historical production data. This specificity matters because the same nominal parameter, such as injection temperature, can have a completely different sensitivity profile depending on the exact material, tooling, and part geometry involved, meaning a generic rule of thumb borrowed from industry literature is a poor substitute for a model built on your own actual production history.

1

Historical Data Collection

Process parameter logs are paired with corresponding quality inspection results from the same production runs, building a labeled dataset.

2

Sensitivity Analysis

The model identifies which parameters show the strongest statistical relationship to defect occurrence, filtering out variables with minimal actual influence.

3

Prediction Model Training

A model is trained to estimate defect probability as a function of the identified high-sensitivity parameters, validated against a holdout dataset.

4

Live Deployment and Refinement

The model runs against live parameter data, flagging risky combinations, and continues learning as new production outcomes accumulate.

Find Out Which Parameters Actually Drive Your Defect Rate

iFactory will run a sensitivity analysis on your historical process and quality data to show which settings matter most.

FINDING THE OPTIMAL WINDOW

Using the Model to Identify Settings That Minimize Defect Risk

Once the relationship between parameters and defect probability is established, the model can be used in reverse: instead of just predicting defect probability for a given setting, it can identify the parameter combination that minimizes predicted risk while staying within acceptable process and cycle time constraints. This reverse-search capability is where the model shifts from a diagnostic tool into a genuinely prescriptive one, moving beyond explaining why a defect occurred toward actively recommending the settings least likely to produce one in the first place.

Current Operating Point

The settings currently in use, along with the model's predicted defect probability at that specific combination of parameters.

Predicted Optimal Window

The parameter range the model identifies as minimizing defect probability, accounting for interactions between multiple parameters simultaneously.

Constraint Boundaries

Cycle time, energy cost, and equipment limits that bound the search for an optimal window, ensuring recommendations remain practically achievable.

MEASURED RESULTS

Outcomes From Automotive Plants Using Quality Prediction Models

The figures below reflect aggregated results from automotive manufacturing processes that implemented parameter-based defect prediction after previously relying on reactive root cause investigation alone.

37%
Reduction in Defect Rate on Modeled Processes
Proactive parameter adjustment based on predicted risk prevented a meaningful share of defects before they were produced.
4-6
Typical High-Sensitivity Parameters Identified
Out of dozens of adjustable parameters on a typical process, only a small subset actually drives most defect variation.
58%
Faster Root Cause Identification for New Defects
When a new defect pattern emerges, the existing sensitivity model narrows the investigation to the parameters most likely responsible.
FREQUENTLY ASKED QUESTIONS

Questions Process Engineers Ask About Quality Prediction Models

How much historical data is actually needed to train a reliable quality prediction model?
The required volume depends on how frequently defects occur and how many parameters are being evaluated, but most automotive processes with a reasonably consistent defect rate and several months of paired parameter and quality data can produce a usable initial model, with accuracy generally improving as more production cycles and a wider range of parameter combinations are incorporated into the training dataset over time. Book a demo to evaluate whether your existing historical data is sufficient to start.
Can the model account for interactions between multiple parameters rather than treating each one independently?
Yes, and this is one of the more valuable capabilities of a properly built prediction model, since many real-world quality problems arise from the interaction between two or more parameters rather than any single parameter in isolation, such as a specific combination of temperature and pressure that only becomes problematic together even though each parameter individually stays within its normal acceptable range, a pattern that traditional single-variable control charts are not designed to catch. Contact support to discuss multi-parameter interaction modeling for your process.
How often does the prediction model need to be retrained as our process or materials change?
A material change, a new supplier, or a significant equipment modification generally warrants a retraining cycle since the underlying relationship between parameters and defect probability may shift with these changes, while in the absence of such events, periodic retraining on an ongoing basis, incorporating recent production data, keeps the model current with normal gradual process evolution without requiring a full rebuild from scratch each time. Book a demo to discuss a retraining cadence appropriate for your process.
Does using this model reduce our reliance on traditional SPC and control charting?
The two approaches complement each other rather than one replacing the other: control charts remain valuable for real-time monitoring of whether a process is behaving consistently with its own history, while the prediction model adds a forward-looking layer that estimates defect risk based on the specific combination of settings currently in use, meaning a process can be perfectly in statistical control by traditional SPC standards while still running at a parameter combination the prediction model flags as higher risk than an available alternative. Contact support to discuss how prediction modeling fits alongside your existing SPC program.
How confident should we be in a recommended optimal parameter window before actually changing production settings?
Any recommended parameter change identified through the model should go through the same validation process as any other process change, typically a controlled trial run comparing output at the recommended settings against the current baseline before committing to a permanent change, since the model's recommendation is a statistically informed hypothesis based on historical data rather than a guarantee, and real-world validation confirms the predicted improvement actually holds under current production conditions. Book a demo to discuss a validation process for parameter recommendations.

Catch Quality Risk in the Settings, Not the Inspection Report

iFactory predicts defect probability from your process parameters before parts are made. Book a demo to see the model applied to your own process.


Share This Story, Choose Your Platform!