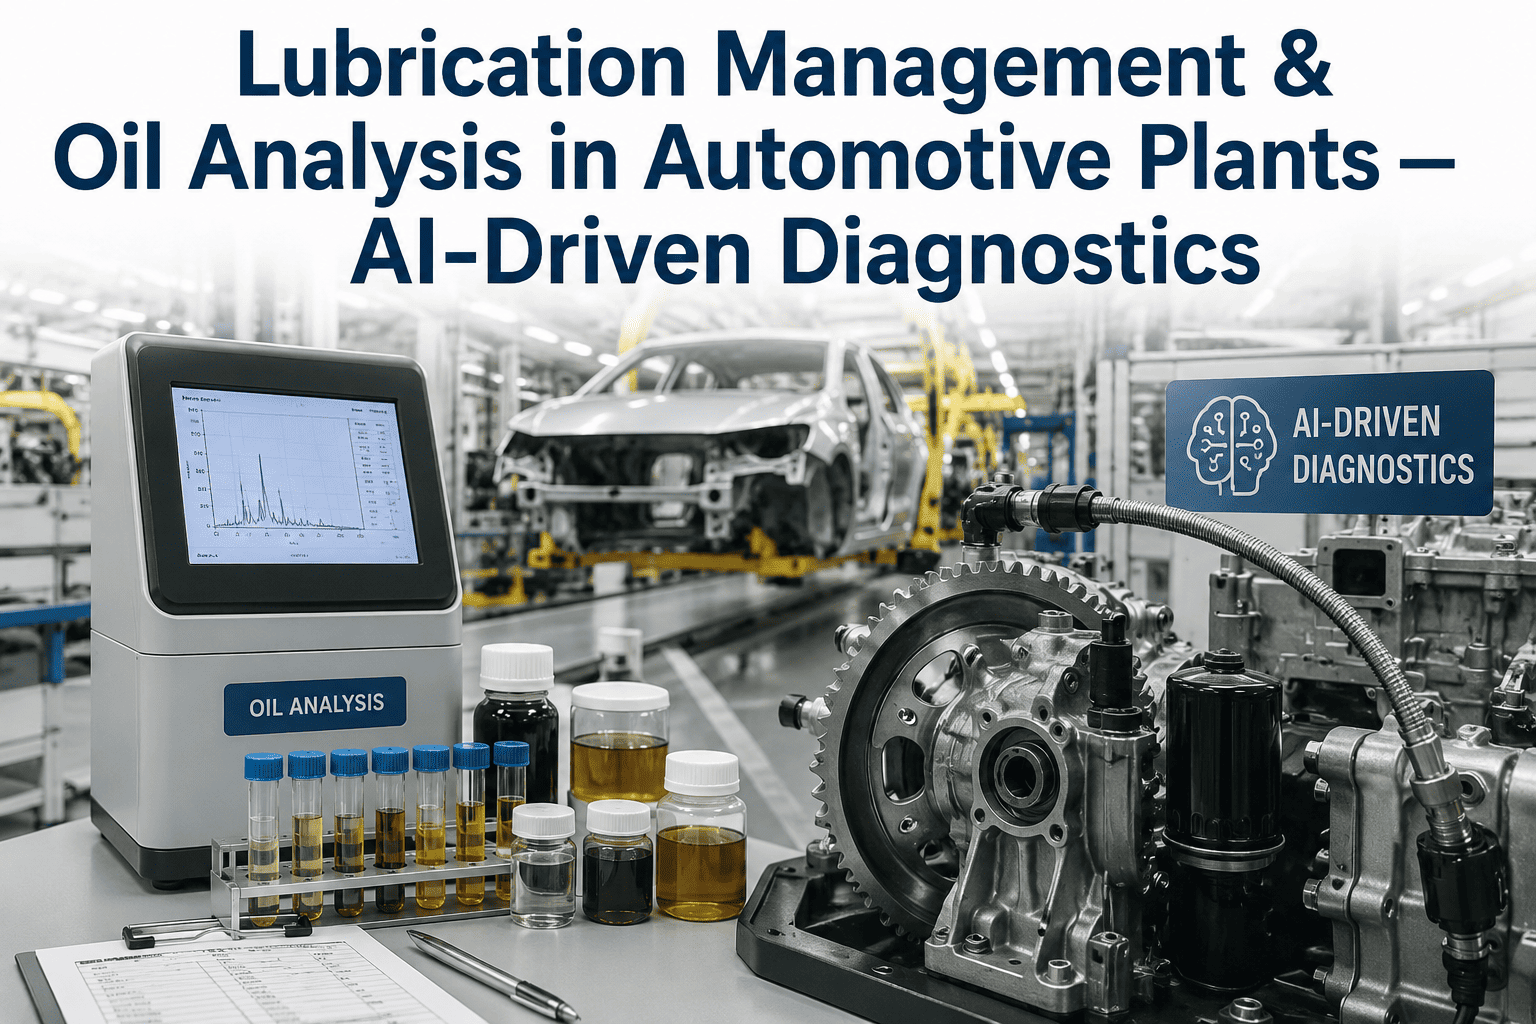
Every gearbox, hydraulic pump, and bearing housing in an automotive plant is bathed in oil that is quietly reporting on its own health, and on the health of the metal surfaces it touches, long before a vibration sensor or a sound would ever notice a problem. Reliability engineers have known this for decades, which is why lubricant sampling programs exist at all. The trouble is that most programs still run on a calendar, pulling samples every quarter regardless of how hard that gearbox actually ran, and sending them to a lab that takes days or weeks to report back a result nobody reads until something has already started to wear. iFactory's lubrication analytics platform turns that lab report into a continuously updated picture of exactly which assets need attention now.
Let your oil tell you what's wearing before it fails
iFactory combines lab and inline oil analysis data with AI diagnostics to flag bearing wear, gear degradation, and hydraulic fluid breakdown weeks ahead of a stoppage, and to stop over-servicing the assets that don't need it.
Four numbers tell most of the story
A lab report on a used oil sample can run to a dozen measurements, but four of them explain the majority of failure modes reliability teams actually chase down: how thick the oil still is, how acidic it has become, how much metal is suspended in it, and how much water has gotten in. Watched together and trended over time, these four numbers turn a vague sense that "the gearbox sounds different" into a specific, dated diagnosis.
Every failure passes through the same four stages
A fixed-interval program samples on a schedule that has no idea which stage an asset is actually in, which means healthy gearboxes get oil changed for no reason while a gearbox that slipped into Caution between visits keeps running until the next scheduled sample or a failure, whichever comes first. Continuous trending closes that gap by watching every asset's stage in near real time instead of every ninety days.
Bearing failures remain one of the costliest surprises on a plant floor
Unplanned downtime from rotating equipment failure is consistently cited as one of the largest hidden cost centers in discrete manufacturing, and a large share of those failures follow a recognizable pattern that could have been caught earlier with the right data. The frustrating part for most reliability teams isn't a lack of data, it's that the data already exists in a lab report sitting in an inbox, disconnected from the CMMS work order system that would actually act on it. Closing that gap between a lab result and a scheduled repair is often the single highest-leverage change a lubrication program can make.
Automotive plants also carry a mix of oil-lubricated and grease-lubricated assets across conveyors, robots, gearboxes, and hydraulic power units, each with different failure signatures and different criticality to the line. Treating all of them with the same fixed sampling calendar means the most critical asset on the highest-value line gets the same attention as a spare conveyor motor in a low-priority area, which is exactly backwards from how a reliability budget should be spent.
From sample to scheduled repair
Ingest lab and inline data
Route-based lab results and inline sensor readings feed into one model instead of living in separate spreadsheets and PDFs.
Classify failure signature
Wear metal ratios and additive depletion patterns are matched against a fault library to identify the likely failure mode.
Estimate remaining life
Trend velocity across samples produces an estimated window before the asset crosses into critical condition.
Push a work order
A prioritized repair or oil change task lands directly in your CMMS, scoped to the specific finding, not a generic PM.
Most reliability teams have years of lab reports sitting unread. Book a demo and we'll show what trends emerge from your own historical data.
What plants see within two quarters
What a pilot looks like
Works with your current lab
Keeps your existing oil analysis laboratory relationship; iFactory ingests their report format directly.
Covers oil and grease assets
Fault library spans both lubricated bearing types common across automotive plant equipment.
Six to eight week pilot
Includes historical report ingestion, fault-library calibration, and a documented savings report.
On-premise, no cloud dependency
Runs on an NVIDIA appliance inside your plant network, keeping asset condition data on site.
CMMS integration included
Work orders route directly into the maintenance system your team already uses daily.
24x7 managed service
iFactory's team monitors trend breaks so reliability engineers aren't manually reviewing every report.
Why lubrication is a strong first pilot for reliability teams
Lubrication analytics is one of the least disruptive AI pilots a plant can run because it doesn't touch the process at all, it only makes better use of data your team is already generating through an existing sampling program. There's no new sensor installation required on day one for most assets, and the historical lab report archive alone is usually enough to demonstrate meaningful trend detection before a single new sample is even pulled.
It's also a natural entry point for justifying broader condition monitoring investment. Once reliability leadership sees a bearing failure caught weeks in advance through oil trending, the conversation about adding vibration sensors, thermal imaging, or motor circuit analysis on the same critical assets becomes much easier, because the value of connecting condition data to actual work orders has already been proven on lubrication alone.
Oil analysis AI, explained plainly
Find the failures your lab reports already predicted
iFactory turns years of unread oil analysis data into a live, prioritized picture of asset health. Book a demo and see what your own history reveals.