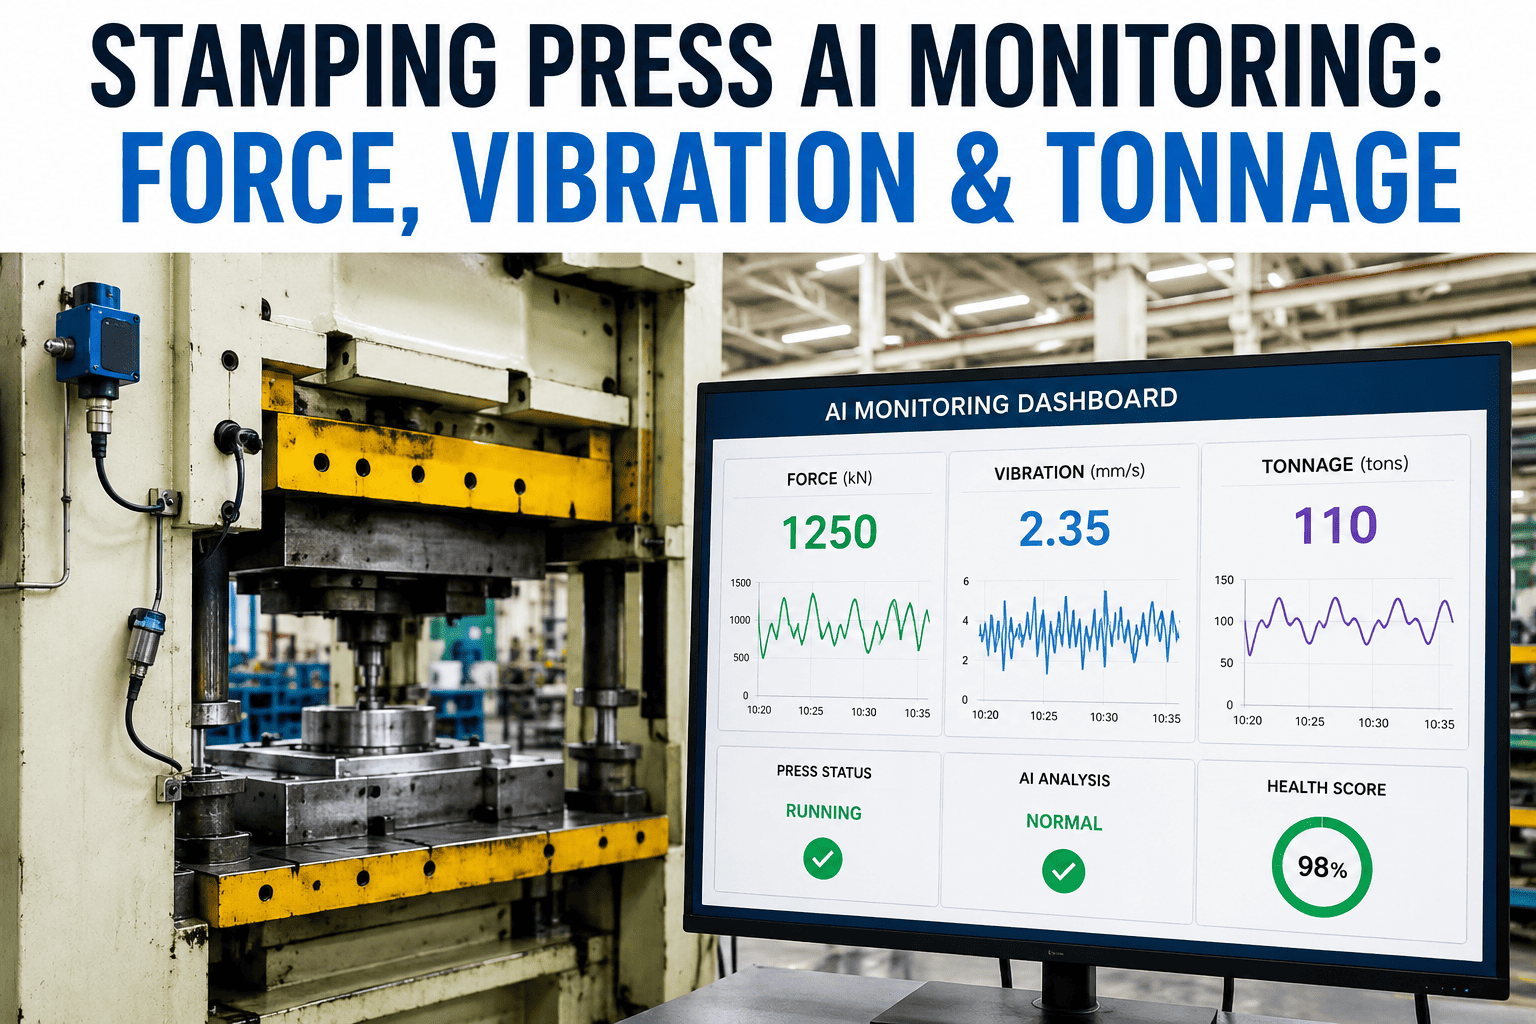
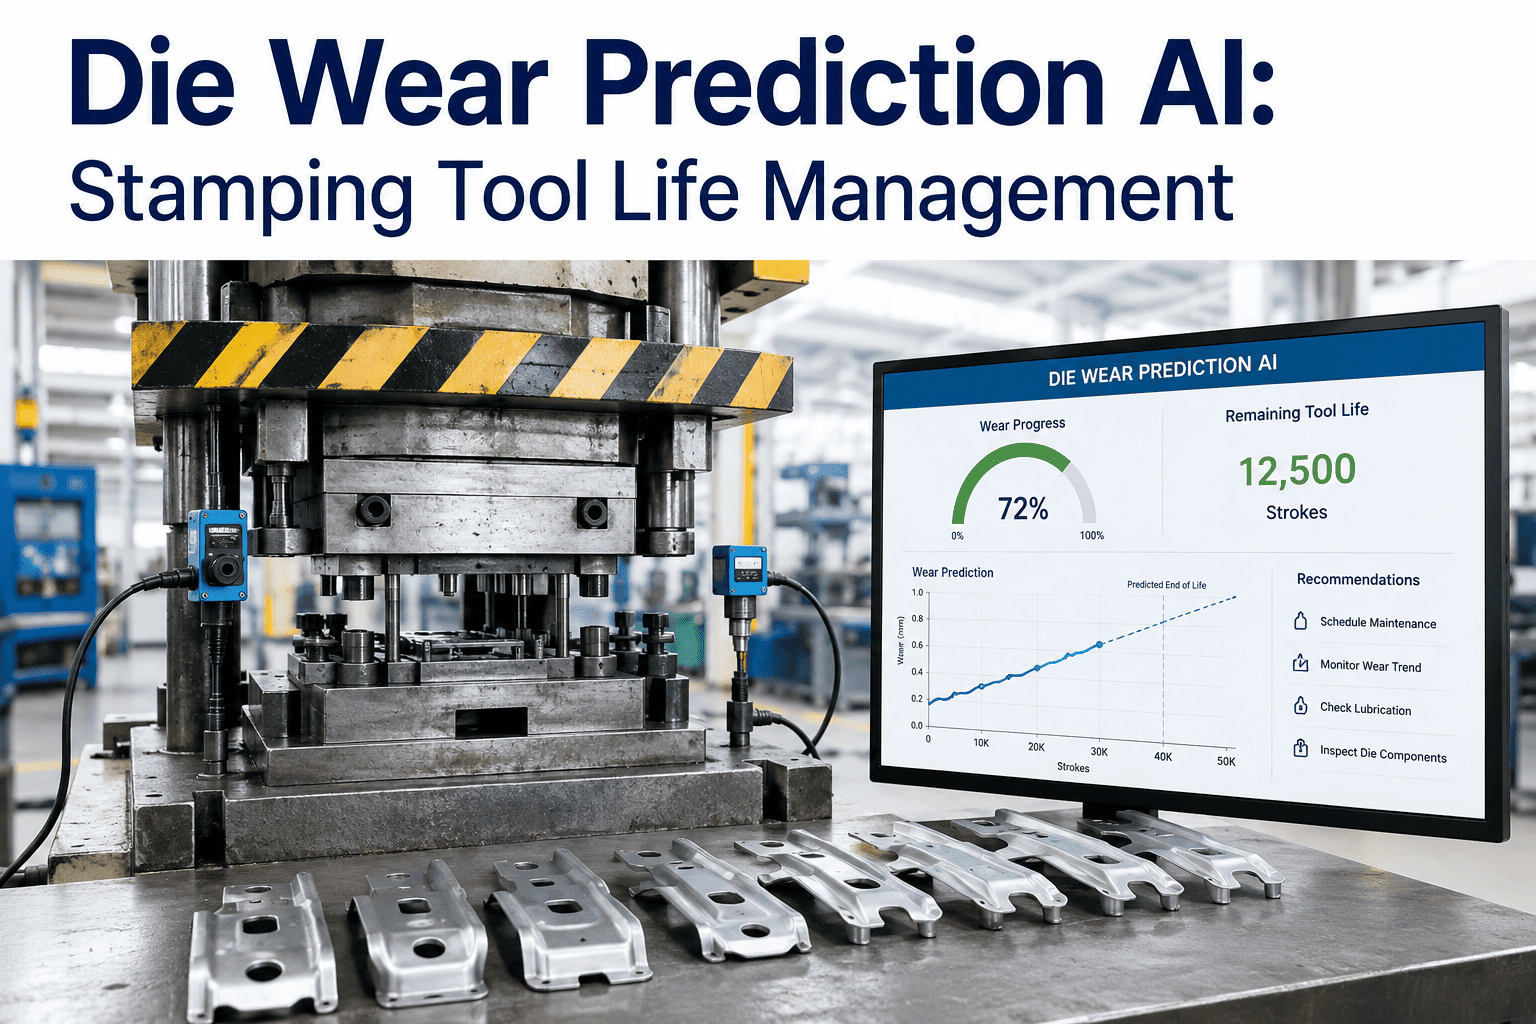
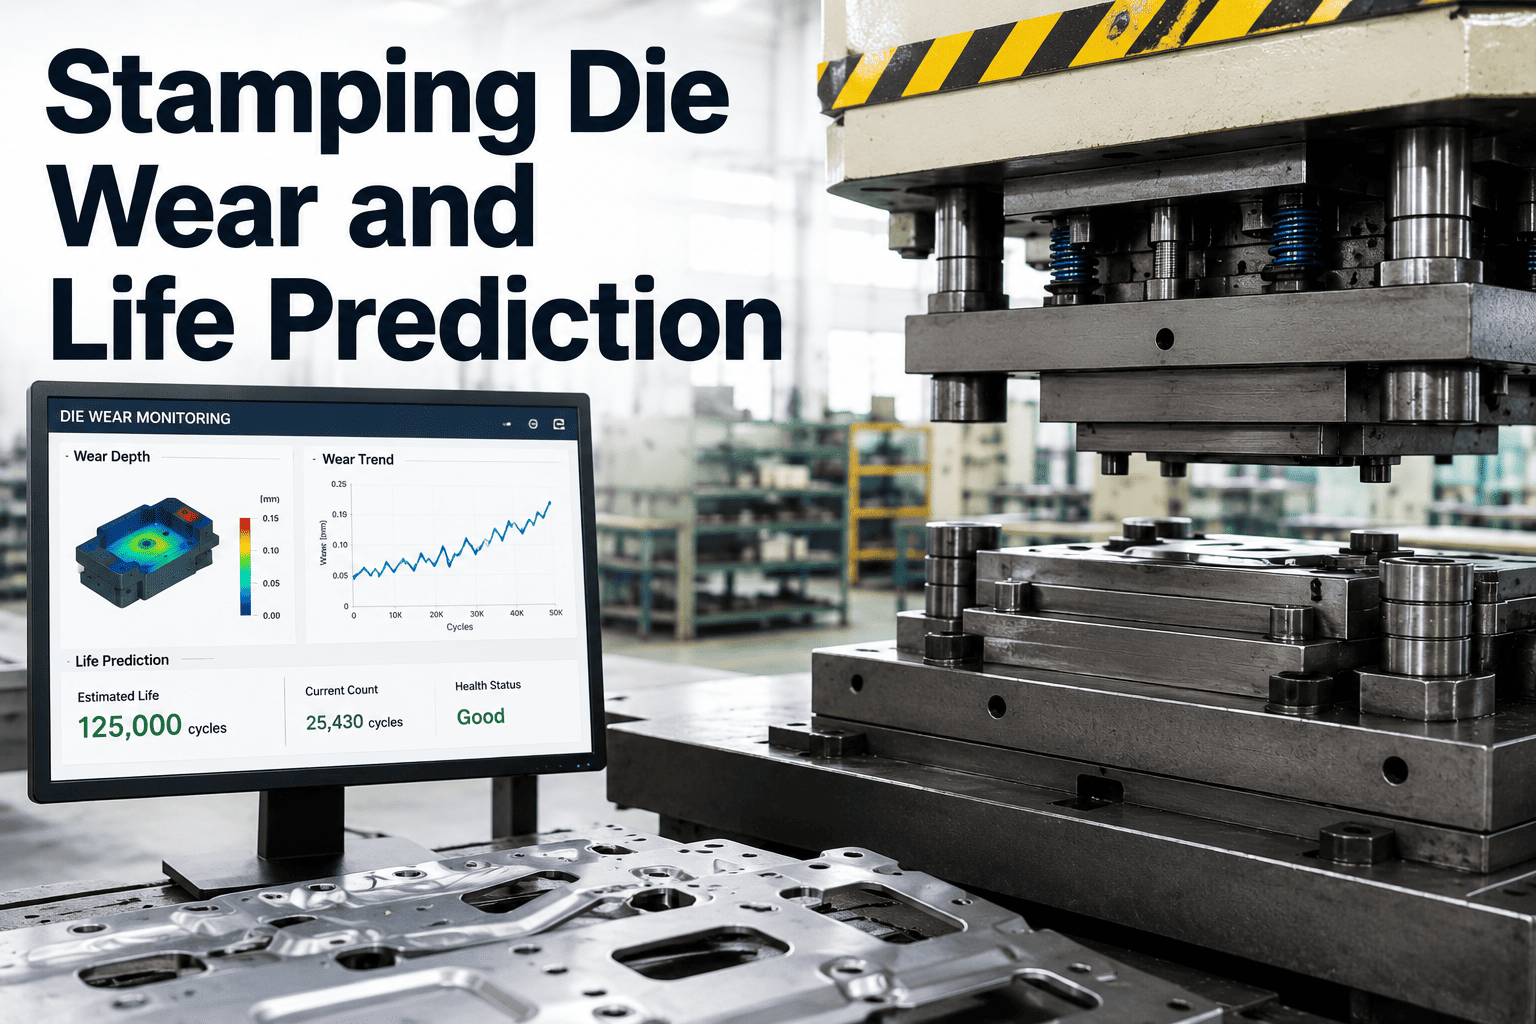
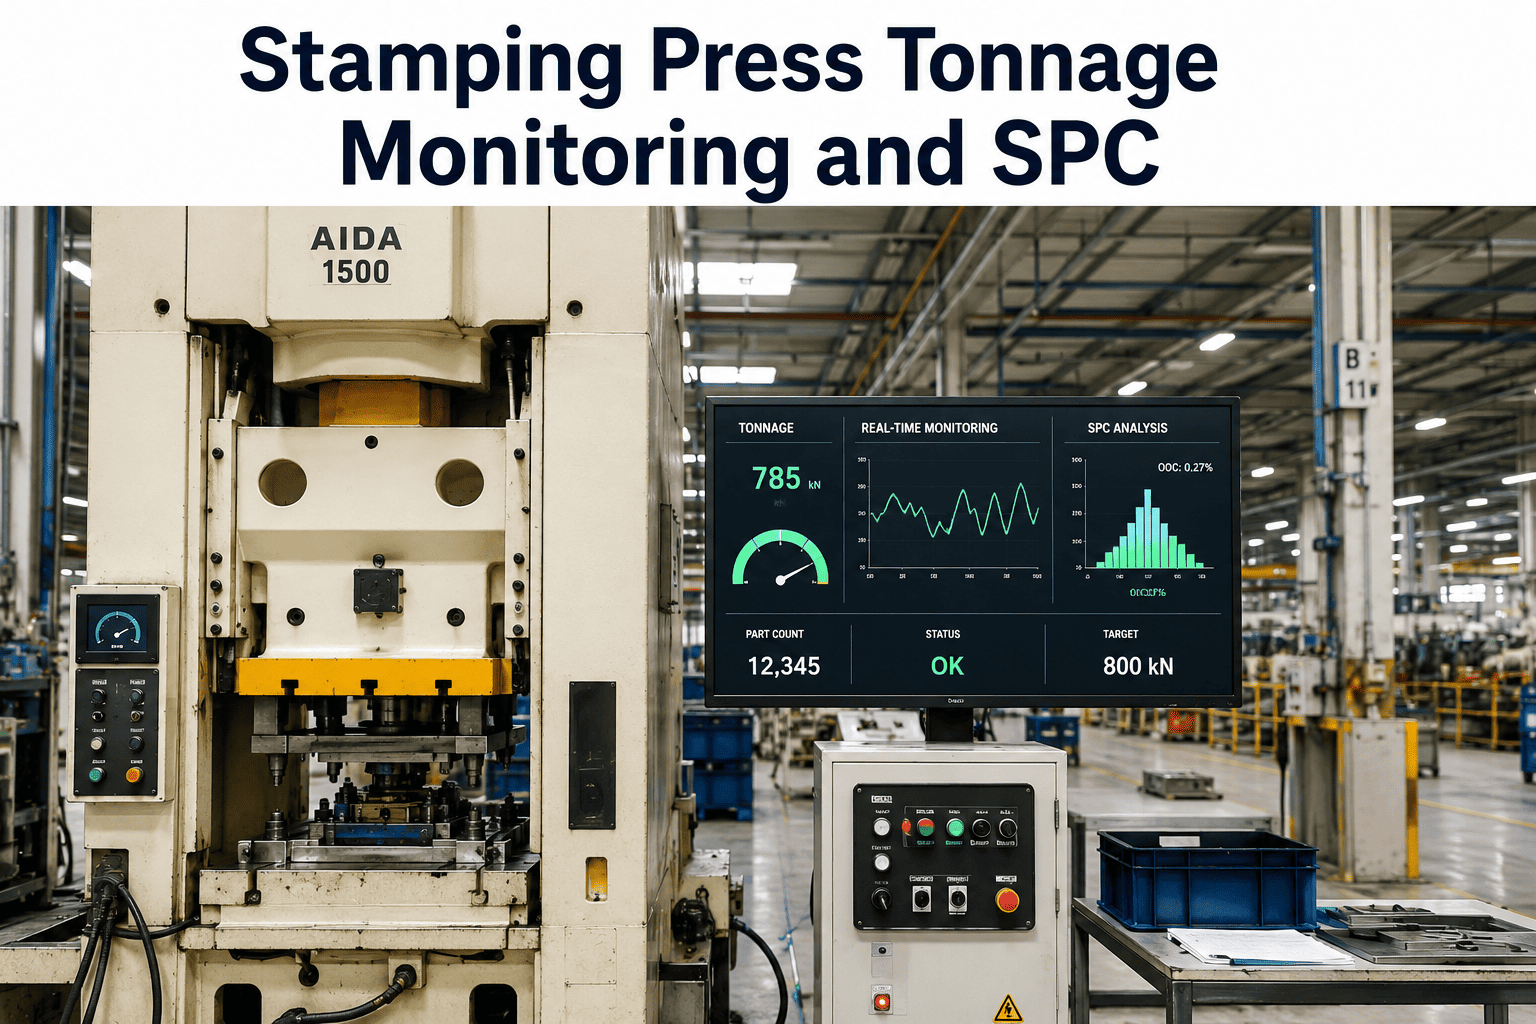
By the time a die's wear shows up as a visible split or wrinkle on a stamped panel, the tonnage curve has been quietly signaling that failure for hundreds, sometimes thousands, of strokes before anyone noticed. A worn punch edge changes the shape of the force signature long before it changes the shape of the part, and that signature is sitting in your press's own data stream right now, unread. Traditional SPC catches a problem after bad parts already exist; tonnage curve analysis catches the drift while parts are still passing inspection. Manufacturers reading that signal in real time are cutting scrap in ways that calendar-based die maintenance never could — if your press line is still running dies to a fixed inspection schedule instead of an actual wear signal, book a session with an iFactory stamping engineer to see the difference.
iFactory Stamping Intelligence
Stamping Die Wear Prediction: AI Tonnage Monitoring & Springback Compensation
Every stroke of a stamping press leaves a force signature that reveals exactly how the die is wearing, long before a part fails inspection. This guide covers what that tonnage curve actually shows, how AI models turn it into a wear prediction, and how springback compensation keeps dimensional accuracy stable as tooling ages.
47.8%
Scrap reduction achieved by AI tonnage models versus SPC alone in trials
50-100
Strokes a springback-driving deviation can run before it is visible in CMM checks
5-10
Cycles ahead that AI models can forecast a quality deviation
68%
Of stoppages preventable with advance warning from tonnage signals
Why Tonnage Data Predicts What Inspection Only Confirms
Statistical process control on a stamping line has always relied on periodic dimensional checks — a part pulled every so many strokes, measured, and plotted against a control limit. This works, but it is fundamentally reactive: by the time a measurement falls outside its control limit, non-conforming parts have already been produced. The die wear that caused the deviation started long before that control chart flagged it.
The press's own tonnage curve tells a different, earlier story. Peak load, reverse tonnage, and corner-load distribution shift in identifiable patterns as a punch edge dulls or a clearance widens, and those shifts are visible in the force signature dozens or hundreds of strokes before the resulting part dimension drifts far enough to fail a CMM check. Reading that signal converts stamping quality from a detection problem into a prediction problem.
The Business Case for Tonnage-Based Wear Prediction
- Peak load, reverse tonnage, and corner-load signatures reveal die wear progression before dimensional drift is measurable
- AI models forecasting five to ten cycles ahead give operators time to intervene before a bad part is even produced
- Springback compensation adjusts automatically as die condition changes, holding dimensional accuracy stable over the tool's life
Request a Tonnage Signal Audit →
Reading the Tonnage Curve: What Each Phase of the Stroke Reveals
A single stamping stroke produces a force curve with distinct phases, and die wear reveals itself differently in each one. Understanding the shape of a healthy curve is the baseline every wear prediction model is trained against.
Peak load is where punch edge wear shows up first — a dulling edge requires progressively more force to shear the same material. Reverse tonnage at release reveals spring-back resistance changes as clearance widens. Corner-load asymmetry across the four corners of the tool signals uneven wear or misalignment well before it appears as a visible defect on the part.
Calendar-Based Inspection vs. Tonnage-Predictive Maintenance
| Decision Area |
Calendar-Based Die Inspection |
Tonnage-Predictive Monitoring |
| Detection Timing |
Wear discovered at scheduled inspection or when a part fails a CMM check. |
Wear progression visible in force signature days before dimensional impact. |
| Scrap Exposure |
Bad parts accumulate between control chart violations and root cause resolution. |
Forecasted deviations flagged five to ten cycles ahead, before defective parts are made. |
| Die Servicing |
Fixed intervals regardless of actual wear state — some dies serviced too early, others too late. |
Servicing scheduled against actual measured wear condition, not a generic calendar. |
| Springback Accuracy |
Compensation values set once and left unchanged as the die ages. |
Compensation adjusted continuously as wear signatures shift the springback relationship. |
| Root Cause Traceability |
Difficult to reconstruct which stroke or wear event caused a specific defect batch. |
Every stroke logged against tonnage signature, enabling precise root-cause analysis. |
See live tonnage curve dashboards with wear prediction for your press line
Book a Demo
The Four Stages of Die Wear Progression
Early Wear
92% model confidence
Subtle peak load increase within normal variation range. No part impact yet, but the earliest trend signal a model can detect.
Moderate Wear
85% model confidence
Corner-load asymmetry becomes measurable. Springback compensation begins to require adjustment to hold dimensional targets.
Advanced Wear
78% model confidence
Reverse tonnage signature shifts noticeably. Part dimensions trend toward specification limits at a measurable rate per stroke.
Critical Wear
96% model confidence
Force signature deviates sharply from baseline. Immediate die servicing required to prevent scrap or catastrophic tool failure.
Deployment Timeline: From Sensor Install to Predictive Wear Scheduling
Week 1-2
Tonnage, vibration, and stroke count sensors installed on target presses
Force sensors integrated with existing press controls via OPC-UA or direct PLC communication, no production disruption.
Week 3-4
Live tonnage curve dashboards active per press and per die
Baseline force signatures documented for each active die, establishing the healthy reference curve.
Week 5-8
AI wear models validated against known die service history
Prediction accuracy confirmed against historical wear events before alerts are trusted for scheduling decisions.
Month 3-6
Predictive die servicing and automated springback compensation live
Maintenance scheduling shifts from calendar to condition, and compensation values adjust continuously with measured wear.
Frequently Asked Questions
Do we need new tonnage monitors, or can this use our existing press instrumentation?
Most modern presses already have some form of tonnage monitoring installed, and the platform typically reads this existing data via OPC-UA, Ethernet/IP, or direct PLC communication rather than requiring new load cells. Where sensors are missing or outdated, retrofitting is straightforward and does not require replacing the press control system. A specific assessment of your current instrumentation is available through
iFactory support.
How far in advance can the model actually predict a die failure?
Prediction lead time depends on the failure mode and how much historical wear data the model has learned from, but typical results range from five to ten cycles ahead for quality deviations and up to several days ahead for progressive wear leading to catastrophic failure. Accuracy improves over the first few months as the model observes more wear events specific to your dies and materials.
Can this work alongside our existing vision-based defect inspection system?
Yes. Tonnage-based wear prediction and vision-based defect detection are complementary rather than redundant — tonnage data reveals the mechanical cause inside the die, while vision confirms the resulting part condition. Fusing both data streams against a common stroke record enables faster root-cause analysis than either system running independently.
Will this change how often we need to physically inspect dies?
Physical inspection remains part of a sound maintenance programme, but the schedule shifts from a fixed calendar interval to one informed by measured wear condition. Some dies may run longer between physical inspections when tonnage data confirms stable wear, while others may be flagged for earlier inspection when signature drift appears, reducing both premature teardowns and unexpected failures.
What scrap reduction is realistic from adopting tonnage-based prediction?
Results vary by baseline process maturity, but integrated tonnage and quality forecasting systems have demonstrated scrap reductions approaching fifty percent compared to traditional SPC alone in documented trials. A savings estimate specific to your current scrap rate and die inventory can be modeled when you
book a working session with our stamping engineers.
Stop Reacting to Scrap. Start Predicting It.
Your Press's Tonnage Curve Already Knows the Die Is Wearing. Are You Reading It?
iFactory's tonnage monitoring and AI wear prediction platform reads every stroke's force signature to forecast quality deviations before bad parts are made, and adjusts springback compensation automatically as dies age. Sensors live in two weeks. Validated predictions within eight.
68%
Stoppages preventable