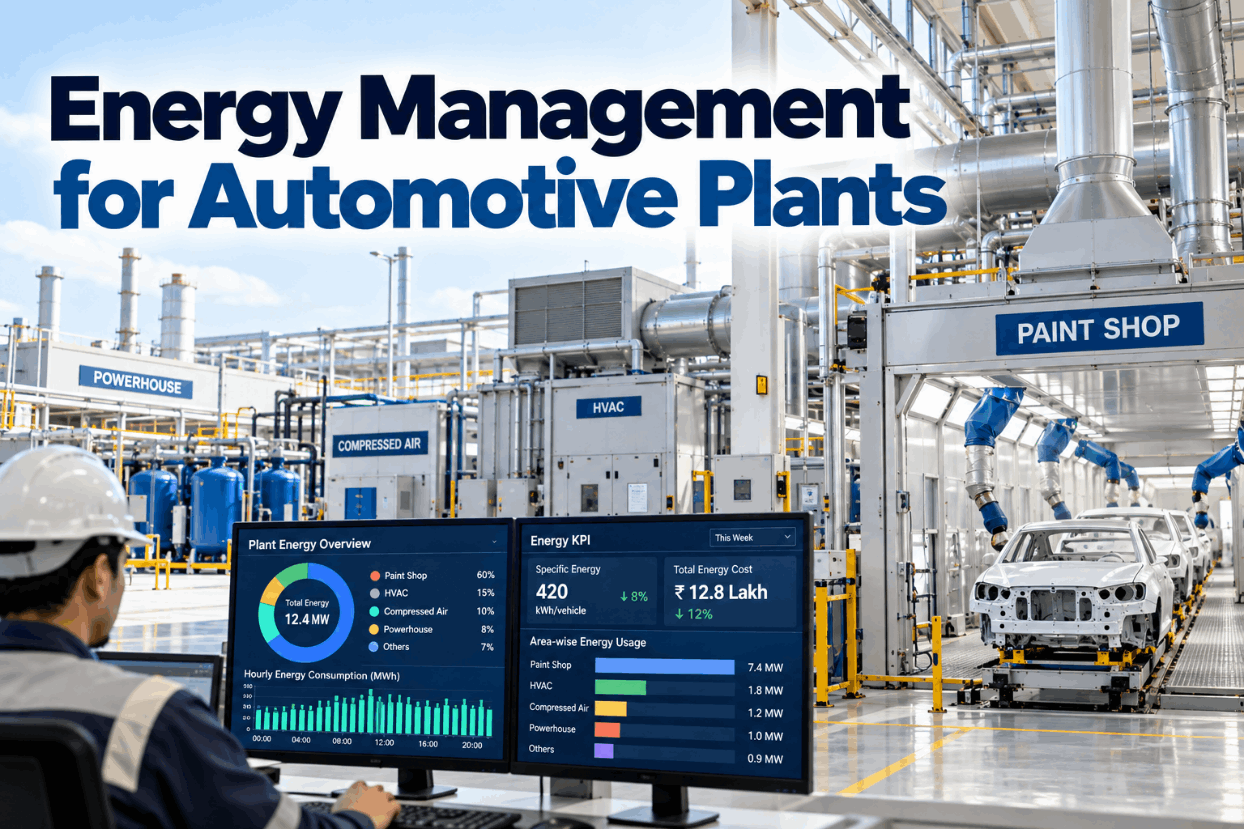
Automotive plants use energy in a few very large places and many small ones. The paint shop dominates, with ovens, booth air supply and pretreatment baths. HVAC keeps large halls within working conditions. Compressed air drives tools and robots. A powerhouse supplies steam, hot water and chilled water. Energy management that works in an auto plant focuses on those big users, measures them against production, and cuts the energy spent when nothing is being built. This guide explains where the energy goes, how ISO 50001 applies, which indicators to track, how to normalize for volume and weather, and how to capture the large savings in non-production hours. To see an automotive EnMS, book a short walkthrough.
Energy Management for Automotive Plants: Paint, HVAC, Compressed Air and Powerhouse Under Control
Energy measured by shop and system, normalized for volume and weather and owned by named people, with non-production energy cut hard and paint shop use tracked per vehicle.
Why Auto Plant Energy Is Hard to Manage
An automotive plant’s energy bill is large, but most of it comes from a few systems that are hard to see from the plant floor. The paint shop runs ovens and huge air handling units. HVAC runs whether the line is busy or not. Compressors run through weekends to feed leaks. Without metering by system and indicators tied to production, energy stays a monthly cost rather than a managed performance.
The paint shop is the centre of gravity. Automotive Manufacturing Solutions reports that paint shops account for 45–70% of the energy required for car production, and Stellantis reports its paint shops use around 60% of plant natural gas and 50% of electricity. That concentration is an opportunity: focusing on a few systems can move the whole plant.
Weekends and breaks are the other hidden opportunity. Large systems left running when nothing is being built consume energy for no output at all.
Energy management turns those facts into daily actions. We can review your plant’s energy profile on a call.
The Big Energy Users in an Auto Plant
Each major area has its own drivers and levers.
Curing ovens, booth air supply and exhaust, pretreatment and electrocoat baths.
Heating, cooling and ventilation, driven by weather and occupancy.
Tools, robots, clamps and blow-off, with leaks often a large share.
Boilers, chillers and pumps converting fuel and power into heat and cooling.
Resistance welding, robots and conveyors, with idle loads between jobs.
Conveyors, test stands and lighting across large areas.
The paint shop deserves the closest attention because its loads are both large and steady. Automotive Manufacturing Solutions puts a paint shop’s electrical load at roughly 8–10 MW, with booth supply and exhaust fans alone drawing up to about 4 MW. Ovens, pretreatment baths and booth air conditioning add large gas demand on top. Those loads run for long hours, so every percentage point saved there is worth many points elsewhere.
Metering at this level is the first step. Many plants have a main meter and a few sub-meters; adding meters on the largest systems usually pays back quickly in visibility alone. We identify metering gaps in a site review.
Applying ISO 50001 in an Automotive Plant
ISO 50001 provides the management framework. In an auto plant, its elements translate into practical steps.
Many automotive OEMs and suppliers already hold ISO 50001 certification or require it of suppliers. The certificate matters less than the routine: daily indicators, owners and action on deviations.
The energy review is where automotive plants gain most insight. Ranking uses by size and controllability usually shows a short list of significant energy uses: paint ovens and booth air, compressed air, HVAC in large halls and the powerhouse. Each gets an owner, an indicator and operating controls, while smaller uses are handled by general good practice.
ISO 50001 fits well alongside IATF 16949 management routines that plants already run. Our specialists can map the two.
Energy Indicators That Mean Something
Raw energy consumption rises and falls with production volume and weather. Useful indicators remove those effects.
| Indicator | Normalize for | Owner |
|---|---|---|
| Paint shop kWh per vehicle | Volume, colour mix, ambient conditions | Paint shop manager |
| HVAC energy per degree day | Heating and cooling degree days, occupancy | Facilities manager |
| Compressed air kWh per vehicle | Volume, shifts worked | Utilities engineer |
| Non-production energy share | Hours with no production | Energy manager |
| Powerhouse conversion efficiency | Load and ambient conditions | Powerhouse lead |
| Plant kWh per vehicle | Volume, mix, weather | Plant manager |
Illustrative. The baseline model removes volume and weather effects so the deviation reflects performance.
Colour mix and body size matter in the paint shop indicator. Some colours need extra coats or more repair, and larger bodies carry more surface area through booths and ovens. Including these factors in the baseline stops a plant from blaming the paint team for a month dominated by complex colours or large SUVs.
Without normalization, a low-volume month looks like poor performance and a mild month hides real losses. Baseline models are built from your own history during set-up.
Cutting Energy When Nothing Is Being Built
Auto plants spend many hours a week not producing: breaks, shift changes, nights on two-shift plants and weekends. Large systems often keep running through them.
- Paint booth air supply at full flow
- Ovens held at temperature
- Compressors feeding leaks
- Robots and conveyors powered and idle
- Lighting and HVAC unchanged
- Idle load can be around 60% of normal
- Booth air reduced to standby flow
- Ovens set back within restart limits
- Compressors staged down or off by zone
- Robots and conveyors in energy-saving states
- Lighting and HVAC scheduled to occupancy
- Idle load around 20% of normal is achievable
Automotive Manufacturing Solutions describes controlled standby, using standard automation functions, reducing idle consumption from around 60% of normal operation to around 20% during breaks and weekends. The key constraint is restart: systems must return to production conditions in time for the next shift, especially paint booths and ovens, where temperature and humidity affect quality.
A simple weekend load measurement is often the most revealing first step. The difference between Sunday load and weekday load shows exactly how much is spent keeping an empty plant running.
Shutdown and restart sequences should be tested and timed, then built into operating controls. See a sequence in a demo.
Automotive EnMS Checklist
Use this checklist to set up energy management across an auto plant.
Start with the measurement items, because every later step depends on them. A plant that cannot see paint shop energy separately from the rest cannot tell whether a standby project worked. Sub-metering the four big systems, paired with production counts from MES, is usually enough to begin, and more detail can follow where the data shows the largest opportunities.
Plants that start with non-production energy usually find the quickest savings. Our team can run a weekend load assessment.
What Automotive Energy Management Delivers
The value comes from focusing effort where the energy is.
Stellantis offers a public example of focus paying off: it reported a 27% reduction in paint shop energy compared with 2021 and a target average of 321 kWh per vehicle, with its Gliwice plant at 245 kWh per vehicle. Every plant starts from its own baseline, but the direction is clear.
A short assessment of your metering and non-production load usually shows the first opportunities. Book one with our advisors.
How iFactory Delivers Automotive Energy Management
Paint, HVAC, air and powerhouse energy tracked.
kWh per vehicle adjusted for volume and weather.
Deviations routed to shop owners with context.
Non-production energy tracked and reduced safely.
Savings verified against baselines.
ISO 50001 reviews and carbon reporting from one source.
It works with your meters, BMS, PLCs and MES. Share a month of energy and production data and we will show your non-production load in a session.
See What Your Plant Uses When Nothing Is Being Built
Share energy and production data for a month. We map energy by shop, measure non-production load and show the first savings in paint, air and HVAC.
Weekend load is 41% of weekday load. Paint booth air supply and compressors run at near-normal output with no production.
A Weekend Load Problem Found
This exchange shows how a plant energy manager might use iFactory.
iFactory ships as a pre-configured NVIDIA AI server, racked and ready with the energy management and analytics models loaded. Rack it, plug in power and Ethernet, and the AI is live on your network. Our scope covers sensors and data connections across paint, HVAC, compressed air and powerhouse systems, PLC/SCADA, MES, CMMS and ERP integration, cabling and network setup, operator and quality team training, and 24×7 remote monitoring.
Server installed, PLC, MES and ERP links live, historical production, quality and maintenance data loaded.
Models calibrated on your own lines, then run in advisory mode on one line or area with your planners and engineers reviewing every output.
Rollout to the agreed lines under your change management, planner, supervisor and engineer training, and 24×7 remote monitoring in place.
Software, server and integration come as one package. For pricing on your plant, contact our sales team.
Frequently Asked Questions
The paint shop, with ovens, booth air supply and pretreatment. Automotive Manufacturing Solutions reports it accounts for 45–70% of the energy needed for car production.
It provides a framework for energy review, significant energy uses, indicators, baselines, operational controls and management review, which in auto plants focuses on paint, HVAC, compressed air and utilities.
kWh per vehicle by shop, HVAC energy per degree day, compressed air energy per vehicle, non-production energy share and plant energy per vehicle, all normalized for volume and weather.
With controlled standby and shutdown sequences for booths, ovens, compressors, robots and HVAC during breaks and weekends, tested so restart meets production and quality needs.
Stellantis reported a target average of 321 kWh per vehicle for its paint shops by 2025, with its Gliwice plant at 245 kWh per vehicle.
A first shop can typically be metered and tracked within a 6–12 week rollout. Plan it with our engineers.
Manage Energy Where It Is Actually Used
iFactory tracks paint, HVAC, compressed air and powerhouse energy against production, cuts non-production load and keeps every shop accountable for its kWh per vehicle.
Illustrative plant. Paint typically dominates; published ranges run from about 45% to 70%.