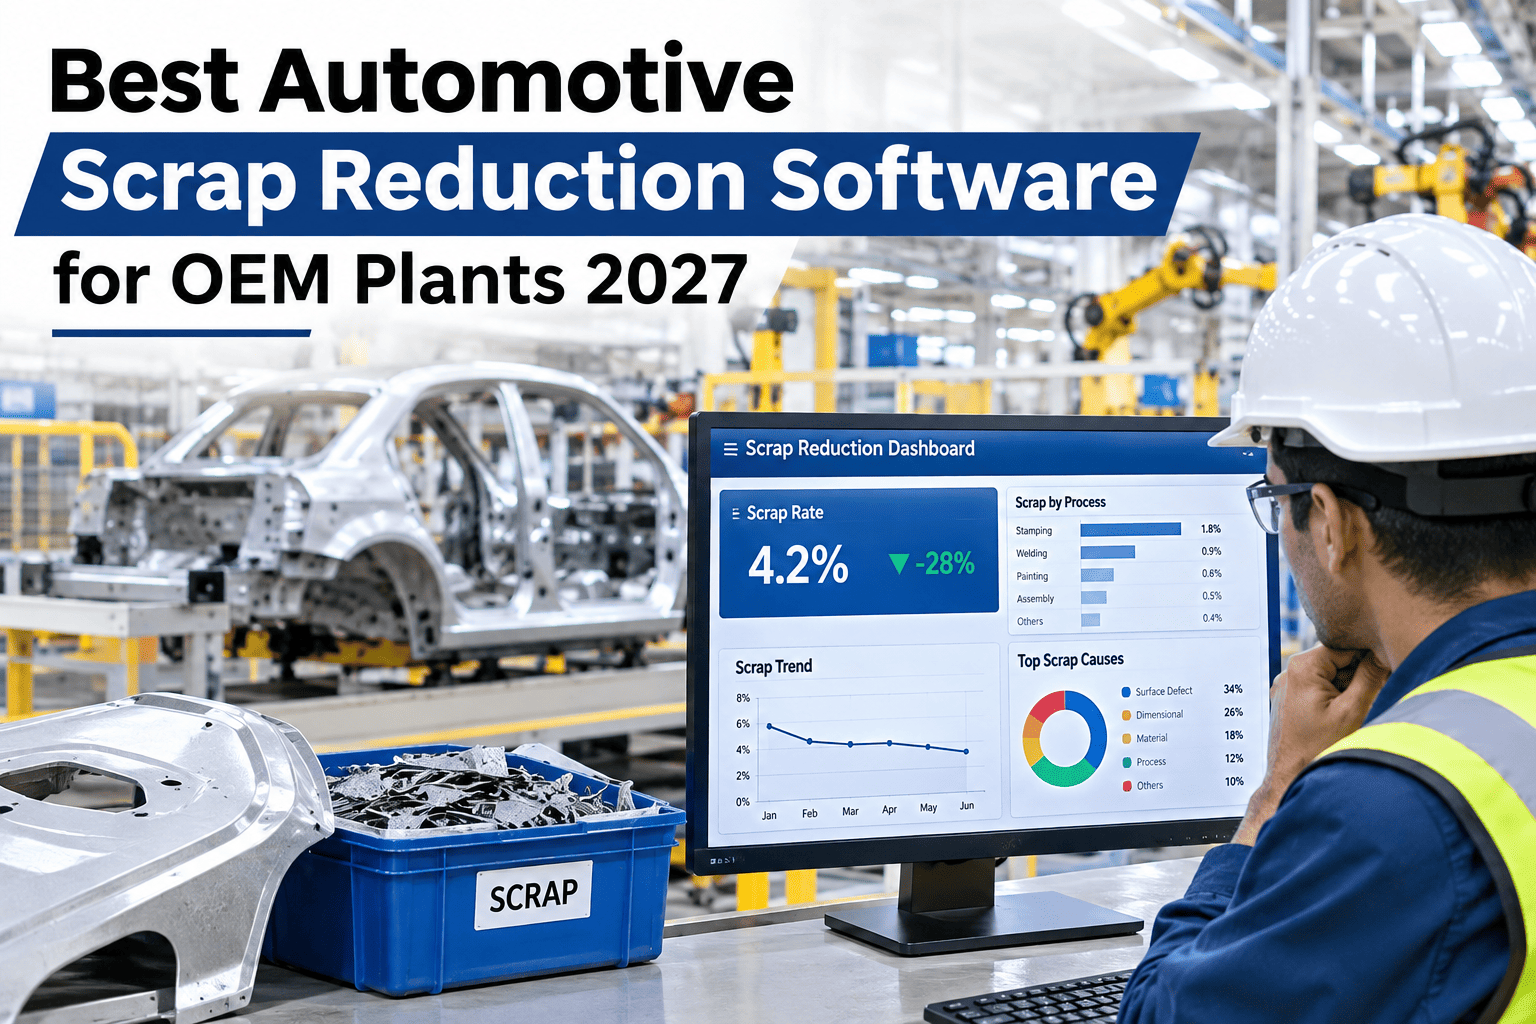
Automotive scrap rarely comes from one bad machine — it comes from a dozen small misses nobody connects: a press that drifts for an hour before anyone notices, a stamping die that scraps the same panel edge every Tuesday, a weld cell that quietly trends toward rework for a whole shift. Software built for scrap reduction earns its keep by tying cause, cost and repeat pattern together on one screen instead of three separate reports. For OEM and Tier 1 plants comparing options for 2027, the real test is whether a platform can take your own scrap log and show which defect is actually costing the most, not just which one happens most often — something iFactory AI's teams walk through directly on a live scrap data review before any commitment.
Scrap Reduction Software OEM Plants Actually Trust in 2027
A clear look at what separates a basic scrap-tracking spreadsheet from a scrap-cause platform that classifies, costs and targets repeat defects automatically.
What Does "Scrap Reduction Software" Actually Need to Do?
At minimum, scrap reduction software has to classify each scrap event by cause, attach a real cost to it, and flag when the same defect keeps recurring. Most spreadsheets and basic MES scrap modules only do the first part — they log a reason code, not a cost-weighted ranking, so the loudest category wins attention instead of the costliest one.
How Scrap Classification Actually Works on the Line
A classification engine only works if operators can tag a scrap event in seconds, at the station, without hunting through a long dropdown. The structure below is what iFactory AI, an on-premise AI platform for manufacturing operations, uses to keep tagging fast and the resulting data clean enough to act on.
Feature Comparison: What to Check Before You Commit
Vendor demos tend to look similar on the surface. The table below lists the checks that separate a platform built for scrap cost reduction from one that simply displays a Pareto chart of event counts.
| Capability | Basic scrap log | Scrap-cost platform |
|---|---|---|
| Cause classification | Free text or long dropdown | Short, station-specific tagging |
| Cost weighting | Not included | Automatic, tied to standard cost |
| Repeat-defect alerts | Manual review only | Threshold-based automatic flag |
| Shift comparability | Varies by who logged it | Same taxonomy across every shift |
| Engineering handoff | Exported report | Linked directly to the flagged station and cause |
Rank Your Own Scrap Categories by Cost, Not Count
Bring a month of scrap data to a short session and see which defect is actually costing your plant the most this quarter.
Where Automotive Plants Lose the Most Without Realizing It
Stamping and weld operations are consistently the two areas where cost-ranked scrap data changes the conversation most, because the highest-count defect is rarely the highest-cost one once rework labor and downstream inspection time are added back in.
A Composite Example: The Defect That Was Hiding in Plain Sight
A stamping line's weekly scrap report consistently showed a minor trim-edge nick as the top category by event count, so engineering spent months adjusting trim dies with little change in total cost. Once scrap events were cost-weighted instead of counted, a lower-frequency die-wear defect on a different panel turned out to be responsible for close to half the dollar value, because each occurrence triggered a full rework cycle rather than a quick fix.
Redirecting the die maintenance schedule toward that panel, rather than the loudest complaint, is the kind of reallocation a cost-ranked view makes possible — the same approach iFactory AI's support team can walk through against your own part numbers.
Rollout Checklist Before You Sign
Building the Case Internally Before You Buy
Most scrap-software purchases stall not because the technology is in doubt, but because nobody built a clean before-and-after case finance and operations can both sign off on. Pulling three months of existing scrap data into a cost-weighted view, even manually, is usually enough to show whether the investment is justified before a vendor contract is on the table.
That internal case gets stronger when it separates one-time cleanup savings — fixing a die that has been quietly scrapping parts for a year — from the ongoing savings a repeat-defect alert keeps delivering every month after. Finance tends to trust the second number more, because it does not depend on finding another one-off problem next quarter.
How This Fits Alongside Existing Quality Systems
A cost-weighted scrap view is not meant to replace SPC charts, PPAP records or your existing MES scrap log — it sits on top of them, pulling the same underlying event data into a different lens. Plants that try to run cost-ranking as a separate standalone system usually find it falls out of sync with the official scrap record within a few weeks.
The more durable approach connects the cost-ranking layer directly to the system that already captures the event, so engineering and finance are always looking at the same underlying numbers, just organized by cost instead of count.
Frequently Asked Questions
Find Out Which Defect Is Actually Costing You the Most
iFactory AI classifies, costs and ranks your scrap data automatically, so engineering time goes to the highest-cost pattern first. Book a walkthrough using your own plant data.