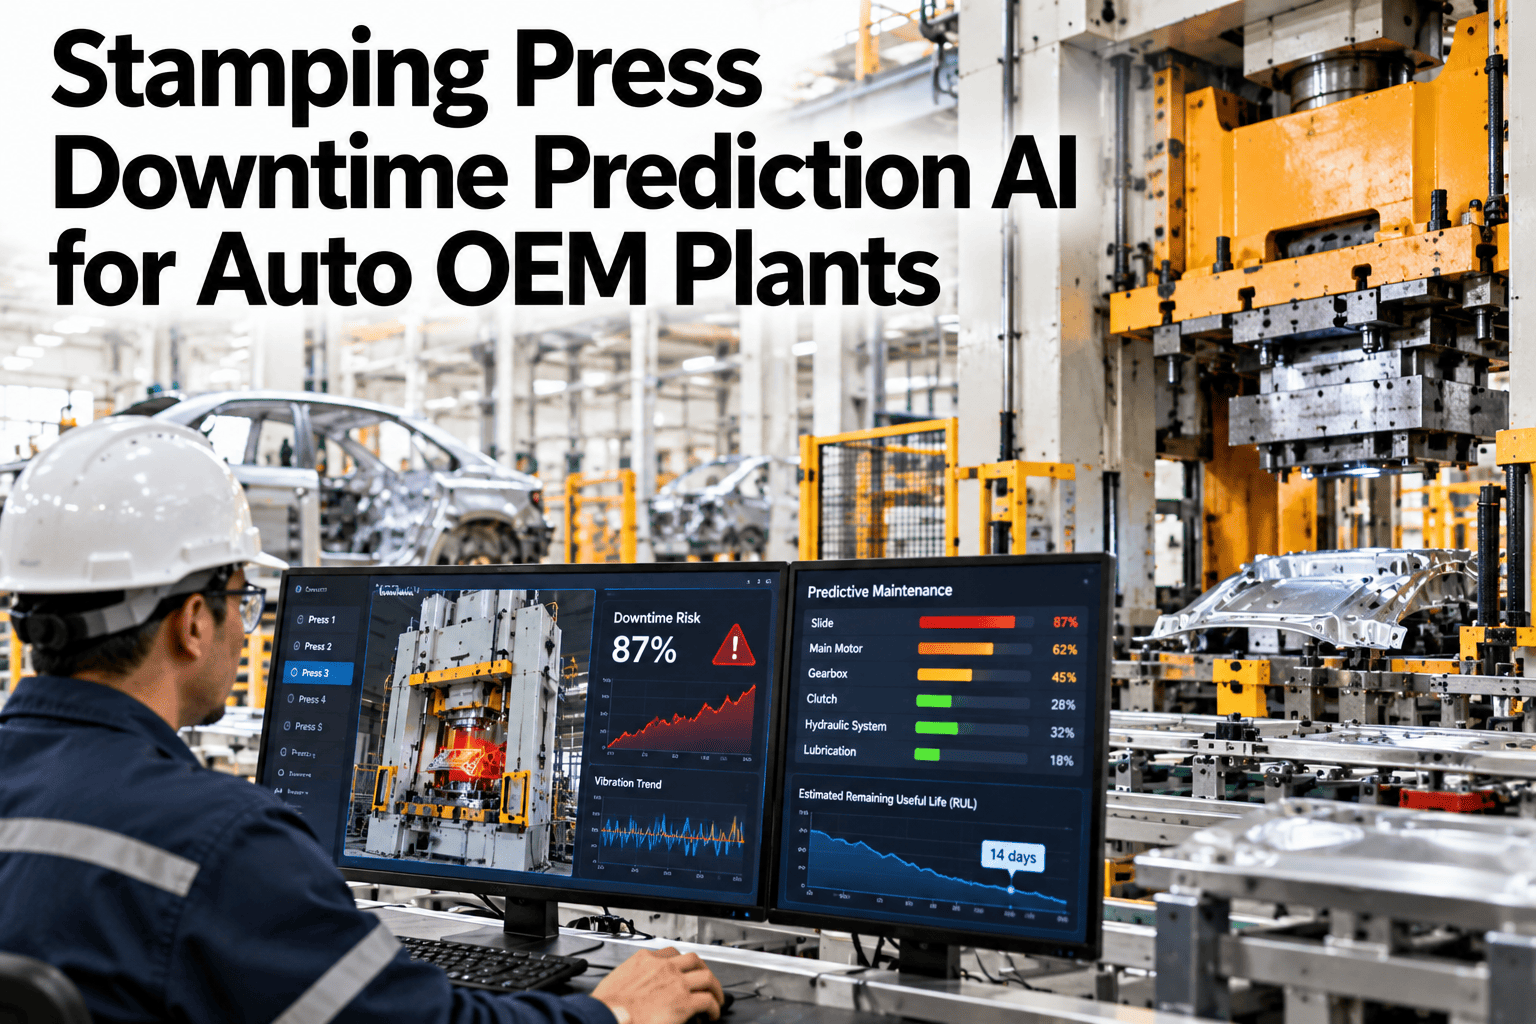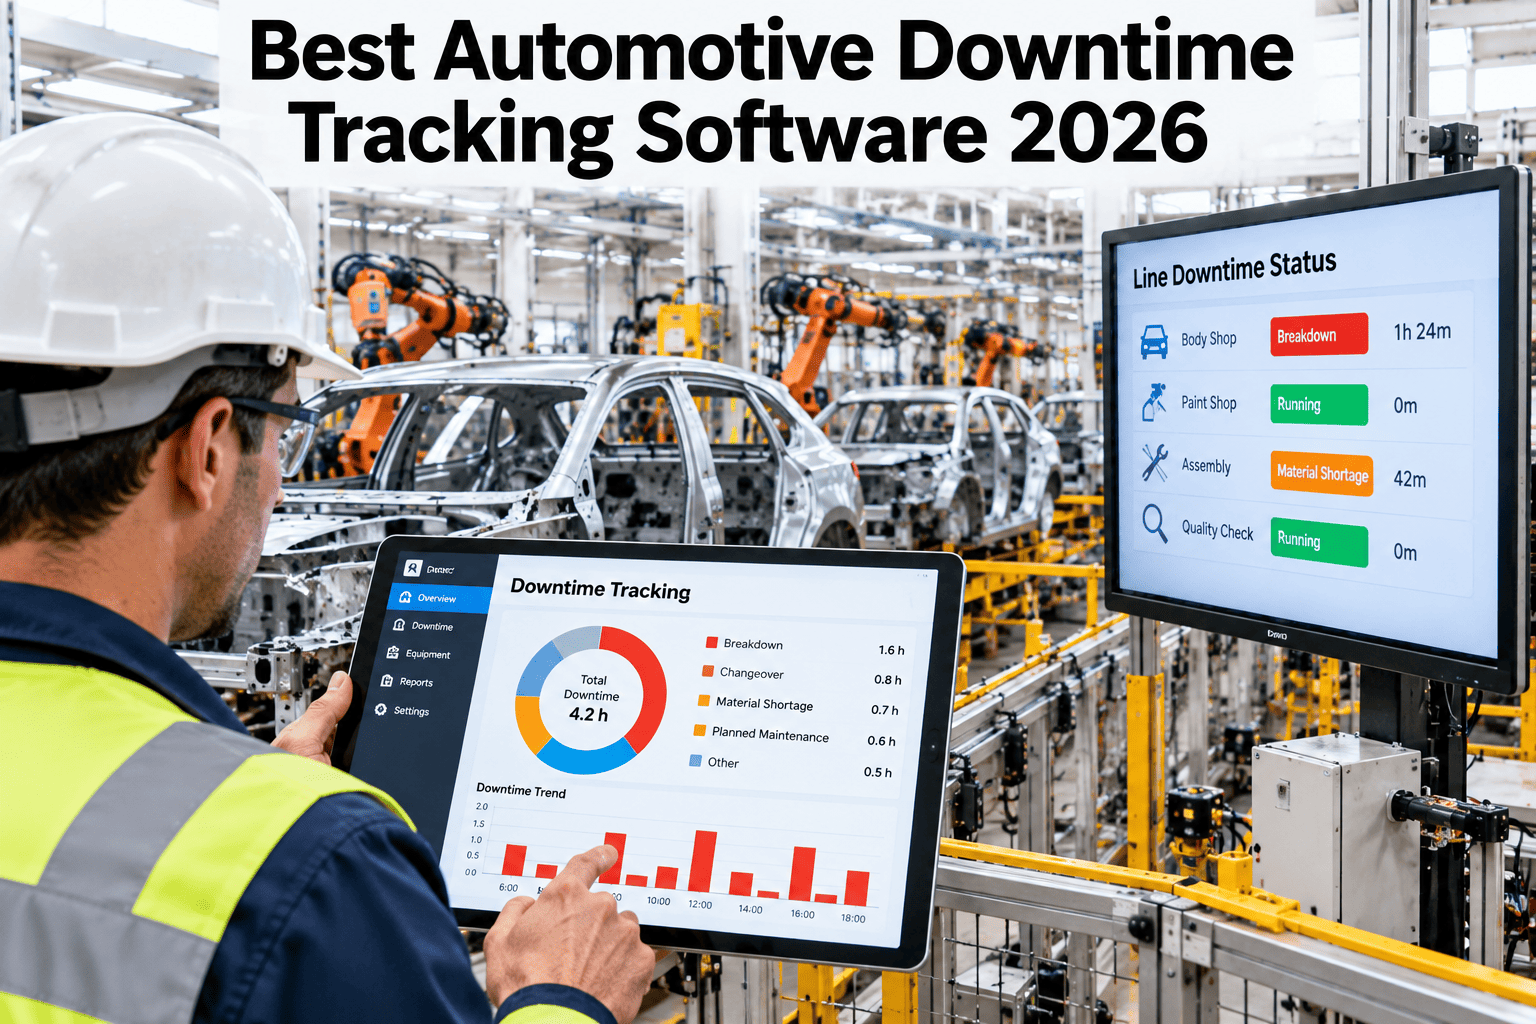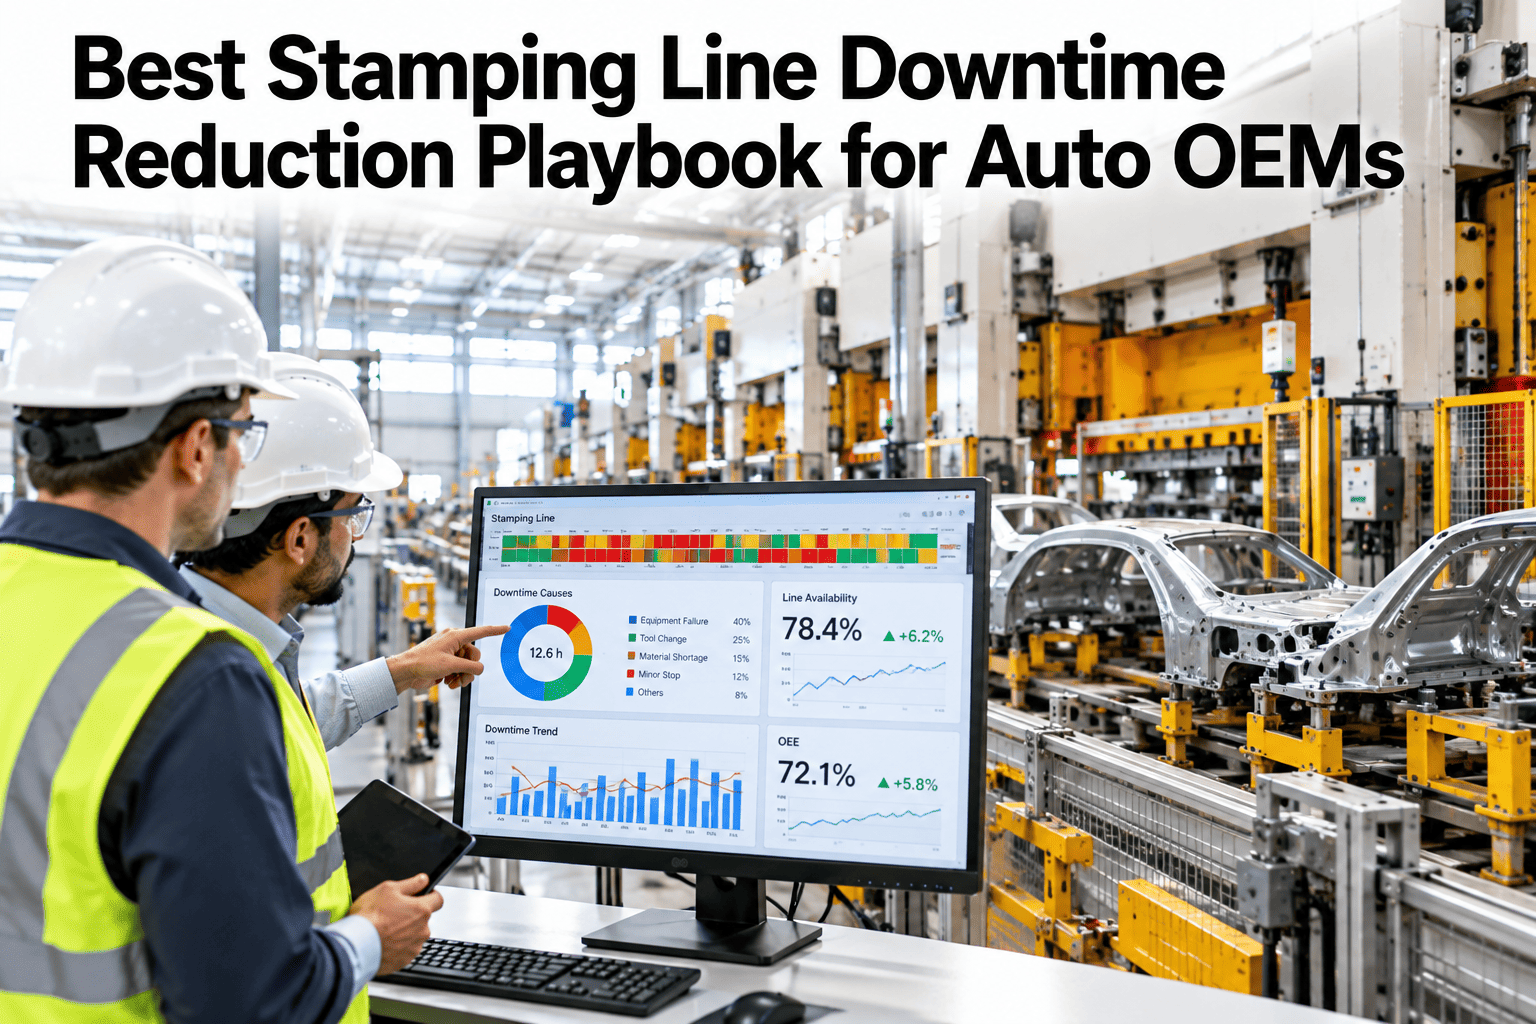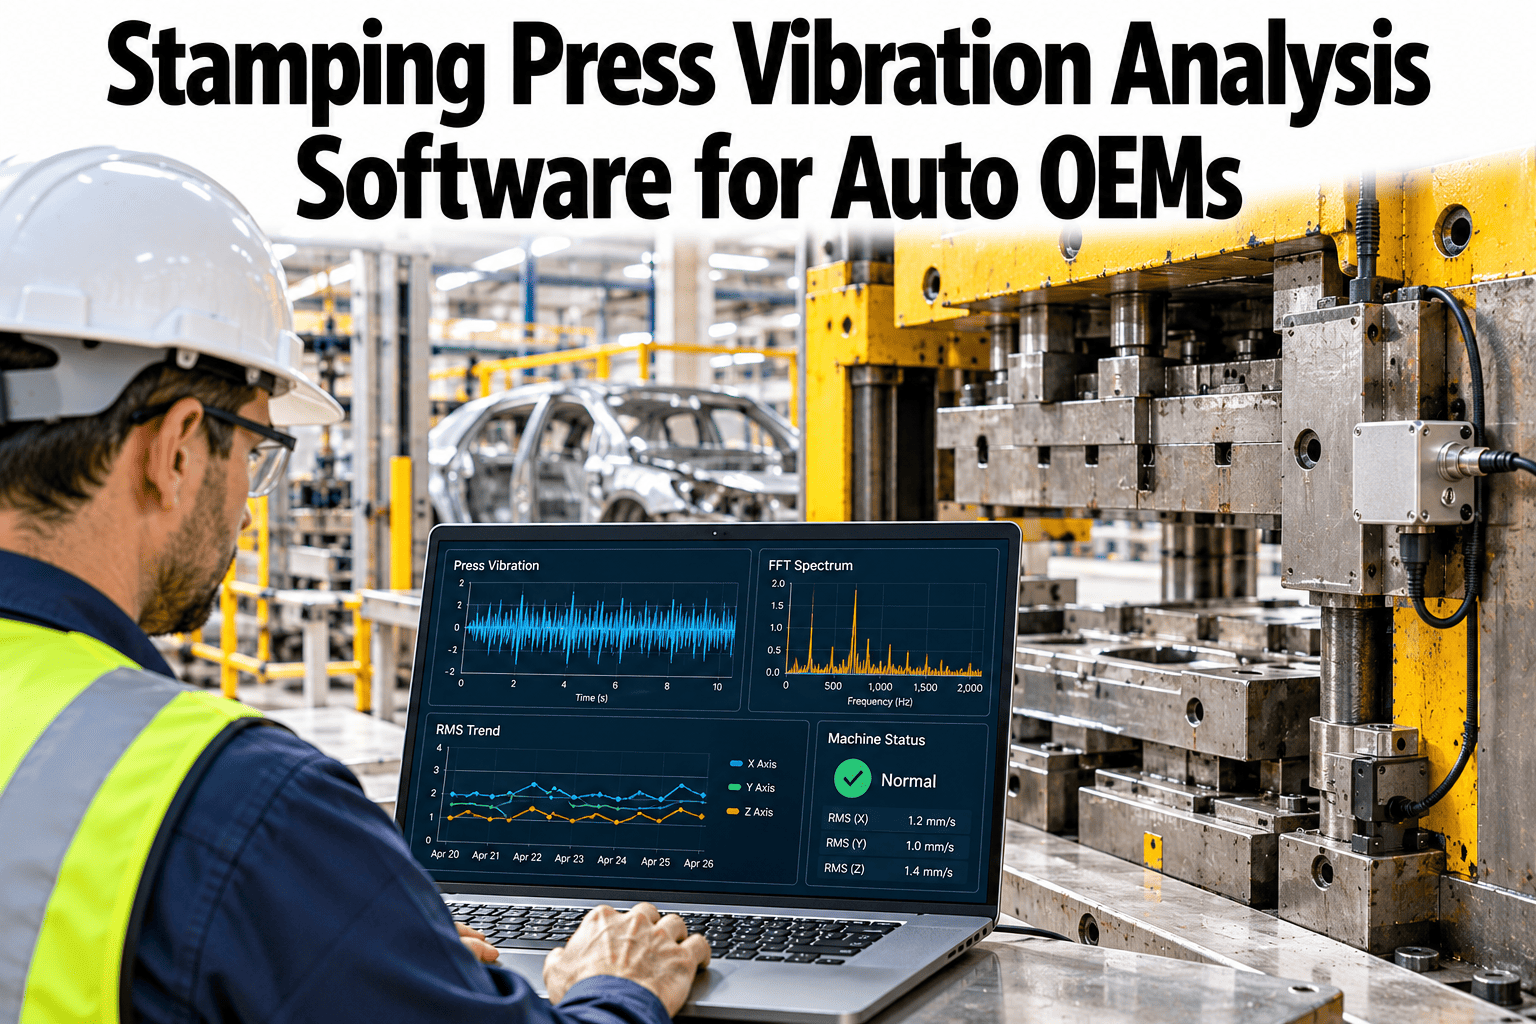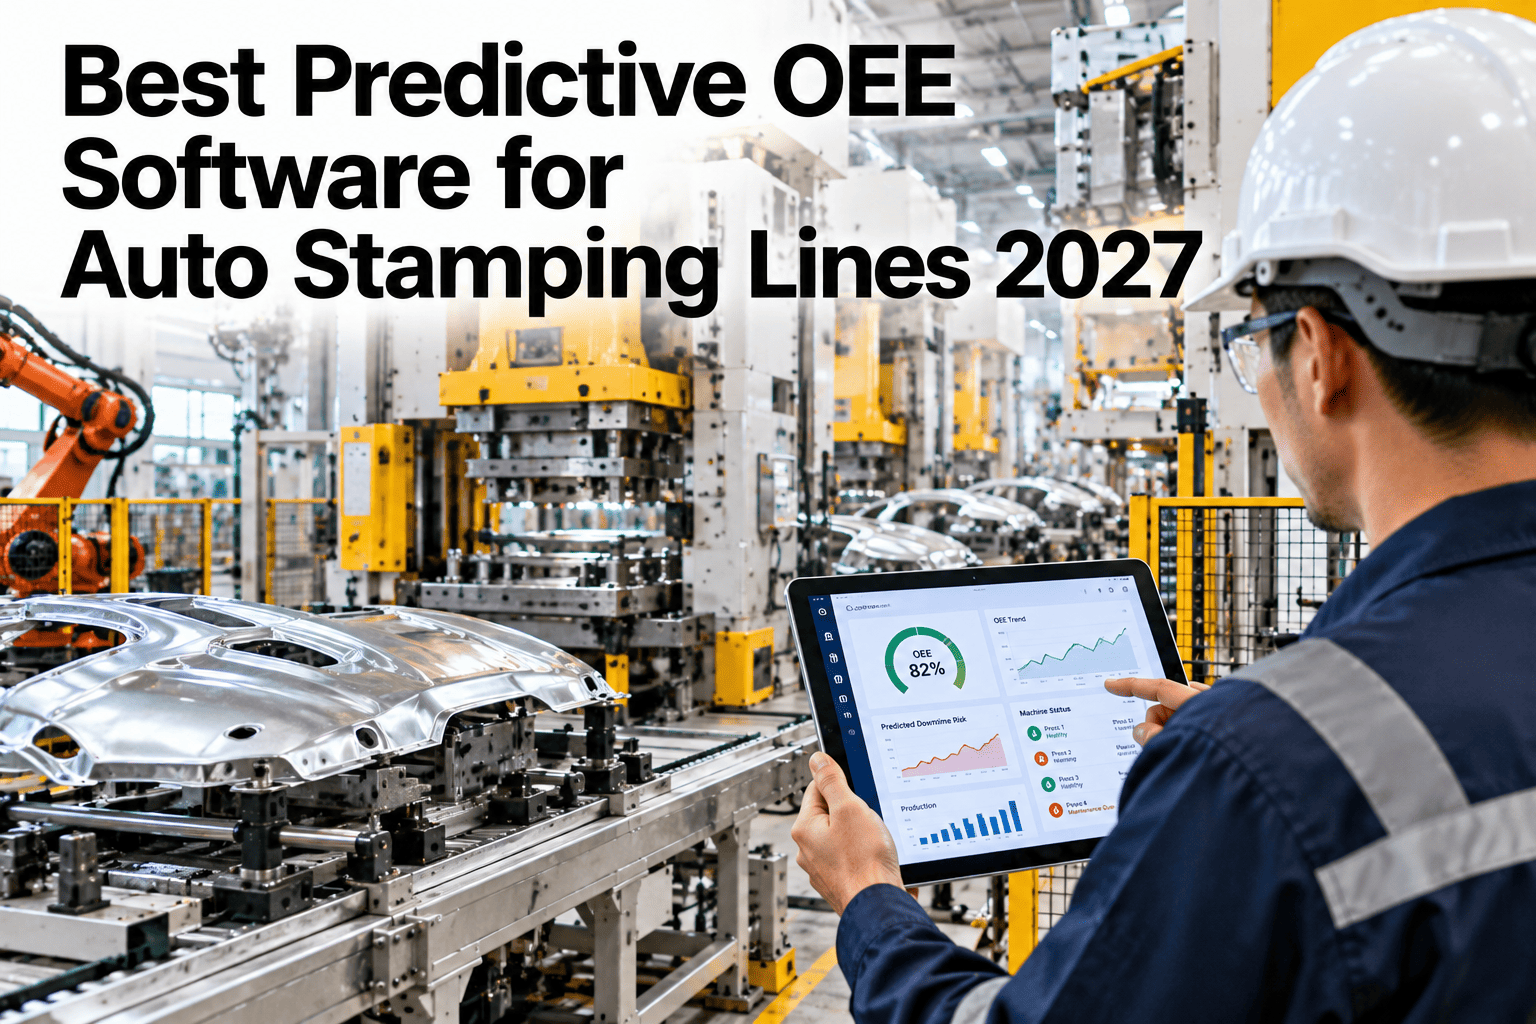
Most OEE software for a stamping line reports what already happened, yesterday's downtime, last shift's micro-stop count, after the loss is already locked in. A predictive layer on top of that reporting asks a different question: given current press health trends, upcoming die changes and recent micro-stop patterns, what's likely to go wrong in the next few hours, while there's still time to do something about it. Press downtime forecasting, die-change delay prediction and micro-stop pattern modeling together turn OEE from a scorecard into an early warning system. Press shop leaders can review their own stamping line against this predictive approach in a short session.
OEE Software That Looks Forward, Not Just Backward
iFactory forecasts press downtime risk, die-change delay and micro-stop patterns ahead of time, not after the loss is already recorded.
Three Kinds of Prediction, One OEE View
Not every loss on a stamping line is predictable the same way, so a useful predictive OEE system combines several specific models rather than one generic forecast.
| Prediction Type | What It Forecasts | Typical Lead Time |
|---|---|---|
| Press downtime forecasting | Likelihood of an unplanned stop based on current press health trends | Hours to a shift ahead, depending on the trend |
| Die-change delay prediction | Whether a scheduled die change is likely to run over its target time | Ahead of the scheduled changeover itself |
| Micro-stop pattern models | Whether a recurring micro-stop pattern is likely to continue or escalate | Based on recent trend, often within the current shift |
Find Out What Your Own Line's Forecast Would Show
Book a 30-minute session and iFactory will build a sample downtime forecast from your own press and schedule data.
How Each Prediction Model Works
Press Downtime Forecasting
Current health trends across hydraulic, bearing, servo and flywheel systems feed a risk score for unplanned stops in the near term.
Die-Change Delay Prediction
Historical changeover performance for the specific die and crew combination informs whether the upcoming change is likely to run on time.
Micro-Stop Pattern Models
Recent micro-stop frequency and clustering are compared against known escalation patterns to flag a developing issue early.
Signals Your Current OEE Software Is Purely Reactive
Where iFactory Fits
iFactory layers prediction on top of real-time OEE tracking, giving press shop teams a forward-looking view, not just a historical one.
Press Health-Driven Forecasting
Downtime risk forecasts draw on continuous press subsystem health data, not just historical averages.
Die and Crew-Specific Delay Prediction
Delay predictions account for the specific die and crew combination, since changeover performance varies by both.
Escalation-Aware Micro-Stop Models
Recent micro-stop patterns are compared against known escalation signatures to flag developing issues early.
Forecast Accuracy Tracking
Predictions are tracked against actual outcomes over time, keeping the models accountable and improving them continuously.
Reviewed by iFactory's Automotive Operations Analytics team for alignment with current predictive OEE practice. The forecast figures shown are illustrative; actual prediction accuracy depends on your own historical data depth and press configuration.
Frequently Asked Questions
How accurate are these predictions in practice?
Accuracy depends on how much historical data is available to train each model and how consistent your line's conditions are, so accuracy is tracked continuously and reported transparently rather than assumed fixed. Support can walk through expected accuracy for your data depth.
Does a predicted delay or downtime risk trigger an automatic action?
No, predictions surface as alerts for supervisors and planners to act on, such as staging extra support for a likely delayed changeover, rather than triggering an automatic line stop or schedule change.
Can this work without years of historical data?
Models can start with a shorter history and improve as more data accumulates, though prediction confidence is generally lower early on and improves over time. See what your current data history would support in a short session.
Does this require the press health monitoring described elsewhere to already be in place?
Press health data strengthens the downtime forecasting model specifically, but the die-change delay and micro-stop pattern models can work from schedule and stop data alone if full health monitoring isn't yet deployed.
How does this integrate with our existing OEE reporting?
Predictive models layer on top of your existing OEE calculation, adding a forecast view alongside the historical reporting you already rely on. Ask support how this integrates with your current OEE system.
Know What's Likely to Go Wrong Before It Does
iFactory forecasts press downtime, die-change delay and micro-stop patterns ahead of time. Book a walkthrough on your own stamping line.