By the time a stamping press actually stops, the signs were usually there for hours, a slight rise in hydraulic pressure variance, a die temperature trend drifting off its normal band, a subtle increase in cycle time that nobody flagged because none of it crossed a hard alarm threshold on its own. Unplanned press downtime rarely arrives without warning, it arrives without anyone connecting the warning signs in time. See your own press's next-24-hour risk forecast.
See the Downtime Coming, Not Just the Downtime Itself
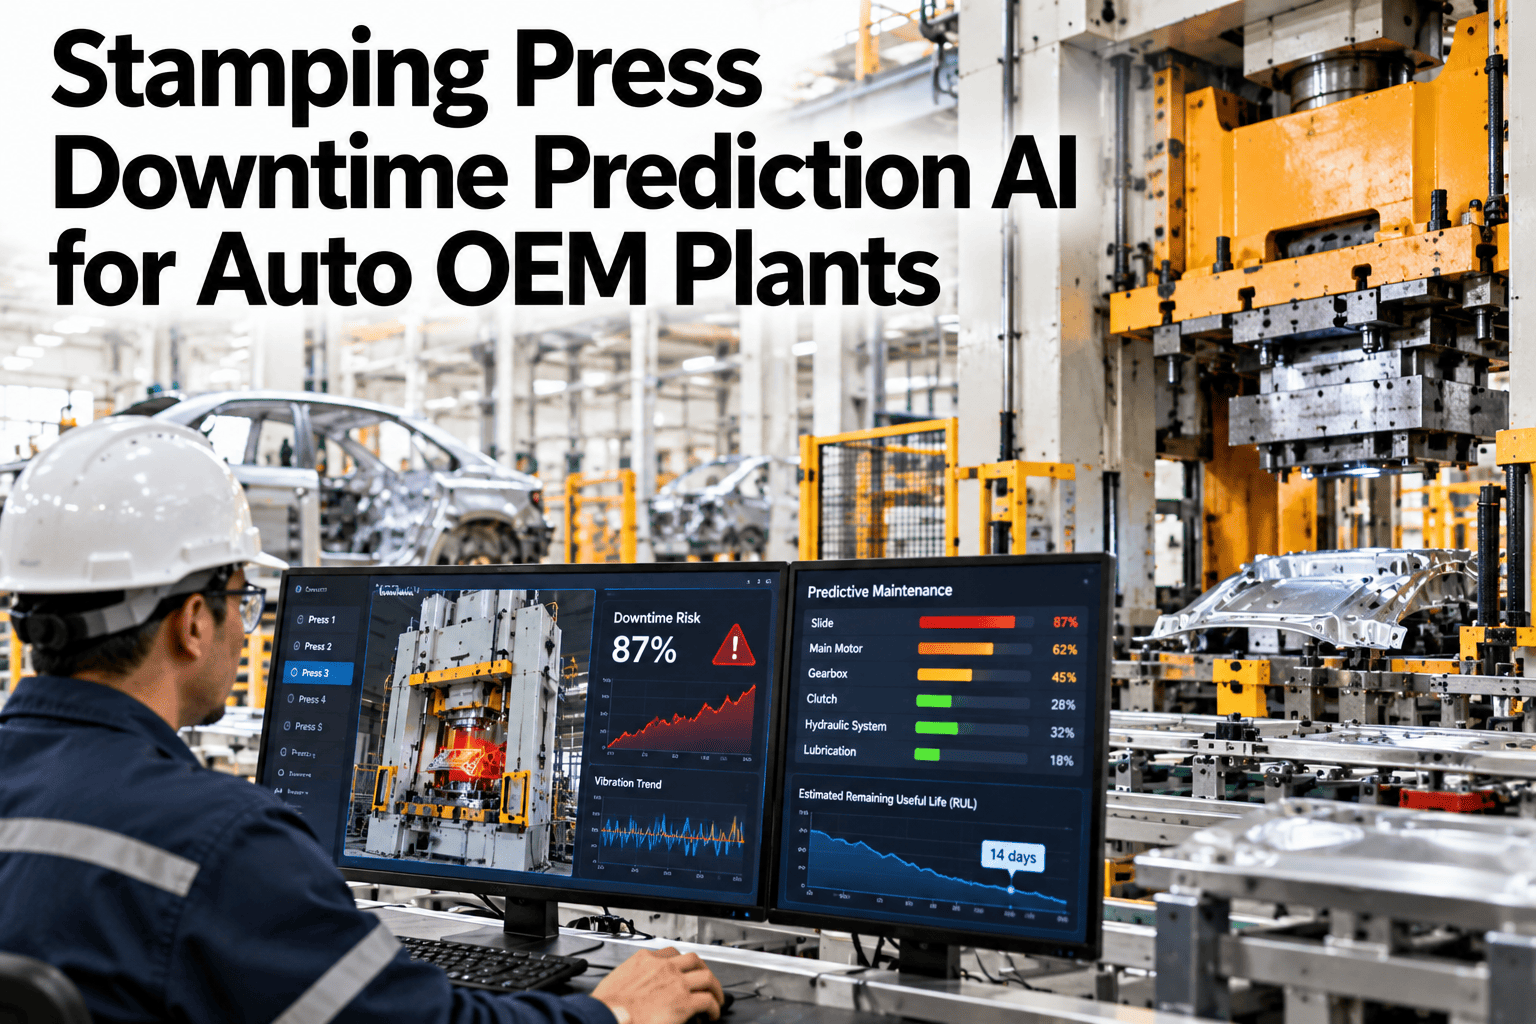
iFactory AI models leading indicators across your stamping line and surfaces a next-24-hour downtime probability, with specific actions to intervene before the press actually stops.
Alarms Catch Failures. Leading Indicators Catch the Drift Before Them.
A hard alarm threshold tells you a parameter has already crossed into failure territory. By then, the window to intervene before a stop has usually closed.
Most stamping lines run on exactly this kind of reactive alarm logic, which is why unplanned stops still feel sudden even on well-maintained presses. A leading indicator model watches the trend underneath the alarm threshold, not just the threshold itself.
The Next 24 Hours, Hour by Hour
Risk is rarely flat across a shift. The forecast shows where it concentrates, so attention goes to the right window instead of the whole day equally.
See Where Risk Concentrates on Your Own Line
Book a 30-minute session and see an hour-by-hour downtime risk forecast built from your own press data.
Leading Indicators the Model Tracks
No single signal predicts a stop reliably on its own. The model's value is in reading several together.
| Indicator | What a Drift Suggests |
|---|---|
| Hydraulic Pressure Variance | Seal wear or valve degradation building toward failure |
| Die Temperature Trend | Cooling inefficiency that can lead to part quality drift or binding |
| Cycle Time Drift | Mechanical resistance increasing, often ahead of a jam or stop |
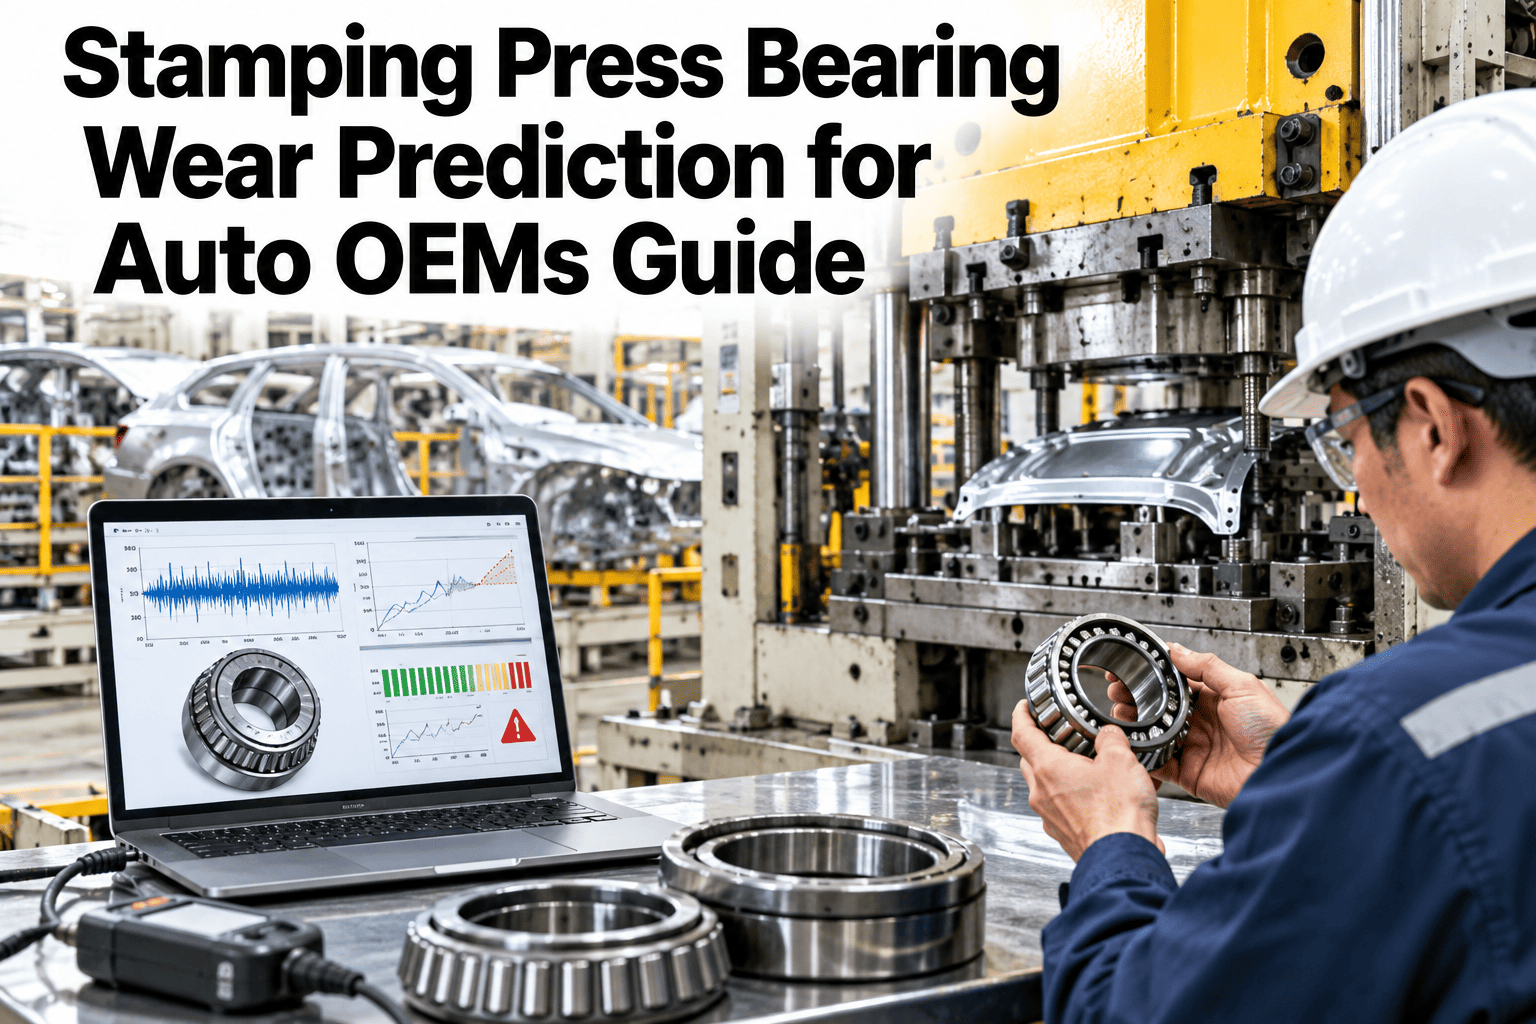
| Vibration Signature | Bearing or alignment issues developing before an audible fault |
| Scrap Rate Trend | Tooling wear reaching a point that often precedes a forced stop |
From Risk Score to Prescriptive Action
A risk percentage on its own tells a planner to worry. A prescriptive suggestion tells them what to actually do about it.
Targeted Inspection
Specific component flagged for inspection based on which indicator is driving the risk score.
Adjusted Maintenance Window
A scheduled maintenance task moved earlier when risk is trending up ahead of its planned date.
Run-Rate Adjustment
Temporary cycle rate reduction suggested where it meaningfully lowers near-term stop risk.
Parts and Crew Readiness
Spare part availability and crew assignment checked ahead of a high-risk window, not after a stop.
Reactive vs Predictive Maintenance, Side by Side
Getting It Running on Your Line
iFactory AI connects to your press control systems and historian to build a leading-indicator model from live line data.
Frequently Asked Questions
How accurate is the next-24-hour risk prediction?
Accuracy improves as the model calibrates against your specific press's failure history, typically tightening noticeably within the first several weeks of live data.
Does this replace our existing maintenance team's judgment?
No, the model surfaces risk and suggested actions, but the maintenance team still makes the final call on inspections, repairs, and schedule changes.
What press control systems does this connect to?
Most standard press control and historian systems can be connected during setup. Support can confirm compatibility with your current systems.
Can this work across multiple press lines at once?
Yes, each press line is modeled separately using its own data, with risk forecasts and prescriptive actions shown per line rather than blended into one plant-wide number.
How does this handle a brand-new press with limited history?
The model begins with available data from commissioning and improves its accuracy as more cycles and maintenance history accumulate. Ask what a new press would need in a walkthrough.
Act on the Drift Before It Becomes a Stop
iFactory AI forecasts stamping press downtime risk and recommends the specific action to take. Book a walkthrough on your own line.