A surprising number of process engineers can recite their line's takt time from memory but have never actually measured whether real cycle time is tracking it minute by minute, station by station. Takt time is a target set by customer demand, cycle time is what the line actually does, and the space between the two is where bottlenecks quietly form and grow. When that gap goes unmeasured, buffer stock and overtime end up covering for a scheduling problem nobody can see until a shipment is already late. Engineers who want a live comparison of takt against actual cycle time on their own line can book a demo to see it in action.
PROCESS ENGINEER GUIDE · LINE BALANCING · 2026
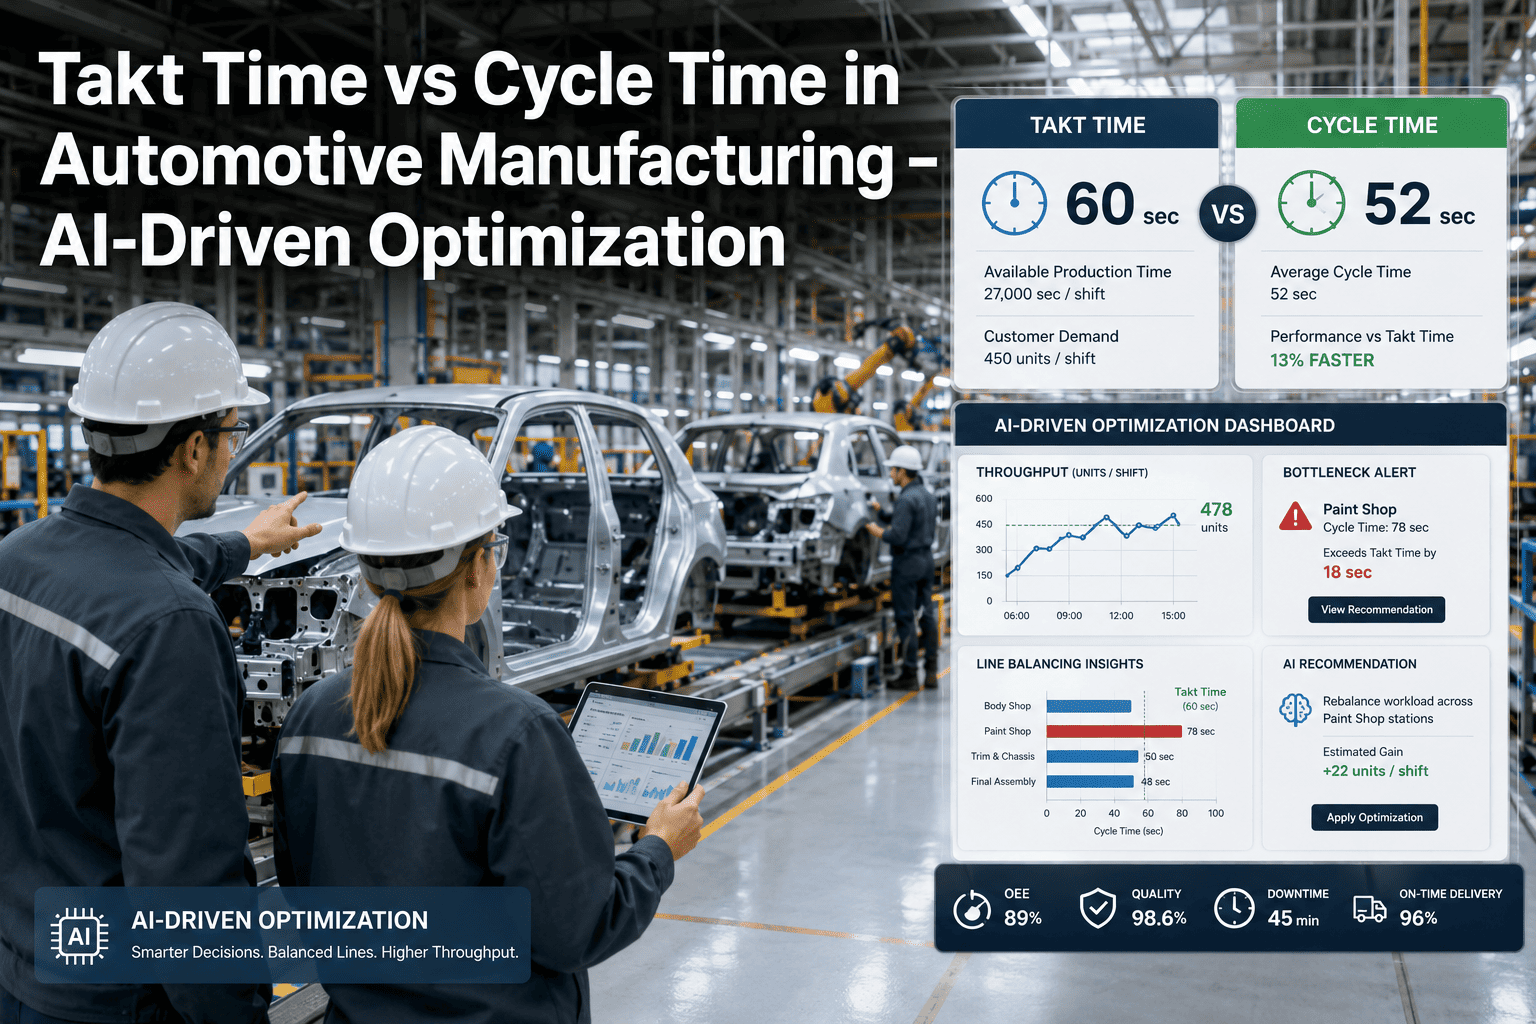
Takt Time Sets the Pace, Cycle Time Reveals the Truth
AI-driven scheduling adjusts line speed, buffer allocation, and operator assignment continuously, closing the gap between what the line should produce and what it actually does.
TAKT TIME
The Pace Demand Requires
Calculated from available production time divided by customer demand. It is a target derived from the market, not a measurement of the line itself, and it changes whenever demand or shift length changes.
CYCLE TIME
The Pace the Line Delivers
The actual time each station takes to complete its work, station by station. When any station's cycle time exceeds takt time, that station becomes the bottleneck for the entire line.
TAKT TIME FORMULA
Available Production Time ÷ Customer Demand
A shift with 460 available minutes and demand for 400 units yields a takt time of 1.15 minutes per unit.
CYCLE TIME FORMULA
Total Work Content ÷ Number of Operators at a Station
A station with 3.2 minutes of work content split across two operators yields a cycle time of 1.6 minutes.
Why the Gap Is So Easy to Miss
Most lines are balanced once, during initial launch, using average cycle times measured over a short observation window. Over the following months, tooling wear, operator turnover, and minor process drift all push individual station cycle times away from that original baseline, usually by small amounts that never trigger an alarm on their own.
The result is a line that looks balanced on paper but is quietly running one or two stations above takt every shift, forcing downstream buffers to absorb the difference until they cannot anymore. AI-driven scheduling continuously compares live cycle time against takt at every station, catching this drift long before it shows up as a missed shipment.
The stations most likely to drift are rarely the ones engineers expect. Complex, highly automated stations tend to hold their original cycle time well because their pace is set by machine logic rather than human variability. It is the manually paced stations, and the ones with the most frequent minor tooling changes, that drift furthest from their original balance over time.
TAKT TIME
Stations C and F are trending above the 60-second takt line, making them the current bottlenecks for the whole line, even though every other station is comfortably within pace.
AI LINE BALANCING
Watch Every Station Against Takt in Real Time
Get a live view of which stations are trending above takt before they become tomorrow's bottleneck.
Key Terms Side by Side
Engineers new to line balancing often conflate takt time, cycle time, and lead time, which leads to confused improvement priorities. Getting these definitions precise is the first step toward knowing which lever actually moves the number you are trying to change.
| Term | Definition | Who Sets It | How Often It Changes |
|---|---|---|---|
| Takt Time | Available time ÷ customer demand | Demand and shift schedule | Weekly to monthly |
| Cycle Time | Actual time per station to complete work | Line design and operator pace | Continuously, in small drifts |
| Lead Time | Total time from order to finished part | Full process flow, including queues | With WIP and scheduling |
| Bottleneck Station | Station whose cycle time exceeds takt | Whichever station drifts furthest | Shifts over time without monitoring |
How AI Scheduling Keeps Stations in Sync
1
Measure Continuously
Every station's actual cycle time is logged in real time instead of sampled during periodic time studies.
2
Compare Against Takt
Live cycle time is checked against current takt time, which itself updates as demand or shift length changes.
3
Flag Drift Early
Stations trending above takt are surfaced before buffers run out, giving supervisors time to react.
4
Rebalance Dynamically
Operator assignments and buffer allocation adjust to absorb short-term imbalance without a full line stop.
Frequently Asked Questions
What happens when cycle time exceeds takt time at one station?
That single station becomes the bottleneck for the entire line, because downstream stations end up waiting on it regardless of how efficiently they run themselves. Even a small excess of a few seconds per unit compounds across a full shift, eventually forcing overtime or missed shipment targets to make up the shortfall. Identifying the specific station early, rather than treating the whole line as generically slow, is what makes targeted rebalancing possible.
How often should takt time be recalculated?
Takt time should be recalculated whenever customer demand shifts meaningfully or the available production time changes, such as a new shift pattern or a planned maintenance window. Many plants only revisit it quarterly or at model changeovers, which leaves the line balanced against outdated demand for weeks at a time. Teams can review a more responsive recalculation cadence through support based on how volatile their demand pattern actually is.
Can AI scheduling actually change operator assignments on the fly?
Yes, within the constraints defined by the plant, such as certified skill sets and safety qualifications per station. The system identifies which stations are trending toward exceeding takt and recommends or triggers reassignment of cross-trained operators to relieve the pressure point before it causes a full stoppage. This keeps rebalancing decisions data-driven rather than dependent on a supervisor noticing the imbalance visually during a walk of the floor.
Is this only useful for high-volume dedicated lines?
It is most valuable on high-mix lines, actually, since takt time itself shifts more often when multiple models or part numbers share the same stations. Dedicated single-product lines still benefit from continuous cycle time monitoring, but the rebalancing value grows substantially wherever model mix, changeovers, or variable demand make manual rebalancing impractical to do by hand on a regular basis.
How quickly can we see our own takt versus cycle time gap?
Once station-level sensors or existing PLC data are connected, most engineering teams see an accurate live comparison within the first two weeks, since the underlying data typically already exists on the line. Plant teams can book a demo to see how this comparison would look mapped against their own current line layout and product mix.
TAKT VS CYCLE TIME · AI OPTIMIZATION
Stop Guessing Which Station Is the Bottleneck
See live takt-versus-cycle-time comparisons across every station on your line, updated continuously.

.png)