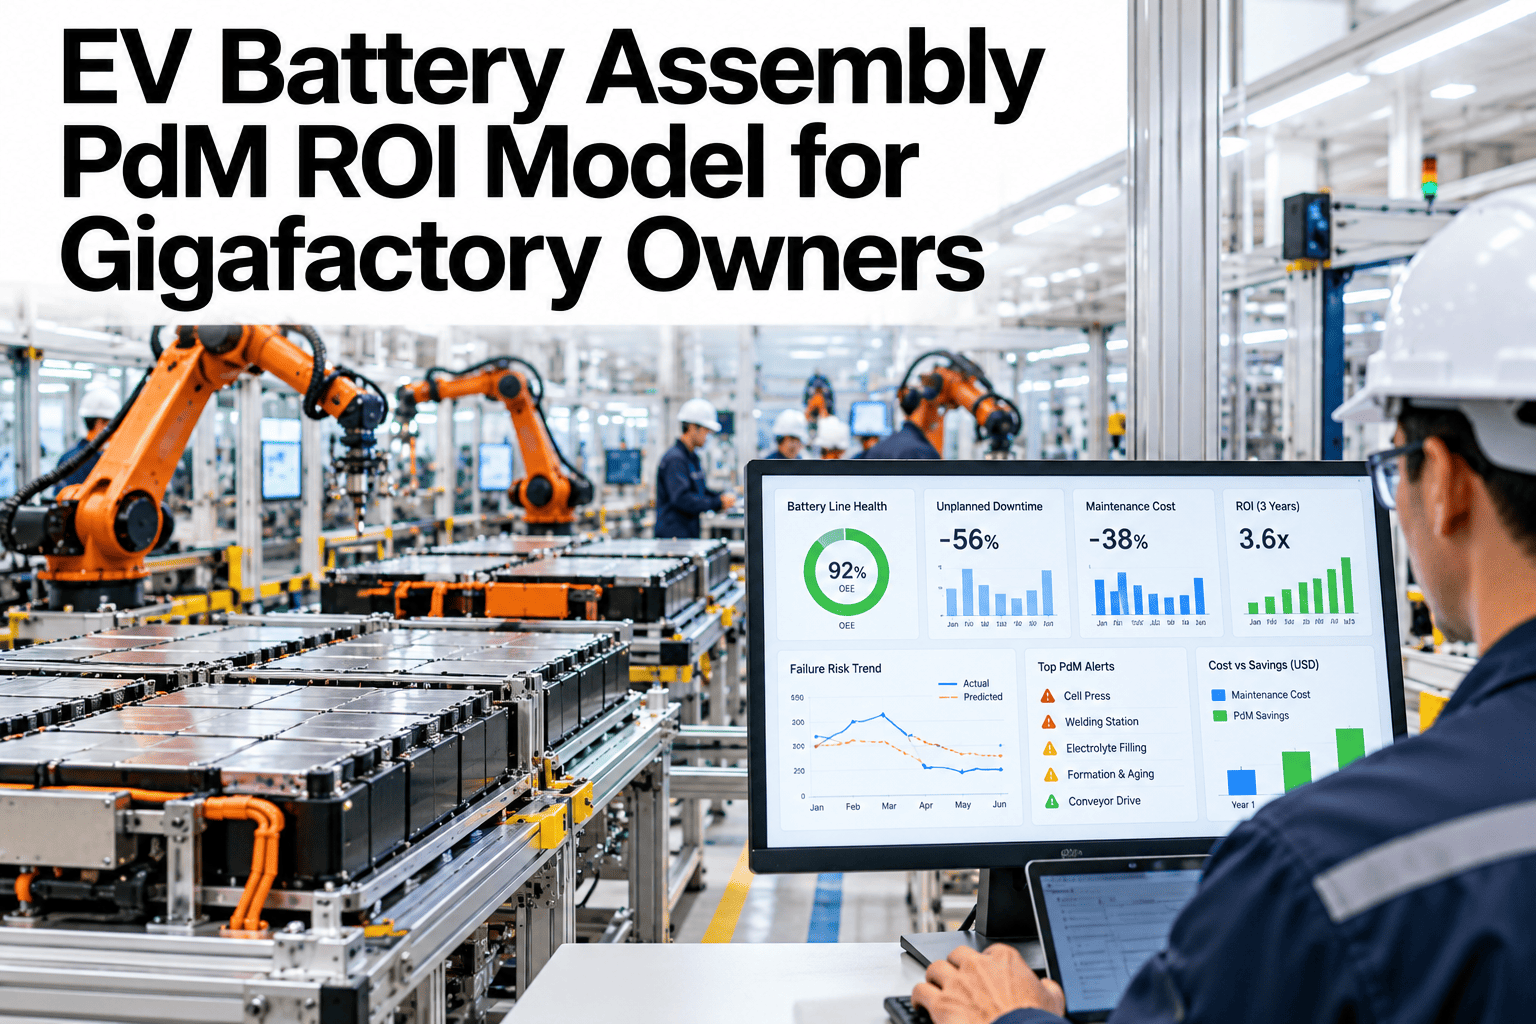
A gigafactory owner or CFO approving a predictive maintenance investment needs a financially defensible model — not a vendor claim, not a general industry benchmark, but a calculation built on their own production economics, their own downtime history, and their own yield performance. The ROI for EV battery assembly PdM has three value streams: avoided downtime cost, yield uplift from early process deviation detection, and safety incident cost reduction. When all three are quantified and stacked against the platform cost over a three-year horizon, the case for PdM investment in a gigafactory is typically one of the strongest in the capital budget. iFactory AI provides the operational data that makes this calculation specific to your plant. See how iFactory AI builds the ROI model for your gigafactory configuration.
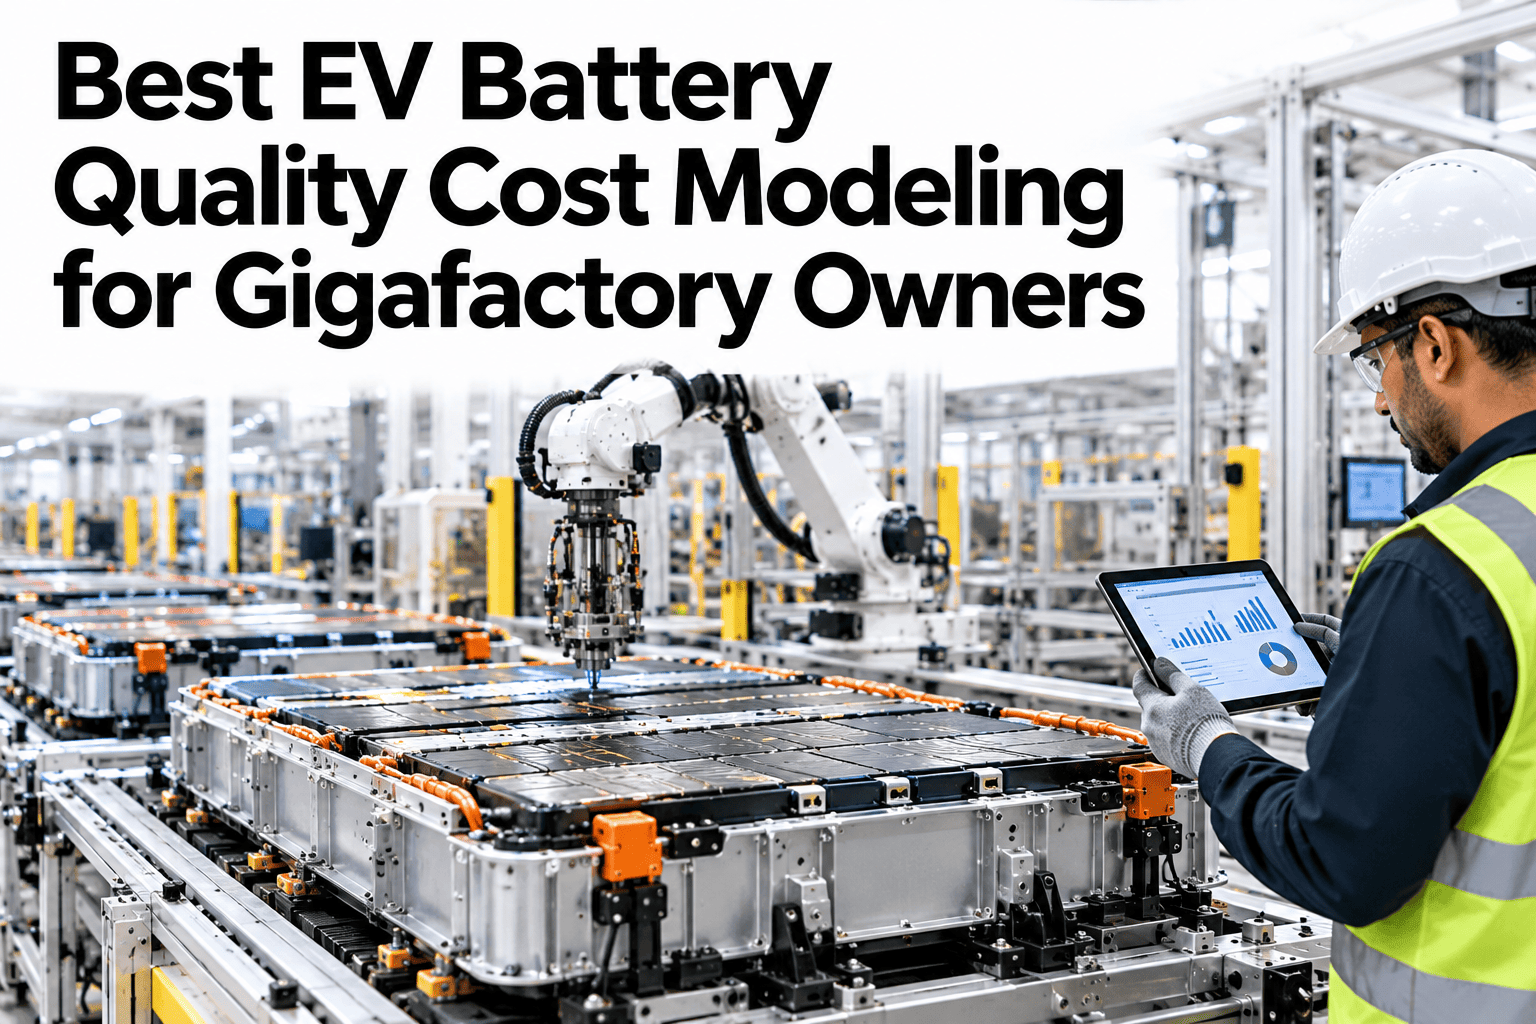
The 3-Year PdM ROI Model for Gigafactory Owners
Three value streams — avoided downtime, yield uplift, and safety cost reduction — stacked against platform cost into a defensible CFO-ready investment case.
Value Stream 1 — Avoided Downtime Cost
Downtime cost in a gigafactory is not a single number — it is a function of production rate, cell cost, and the downstream cascade effect when assembly stops mid-sequence.
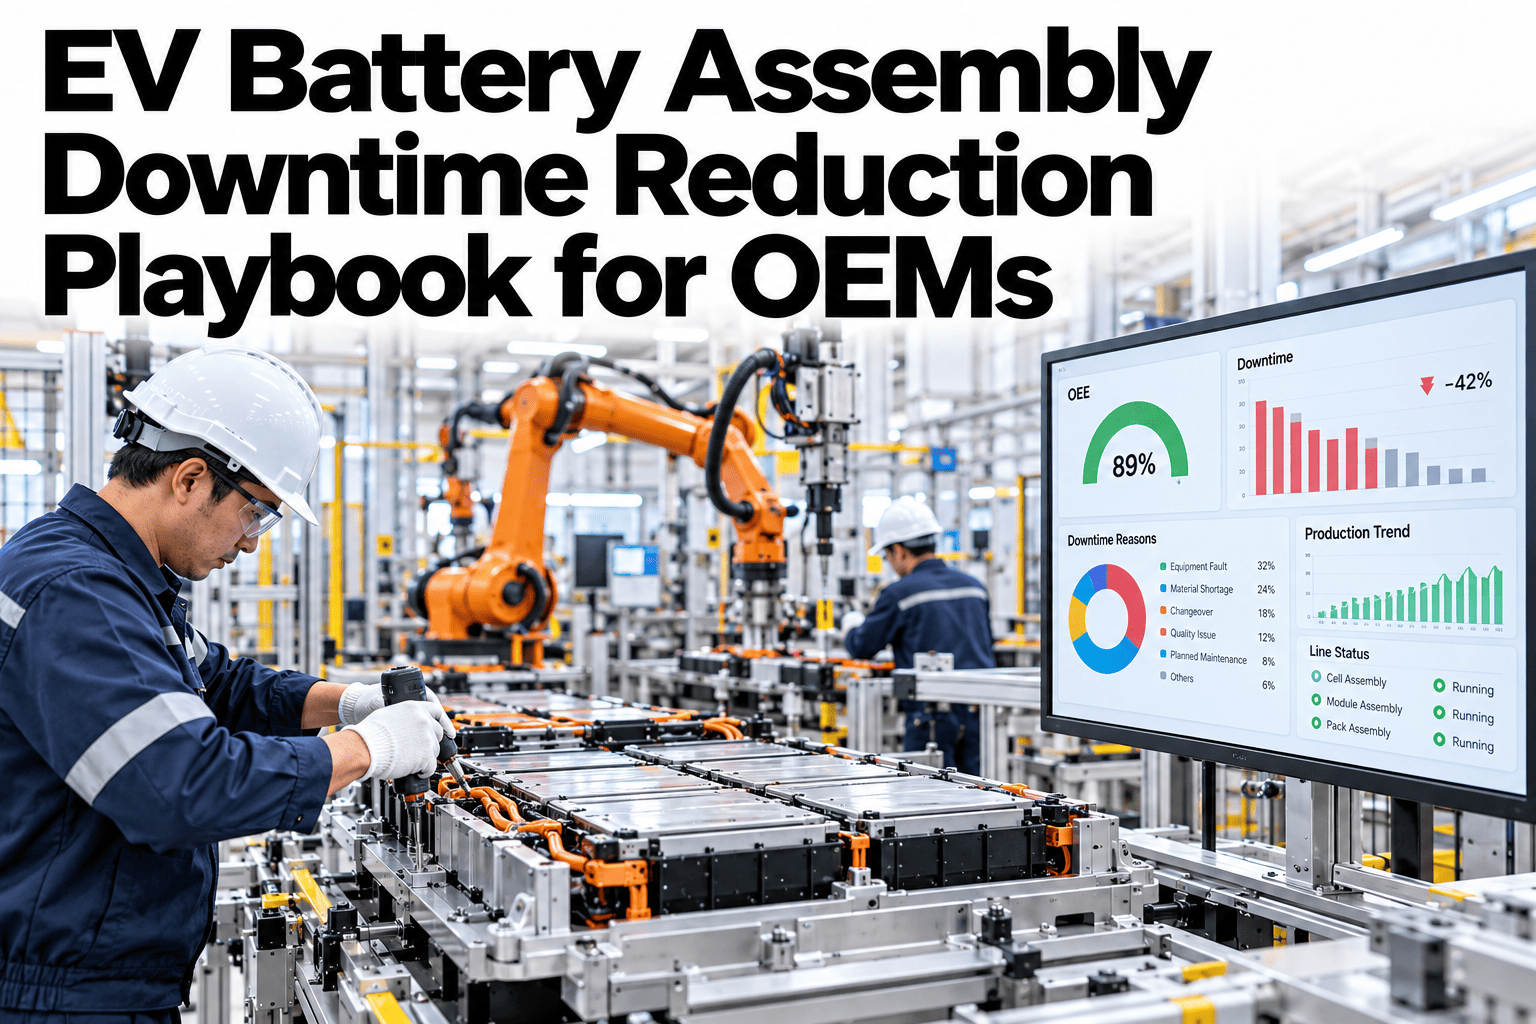
A gigafactory producing 20 GWh annually at $100/kWh cell cost, running 8,200 hours, loses approximately $244,000 per hour of unplanned production stop in cell value alone — before adding module and pack assembly labor, overhead, and delivery penalty exposure. PdM that prevents twenty hours of unplanned downtime per year generates nearly $5 million in recovered value from this stream alone.
Value Stream 2 — Yield Uplift
Yield in EV battery assembly is not just a quality metric — it is a direct revenue line. Every cell that is scrapped or downgraded at the end of the formation and testing process represents the full manufacturing cost with zero revenue recovery.
iFactory AI monitors formation chamber parameters, electrolyte dispensing accuracy, and cell handling conditions — catching process deviations before they propagate to yield loss. A formation temperature excursion caught in the first 30 minutes affects a fraction of the cells in a deviation that runs undetected for two hours.
Conveyor position drift, welding parameter variation, and dispensing nozzle wear are all equipment conditions that cause yield loss before they cause a production stop. PdM that detects these conditions early prevents the yield loss phase, not just the equipment failure phase.
Yield uplift value equals the additional cells produced at sellable quality relative to the baseline yield rate, multiplied by the cell selling price. A 0.5% yield improvement on a 20 GWh gigafactory at $120/kWh represents approximately $12 million in additional annual revenue — from equipment monitoring, not from process chemistry changes.
Build Your Gigafactory's Specific ROI Model
iFactory AI uses your plant's production economics — GWh capacity, cell cost, yield baseline, downtime history — to build a specific three-year ROI model rather than a generic industry estimate. Book a session to start the model.
Value Stream 3 — Safety Incident Cost Reduction
EV battery assembly involves live electrochemical hazards, high-energy laser systems, and pressure-handling processes where equipment failure can produce safety events with costs that dwarf the equipment failure itself.
Structuring the 3-Year Business Case
A CFO-ready PdM business case stacks all three value streams against the platform cost and presents a payback period and net present value at the company's cost of capital.
| Business Case Component | Year 1 | Year 2 | Year 3 | 3-Year Total |
|---|---|---|---|---|
| Platform cost (capex + annual) | High — initial investment | Annual fee only | Annual fee only | Total cost of ownership |
| Avoided downtime value | 30–50% reduction | 50–65% reduction | 60–70% reduction | Largest value stream |
| Yield uplift value | 0.2–0.5% improvement | 0.4–0.8% improvement | 0.6–1.0% improvement | Second largest stream |
| Safety incident reduction | Incident avoidance value | Sustained reduction | Sustained reduction | Risk-adjusted value |
| Net value (all streams minus cost) | Near breakeven or positive | Strongly positive | Strongly positive | Positive NPV at typical WACC |
Frequently Asked Questions
What data does iFactory AI need to build a specific ROI model for our gigafactory?
The core inputs are: annual production capacity in GWh, current unplanned downtime hours per year, current yield rate and the known causes of yield loss, cell cost per kWh, and any documented safety events in the past three years. iFactory AI's pre-deployment scoping session collects these inputs and generates a facility-specific model within the first engagement meeting. Book a session to start building your specific ROI model.
How is the yield uplift value calculated when yield improvements are difficult to attribute to a single intervention?
The calculation tracks yield rate trend before and after PdM deployment while controlling for other variables — same cell chemistry, similar production volume, similar material quality. iFactory AI provides the before/after data from its own monitoring, and the attribution methodology uses the documented process deviation events that were caught early and the corresponding yield impact reduction measured at the formation and test stages. Ask support how iFactory AI tracks yield impact per monitored asset.
How should safety incident cost be quantified in the ROI model?
Safety incident cost is typically risk-adjusted in the model — the expected annual cost equals the probability of a specific event type multiplied by its historical cost range. For gigafactories without direct incident history, industry benchmark incident rates for battery assembly operations provide the probability input. Risk-adjusted safety value is a more defensible input than assuming a specific large event will be avoided, though the latter framing is appropriate for CFO conversations where a recent near-miss has a known cost estimate.
Is the payback period typically within the first year for gigafactory PdM investment?
For gigafactories with measurable baseline downtime, payback within twelve to eighteen months is the typical outcome when the model is built from actual production economics. The avoided downtime stream alone is often sufficient to cover the platform cost in the first year — yield uplift and safety reduction add to the case rather than being required for breakeven. Facilities with very low baseline downtime have a longer payback horizon but also present a different investment framing: they are preserving performance rather than recovering lost value. Walk through the payback calculation for your specific plant economics.
How does the ROI model account for the learning curve as the AI models improve over time?
The model is structured to show increasing ROI over the three-year period for this exact reason. Year 1 reflects an AI model in its baseline state, building its historical failure database. Year 2 reflects improved detection accuracy as failure signatures are refined from the first year's validated events. Year 3 reflects the mature model with the highest detection confidence and lowest false alarm rate. The improving trajectory is one of the reasons a three-year model horizon is more representative than a single-year calculation.
Build a CFO-Ready PdM Investment Case for Your Gigafactory
iFactory AI builds the three-stream ROI model from your plant's specific production economics — avoided downtime, yield uplift, and safety cost reduction stacked into a defensible 3-year case. Book a session to start the model.