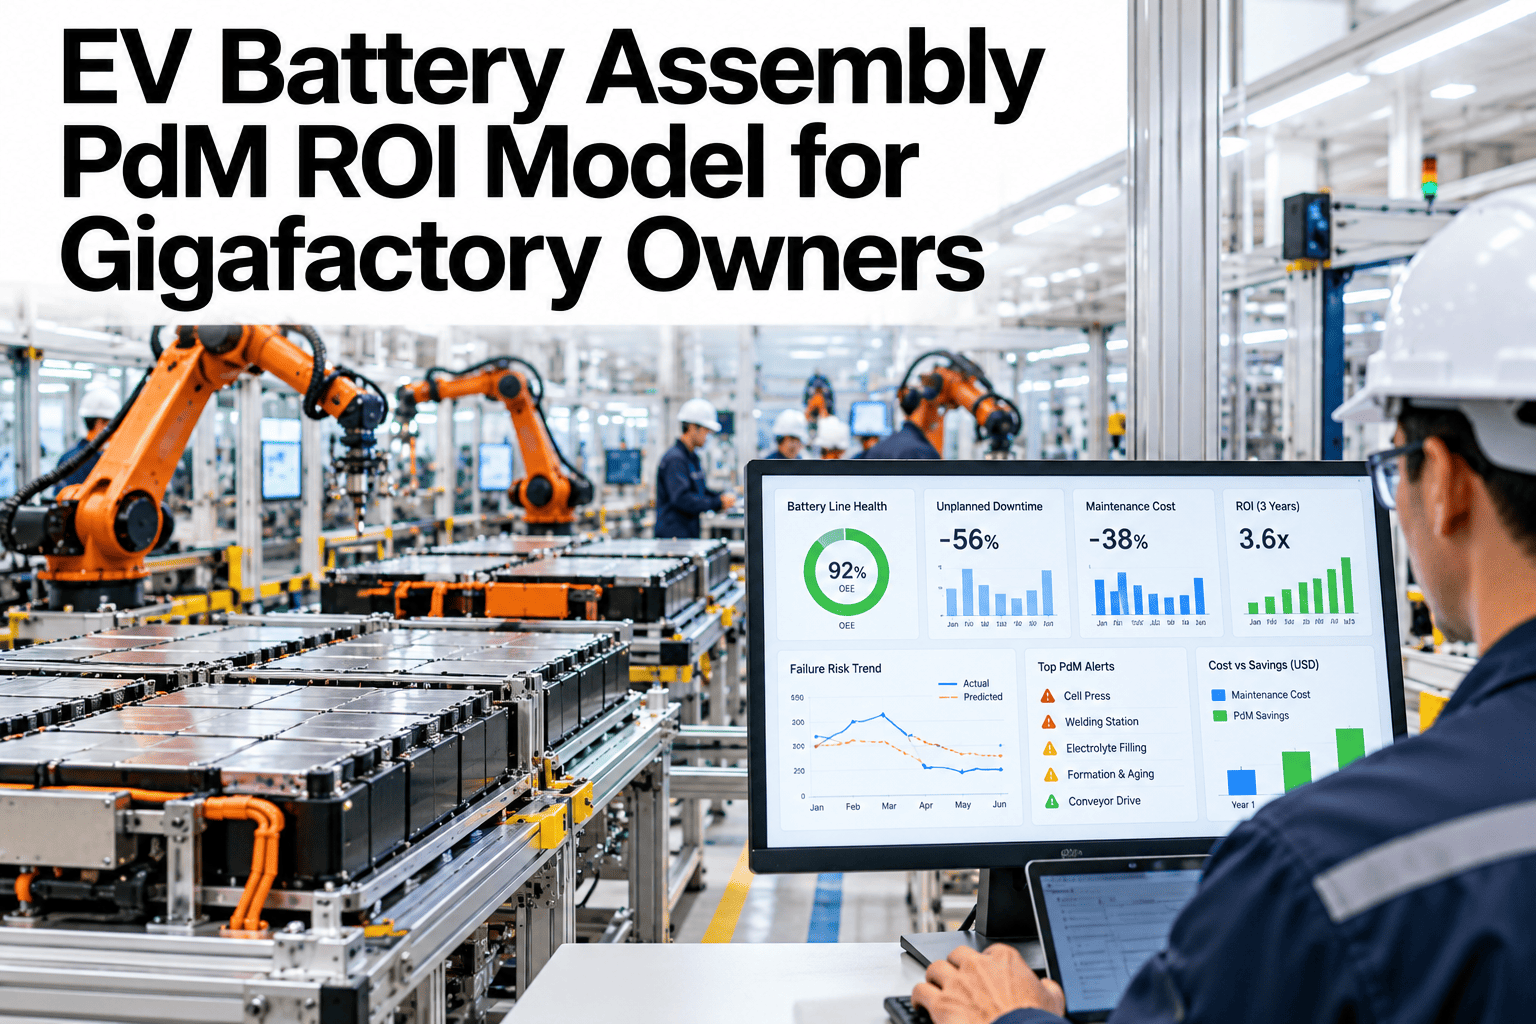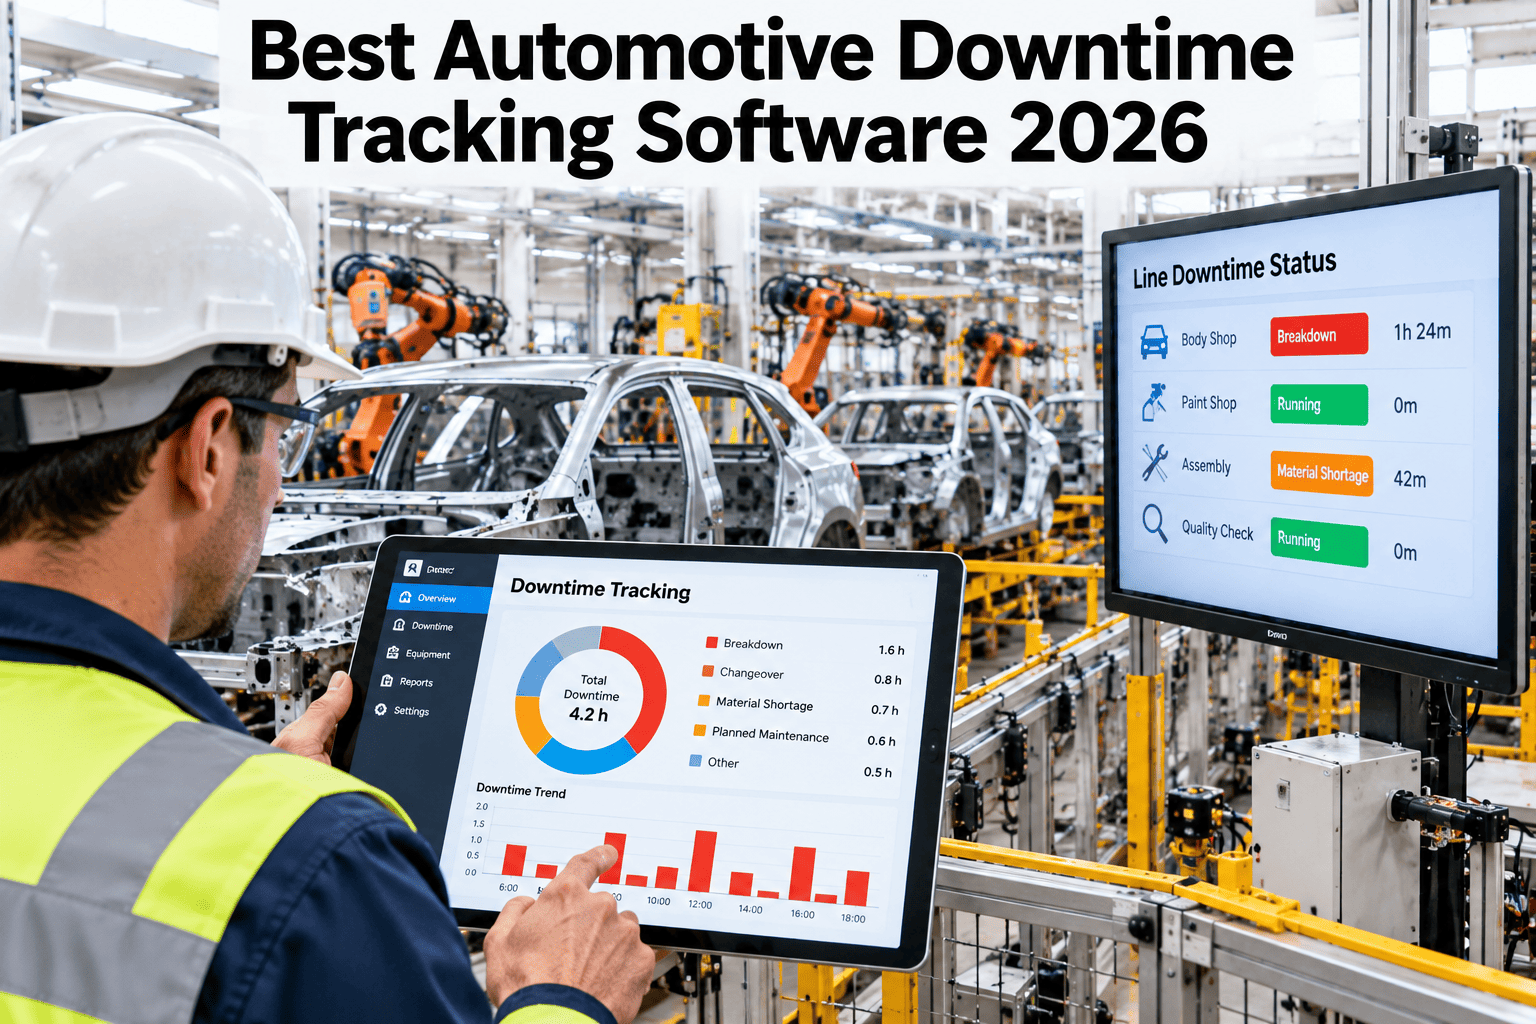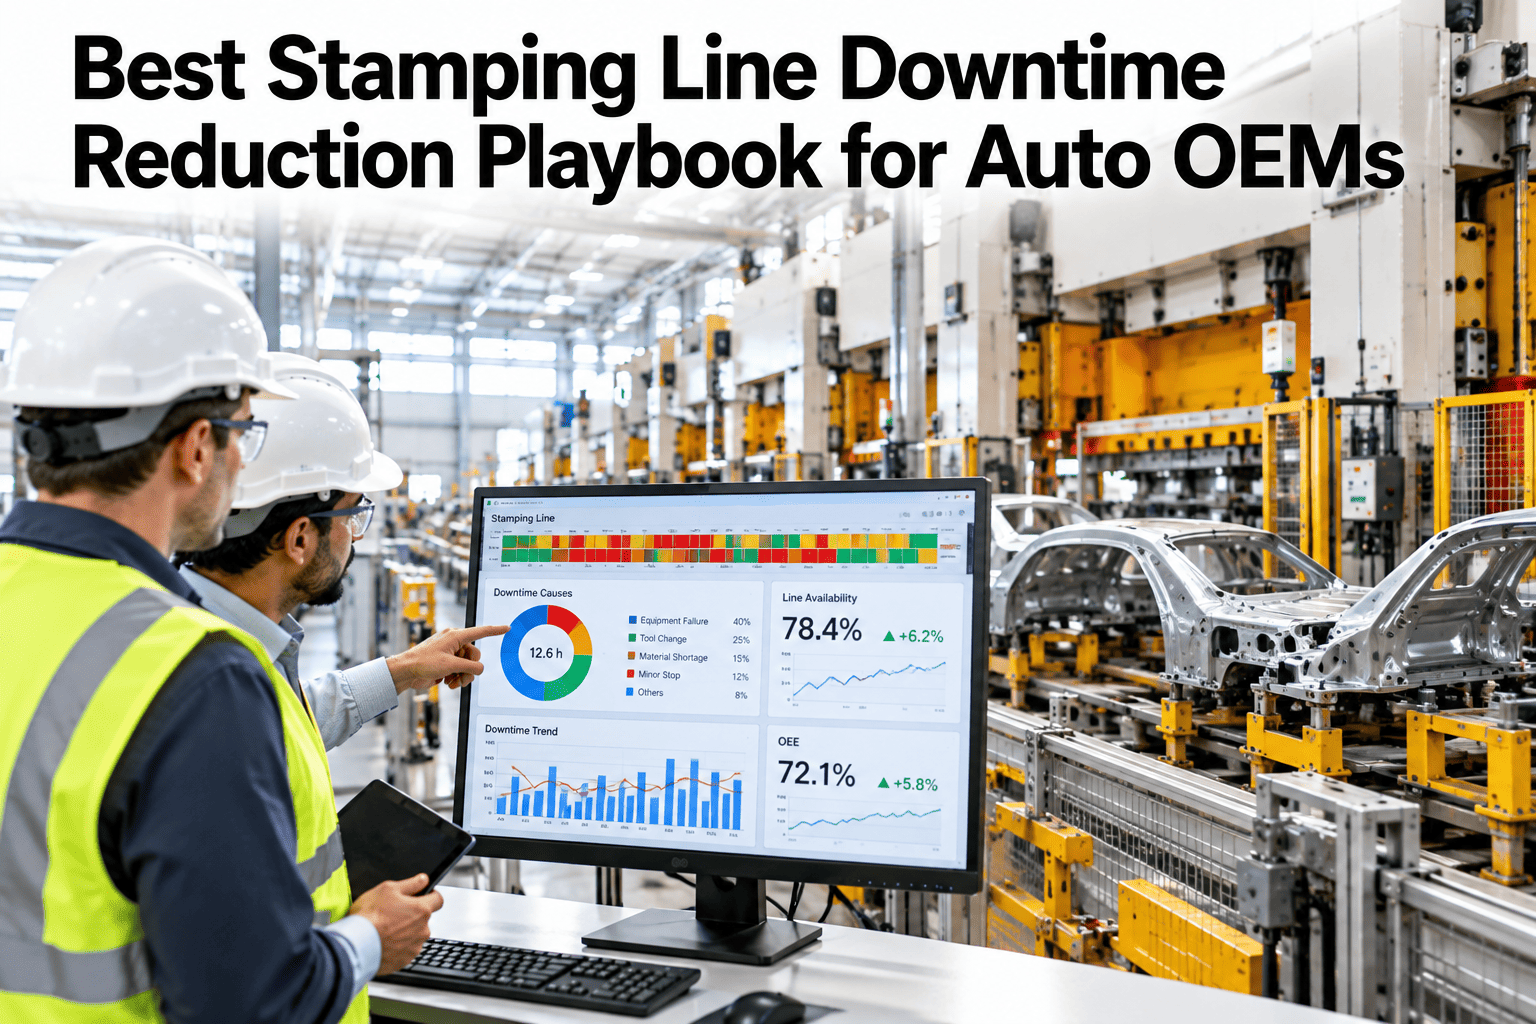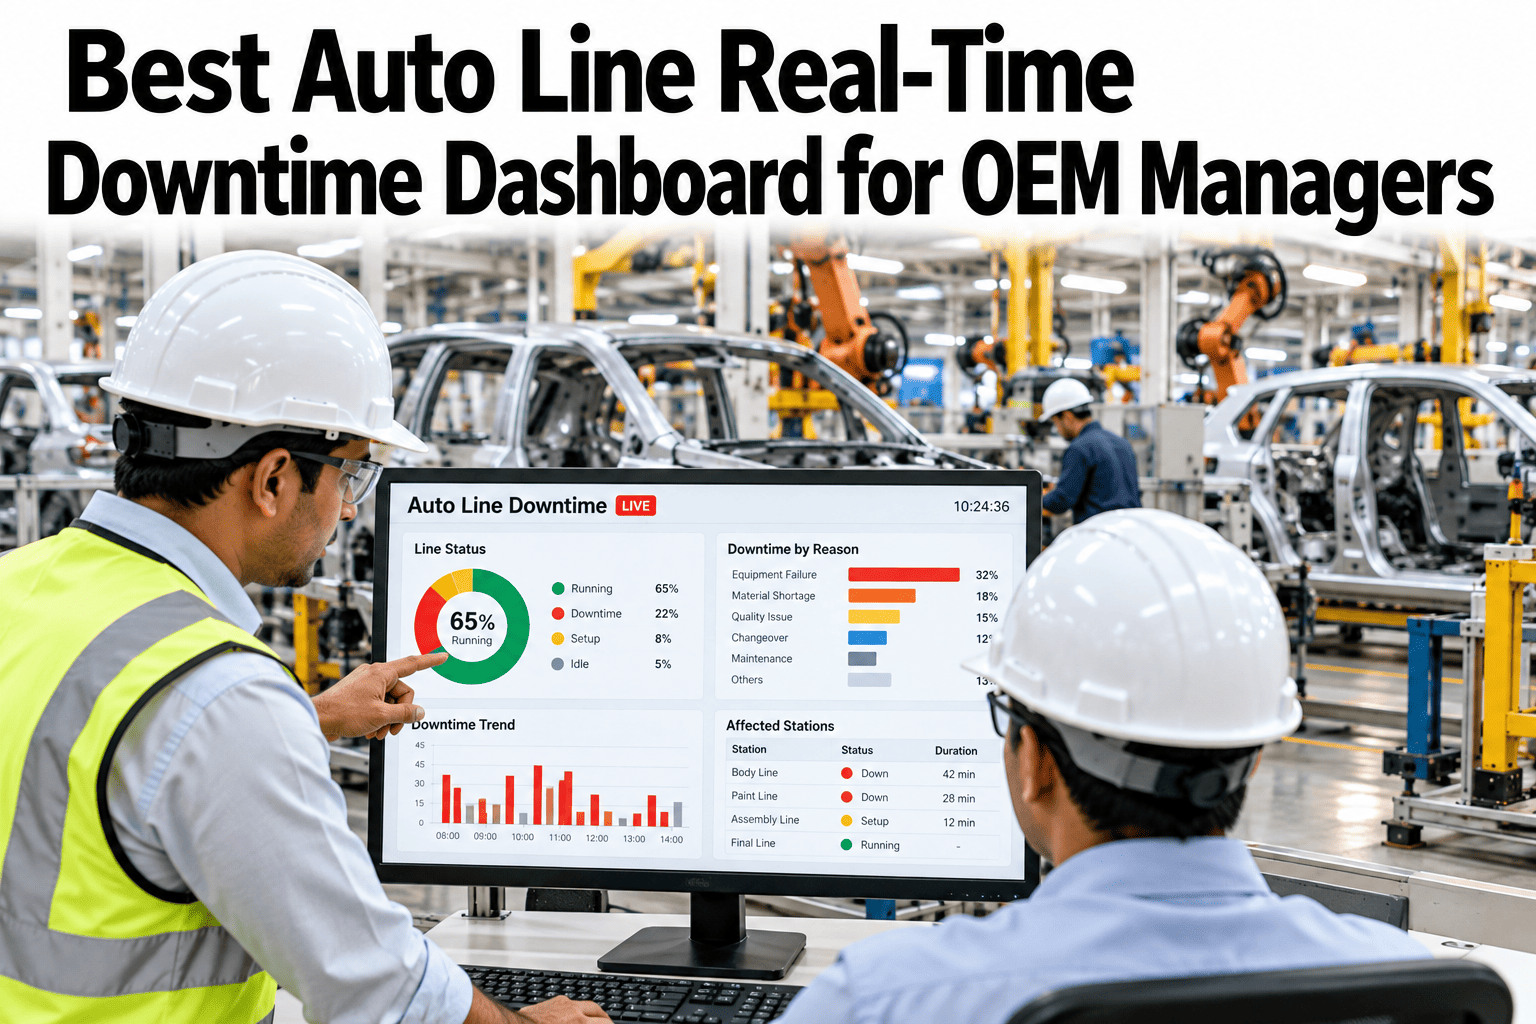
A single stopped cell-stacking line in a gigafactory can cost more per hour than most plants spend in a week, yet many battery assembly teams still respond to downtime the same way a smaller plant would: a call to maintenance, a search for the right spare, and a wait. A real playbook tiers equipment by criticality before anything breaks, stocks spares against that tiering, and defines exactly who does what in the first five minutes of a stoppage. This checklist walks through building that playbook. OEMs ready to build their own downtime response can book a demo with the iFactory AI team.
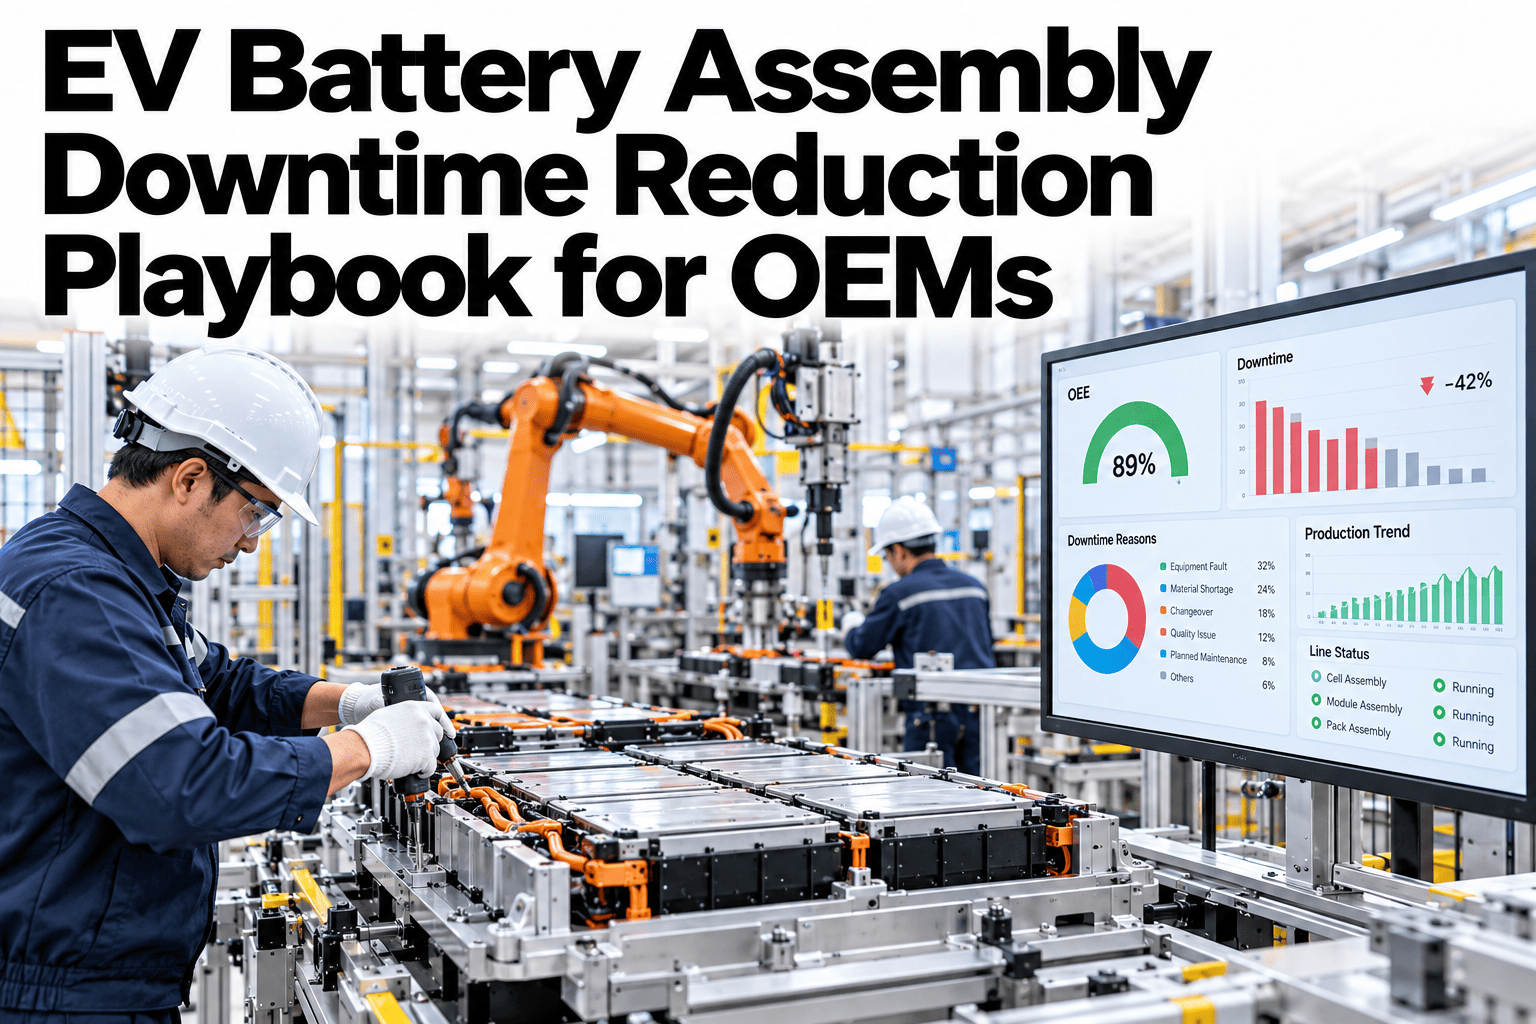
EV Battery Assembly Downtime Reduction Playbook for OEMs
Critical-equipment tiering, spare-parts strategy and rapid-response protocols that trim gigafactory downtime.
Why Gigafactory Downtime Is a Different Problem
A stopped station on a high-volume cell or module line does not just lose that station's output. It backs up or starves every station around it, multiplying the real cost far beyond the single machine's hourly rate.
A playbook built for a conventional plant rarely accounts for that multiplier, which is why gigafactory downtime response needs its own tiering and its own rules.
Checklist: Critical-Equipment Tiering
Tiering ranks equipment by what a stoppage actually costs, not by how expensive the machine was to buy.
| Tier | Definition | Response Target |
|---|---|---|
| Tier 1 | Single point of failure, stops the whole line | Minutes, not hours |
| Tier 2 | Redundant path exists, but capacity drops sharply | Same shift |
| Tier 3 | Isolated impact, output loss is contained | Next scheduled window |
Checklist: Spare-Parts Strategy by Tier
Spare-parts stocking should follow the tiering directly, so the parts most likely to stop the whole line are the ones sitting closest at hand.
Stop Losing Hours to a Part That Should Have Been on the Shelf
Book a 30-minute walkthrough and see your own equipment tiered, spares matched, and response roles assigned.
Checklist: The First Five Minutes
A rapid-response protocol defines exactly what happens the moment a Tier 1 asset stops, before anyone has to think about it under pressure.
A Sample Response, Illustrative
The figures below are invented to show the shape of a response record, not to benchmark your gigafactory.
Checklist: Common Playbook Gaps
The same gaps repeat across OEMs building their first formal downtime playbook.
Frequently Asked Questions
How do we identify which equipment is actually Tier 1?
Tier 1 status comes from downtime cost and line dependency, not equipment price, so the first step is mapping which stations have no redundant path and would stop the entire line if they failed. Book a demo to map your own Tier 1 equipment.
Does this require a large upfront spare-parts investment?
Not necessarily. Tiering often reveals that spares are over-stocked for low-impact equipment and under-stocked for Tier 1 assets, so rebalancing existing inventory can fund much of the improvement.
How is response time actually tracked?
Response time is measured from the stoppage event to the line returning to normal output, broken into dispatch, diagnosis and repair stages so each stage can be improved separately.
Does this connect to our existing CMMS and spare-parts inventory?
In most cases, yes. iFactory AI reads from existing CMMS and inventory systems to build tiering and track response time without requiring a separate system. Ask support which systems connect.
Turn Downtime Response Into a Rehearsed Playbook
iFactory AI tiers your equipment, matches spares to risk, and tracks every response against a clear target. Book a walkthrough built around your gigafactory.