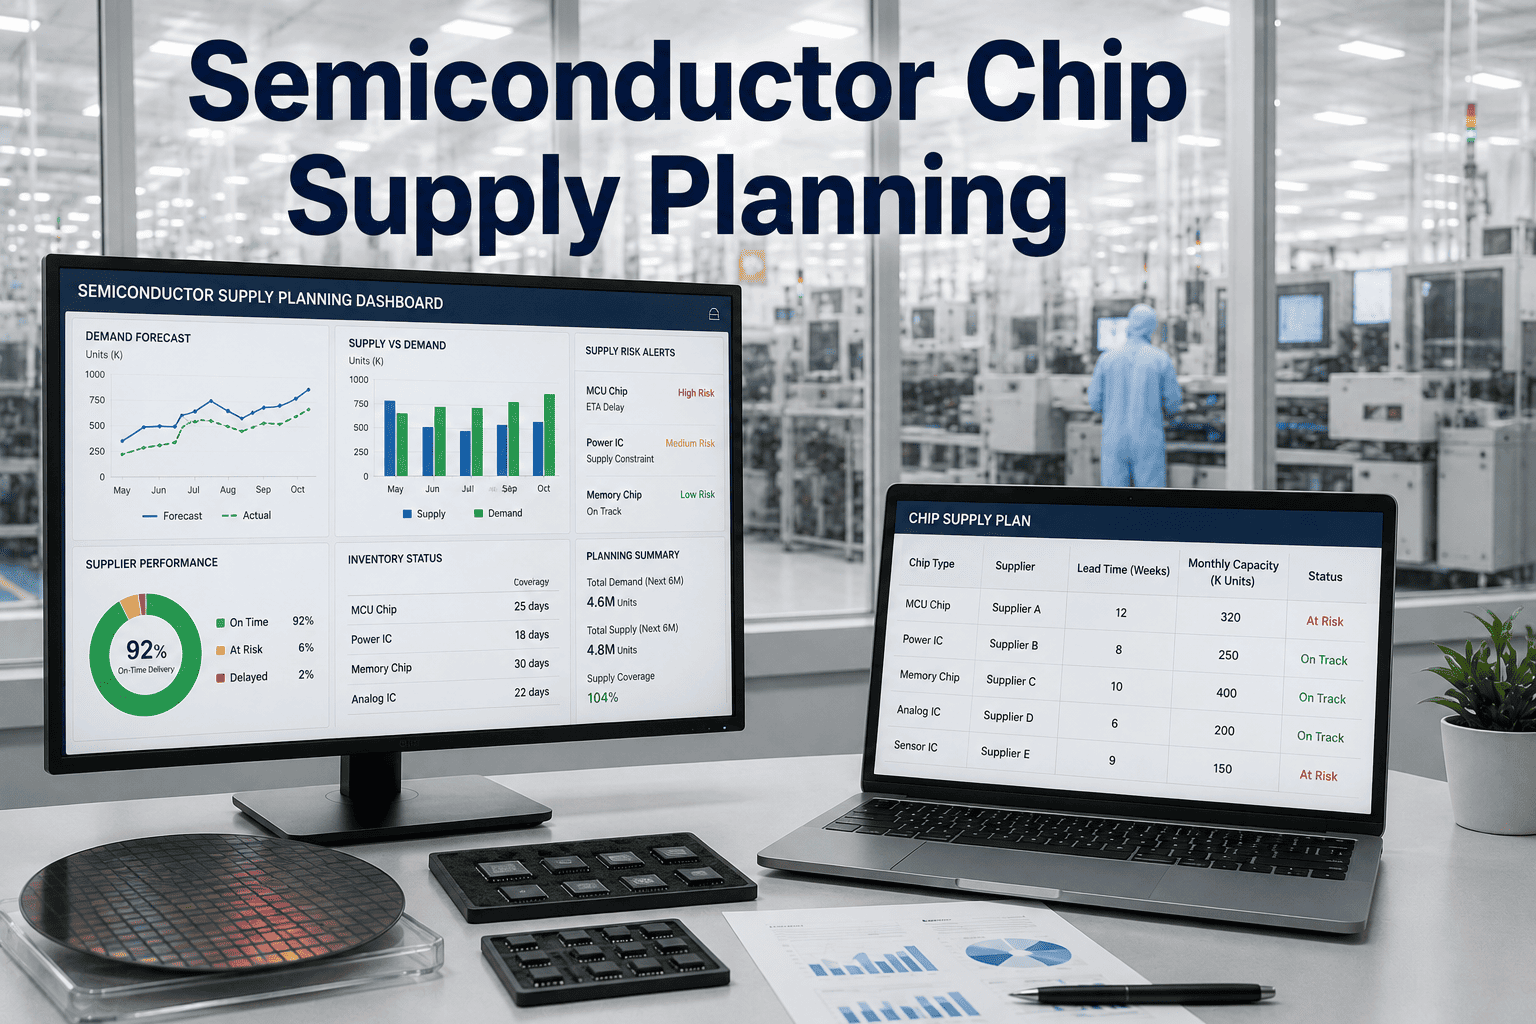
In October 2021, a single 28nm microcontroller used in body control modules — priced at $0.38 — was responsible for halting production of vehicles worth $47,000 each at plants across three continents. The chip had a 52-week lead time. The shortage had been signalled in wafer allocation data six months earlier. Nobody in the vehicle program's supply chain saw that signal, because nobody was watching wafer allocation data. They were watching their Tier-1 order confirmations, which showed green until they didn't. The lesson that every automotive chip supply lead took from 2020 to 2022 is not that chip shortages are unpredictable — it is that the signals exist much further upstream than the purchase order, and the only way to see them in time to act is to build a monitoring architecture that reaches past the distributor into the fab capacity layer. Book a session with the iFactory semiconductor supply planning team to see how AI brings that upstream visibility to your chip supply programme.
Semiconductor Chip Supply Planning with AI: Early Shortage Signals, BOM-to-Build Impact, and Allocation Scenario Intelligence for Automotive
A Chip Supply Lead's reference for AI-driven semiconductor supply planning — covering multi-tier signal harvesting, shortage probability modelling, allocation scenario analysis, and the early action triggers that protect vehicle build plans when chip availability deteriorates.
52+ wk
Average lead time for automotive-grade semiconductors — decisions made today ship next year
6 mo
Average upstream signal lead time before a shortage reaches purchase order visibility
$2M+
Lost revenue per hour of assembly plant downtime on a high-volume vehicle programme
200+
Unique semiconductor part numbers in a typical modern vehicle BOM
Why Purchase Order Confirmations Are the Last Place a Shortage Appears — and the Only Place Most Teams Are Watching
A semiconductor shortage does not begin at the purchase order. It begins at the wafer fab — when total demand across all customers exceeds available wafer starts at a given process node, and the fab begins rationing capacity. By the time that rationing propagates through the supply chain — fab to OSAT to distributor to Tier-1 to OEM — it has typically taken 12 to 26 weeks. At each step, the visibility available to the next tier is filtered, delayed, and commercially shaped. The OEM sees an allocation cut. The Tier-1 knew about it 4 weeks earlier. The distributor knew 8 weeks before that. The fab knew 6 months before anyone downstream. AI semiconductor supply planning is the architecture that moves OEM visibility from the last link in that chain to something approaching the first.
Signal Harvesting Architecture
The Six Upstream Data Signals That Predict Automotive Chip Shortages 12–26 Weeks Early
Upstream shortage signals are not hidden — they are publicly available, commercially disclosed, or inferable from observable market behaviour. What makes them difficult to act on without AI is the volume, format diversity, and interpretive complexity of the signal set. No human supply team can monitor all six signal types continuously across 200+ part numbers. An AI monitoring layer does.
01
Fab Capacity Utilisation Reports
Signal lead time: 16–26 weeks
Major foundries (TSMC, Samsung, GlobalFoundries, UMC) publish quarterly capacity utilisation data. When utilisation on process nodes relevant to automotive MCUs and SoCs (28nm, 40nm, 65nm) approaches 95–100%, the probability of allocation cuts within two to four quarters rises sharply. AI monitors these publications and correlates node utilisation to the specific chip families in your BOM.
02
OSAT Booking Lead Time Trends
Signal lead time: 12–18 weeks
Outsourced Assembly and Test capacity lead times extend before a shortage reaches the finished chip level. When OSAT booking slots for a specific package type (QFP, BGA, die-on-substrate) move from 6 weeks to 16 weeks, it signals that upstream die supply is tightening and the assembly pipeline is filling. OSAT lead time trends are trackable through procurement data and industry reports.
03
Distributor Quoted Lead Time Drift
Signal lead time: 8–14 weeks
Distributor quoted lead times for the same part number across multiple distributors represent a real-time market signal for supply tightness. When Digi-Key, Mouser, and Arrow are all quoting the same MCU at 52+ weeks where they quoted 26 weeks six months ago, the signal is unambiguous. AI aggregates lead time quotes across part numbers and distributors and computes lead time trend vectors per chip family.
04
Spot Market Price Premiums
Signal lead time: 6–10 weeks
Spot market price premiums over catalogue pricing are a real-time arbitrage signal for supply-demand imbalance. When a chip trading at $0.80 catalogue appears on broker platforms at $3.20, it means someone in the supply chain is paying 4× to secure supply that the authorised channel cannot deliver. Monitoring spot price premiums per part number provides a leading indicator before authorised channel allocation cuts are announced.
05
Tier-1 Order Pattern Anomalies
Signal lead time: 4–8 weeks
Tier-1 suppliers modify their ordering patterns when they anticipate supply constraints — pulling orders forward, doubling blanket quantities, or placing safety stock orders outside the normal call-off cycle. These pattern anomalies are visible in the OEM's supply chain data even without explicit communication from the Tier-1. AI flags unusual ordering behaviour per supplier per part number as a constraint probability signal.
06
Fab Force Majeure and Geopolitical Events
Signal lead time: 0–2 weeks (immediate)
Natural disasters affecting fab-dense regions (Taiwan, South Korea, Japan, Arizona), power events, water supply restrictions, and geopolitical developments affecting cross-strait technology flows all represent immediate-onset supply risks. AI maintains a real-time event monitoring layer that maps geographic events to the specific fabs and process nodes in your supply network and calculates BOM exposure within hours of an event.
Portfolio Risk Visibility
Chip Supply Risk Across Your BOM — At a Glance
The heatmap below represents the kind of portfolio-level risk view AI generates across a vehicle programme's semiconductor BOM — scored by shortage probability and build plan impact. The two dimensions that define action priority: how likely is a shortage, and how much does it cost per day if it happens?
Body MCU (28nm) appears in the highest-risk quadrant: shortage probability above 70% and direct build plan impact across 4 vehicle programmes. This is the chip that gets a dedicated mitigation project, not a weekly monitoring report.
BOM-to-Build Impact Engine
Translating a Chip Shortage Into a Build Plan Number — Automatically, Across Every Programme
The question that every chip shortage triggers — "how many vehicles does this affect and when?" — is answered in automotive supply chains by a manual process that typically takes 2 to 5 days, involves cross-functional teams from supply chain, programme management, and manufacturing, and produces an answer that is already partially stale by the time it reaches the production planning meeting. An AI BOM-to-build impact engine answers that question in minutes.
01
BOM Mapping — Chip to Vehicle to Plant
Every semiconductor part number in the supply database is mapped to the ECU or module it populates, the vehicle programmes that use that module, and the assembly plants whose build plans depend on those programmes. This three-tier mapping is maintained continuously as new programme variants are added and module content changes. When a chip is flagged as at-risk, the impact map is already built.
AI models three allocation scenarios for every at-risk chip: 60% of planned supply (severe shortage), 80% (moderate cut), and 100% with extended lead time (delayed, not cut). For each scenario, the system calculates: vehicles lost per week, revenue impact per week, which plant is affected first, and whether existing safety stock or alternative source chips cover the gap and for how long.
03
Safety Stock Runway Calculation
For each at-risk chip, the system calculates the safety stock runway — how many weeks of current build rate the existing pipeline (in-transit + warehouse + Tier-1 buffer) covers. A chip with a 6-week runway and a 16-week resolution timeline needs a mitigation action within the next 2 weeks to avoid a build stop. This calculation is updated daily as consumption and arrivals change.
04
Alternative Source and Second Source Mapping
For every at-risk chip, the AI queries the alternative parts database — approved second-source equivalents, compatible parts requiring firmware validation, and redesign-eligible substitutes with longer qualification lead times. The output ranks alternatives by time-to-qualify versus time-to-shortage, showing which alternatives can close the gap and which require more time than the shortage allows.
05
Allocation Optimisation Across Programmes
When total chip supply is less than total demand across multiple vehicle programmes, the allocation decision — which programme gets priority — is typically made in a manual war room. AI pre-calculates the revenue-optimal allocation that maximises contribution margin across the programme portfolio, incorporating programme profitability, model cycle position, customer commitment penalties, and contract supply obligations — giving the war room a quantified recommendation rather than a blank slate negotiation.
From 200+ Part Numbers to a Prioritised Action List
iFactory Scores Every Chip in Your BOM for Shortage Probability and Build Impact — Updated Daily
Most chip supply teams spend their week reacting to shortage notifications that arrived 72 hours ago. iFactory's AI monitoring layer generates a daily ranked action list — the 5 chips that need a mitigation decision this week, the 12 entering the watch list, and the 180 that are stable — so the team's attention goes where it creates the most value.
What to Do When the AI Signals a Risk — and When to Do It
The value of early supply signal detection is only realised if it triggers timely action. A shortage signal at T+4 weeks (versus T+20 weeks for traditional visibility) creates a 16-week window for mitigation actions that would be impossible later. The trigger framework below maps signal strength to the correct action at each threshold — preventing both under-reaction to real risks and over-reaction to noise.
Risk Signal Level
AI Score
Earliest Action
Supply Action
Engineering Action
Watch
20–40%
Increase monitoring frequency; request supply confirmation from Tier-1
Verify safety stock levels; confirm supplier order coverage
Accelerate second-source validation; brief programme chief on substitution timeline
Severe
>85%
Activate cross-functional war room; notify customers of potential delivery risk
Execute allocation optimisation model; negotiate allocation at exec level with chip supplier
All-hands on second source; evaluate temporary design workaround if qualification time allows
Supply Programme KPIs
Six Metrics That Define Chip Supply Planning Maturity
Mean Warning Lead Time
Target: >12 weeks
Average weeks between AI shortage signal and first allocation cut received. The primary measure of supply planning system effectiveness. Every week of additional warning time is worth approximately one additional mitigation option — at 12 weeks, most supply and engineering options are still available. At 4 weeks or less, only spot market and allocation negotiation remain.
BOM Risk Coverage
Target: 100%
Percentage of unique semiconductor part numbers in active programme BOMs that are monitored by the AI risk scoring system. Any unmonitored chip is a known blind spot. BOM coverage is the foundational metric — without 100% coverage, the system cannot guarantee that the next shortage will be caught upstream.
Safety Stock Runway
Target: ≥8 weeks
Average weeks of buffer inventory coverage for chips in the critical and severe risk tiers. Measured as: (on-hand + in-transit + confirmed Tier-1 buffer) ÷ weekly consumption rate. An 8-week runway for critical-tier chips provides time for at least one round of spot market sourcing or allocation escalation before production impact.
Single-Source Exposure %
Target: <15%
Percentage of programme BOM chip count sourced exclusively from a single manufacturer with no qualified alternative. Single-source chips with no second-source option are the highest-consequence supply risks — a shortage cannot be mitigated without a design change. Reducing this percentage through second-source qualification is the highest-leverage long-term resilience action.
Shortage-Driven Production Loss
Target: 0 vehicles
Vehicles not produced in the period due to semiconductor supply constraints, after all mitigation actions have been exhausted. The ultimate outcome metric. Any non-zero value represents a failure of the early warning and mitigation system — the shortage reached the build plan before a countermeasure was in place.
Signal-to-Action Cycle Time
Target: <48 hours
Time elapsed between an AI risk signal reaching the critical threshold and a documented mitigation action being authorised. Even with excellent early warning, value is only created when the organisation acts on the signal quickly. Approval cycle times above 72 hours for critical-tier chips indicate a governance problem that erodes the value of the detection system.
From the Supply Chain Floor
“
The fundamental problem with automotive semiconductor supply management before 2020 was that the industry had built a just-in-time supply model — designed for components with 4 to 8 week lead times — and applied it to components with 52 week lead times. It was not a failure of effort or attention. The chip supply managers I worked with were competent and diligent. The system they operated in structurally could not see far enough upstream to give them enough time to act. When the 2020 shortage hit, every OEM I was advising went through the same sequence: Tier-1 notification, manual BOM impact analysis, executive war room, panic buying at spot prices, and still losing production. The lesson was not that we needed to work harder. It was that we needed a monitoring architecture that extended our visibility from the Tier-1 back to the wafer fab. That is an AI problem, not a procurement problem — because no team of people can monitor wafer fab utilisation, OSAT booking data, distributor lead time vectors, and spot price premiums across 200 part numbers continuously. That is a data problem of a scale that requires automated signal processing. What changed my thinking was when I first saw an AI system flag a body MCU shortage risk at the fab capacity utilisation signal, 22 weeks before the allocation cut arrived. That is the only kind of lead time that actually creates options.
Takuma Nishida
Automotive Supply Chain Director · 22 years in semiconductor procurement and supply risk management across Japanese and European OEMs · Former VP Supply Chain at a Tier-1 automotive electronics manufacturer · Advisor on semiconductor resilience strategy to three automotive OEMs post-2022
How is AI semiconductor supply planning different from what our existing supply chain system already does?
Most automotive ERP and supply chain systems monitor the authorised supply chain — Tier-1 order confirmations, warehouse inventory, and in-transit shipments. They are excellent at managing what is already flowing. What they cannot do is monitor the conditions that determine what will flow in 12 to 26 weeks — wafer fab utilisation, OSAT booking lead times, distributor lead time drift, and spot market price premiums. These upstream signals exist entirely outside the ERP boundary. AI supply planning sits upstream of the ERP, harvesting and interpreting signals from the semiconductor supply network before they become purchase order events, and feeding risk-ranked action items into the supply team's workflow in time to act on them. The ERP sees today's supply. The AI sees next quarter's constraints. For a demonstration of how iFactory's upstream monitoring layer connects to your existing supply chain data, book a session with our automotive supply team.
With 200+ chip part numbers in a vehicle BOM, how does the AI prioritise which risks to surface to the supply team first?
Prioritisation is computed on two axes: shortage probability and build plan impact. Shortage probability is a composite score derived from the six upstream signal types — fab utilisation, OSAT lead times, distributor lead time drift, spot price premiums, Tier-1 order anomalies, and event monitoring — weighted by signal recency and signal agreement. Build plan impact is calculated from the BOM-to-build mapping: a chip used in 4 vehicle programmes across 3 plants has a higher impact weight than a chip used in one low-volume variant. The product of these two scores ranks every chip in the BOM daily, and the supply team's morning briefing surfaces the top 5 to 10 chips requiring a decision within the current week — not a list of 200 items with equal weight. The system also flags which chips have moved up the ranking since the previous briefing, highlighting acceleration of risk rather than requiring the team to compare two lists manually. For a walkthrough of the scoring methodology against your specific BOM, contact the iFactory support team.
How does the platform handle geopolitical risk specific to Taiwan Strait semiconductor exposure?
Taiwan-exposed supply risk is modelled at two levels. At the part number level, every chip in the BOM is mapped to its manufacturing origin — fab location, process node, and foundry — which quantifies the Taiwan-specific exposure of each programme's semiconductor content. At the scenario level, the platform maintains pre-built scenario models for Taiwan Strait disruption events of varying severity and duration, each producing a programme-specific impact estimate: how many vehicles are affected, how long safety stock covers demand, and which chips have alternative sources outside Taiwan that can be qualified within the scenario resolution window. The scenario output is updated quarterly as BOM content changes and as second-source qualification progress changes the exposure profile. For an automotive programme with significant 28nm content at TSMC, the Taiwan exposure analysis is typically the most important output of the first platform session.
What data does iFactory need to start providing chip supply risk visibility, and how long does onboarding take?
The minimum viable dataset for initial risk visibility is: the semiconductor BOM (part numbers, quantities per vehicle, and supplier identification) for each active vehicle programme, current safety stock levels by part number, and Tier-1 supplier assignment by part. iFactory connects this internal data to the upstream signal monitoring layer — which draws from public fab reports, distributor lead time APIs, and market pricing data — without requiring proprietary data access to Tier-1 or chip supplier systems. Most programmes achieve an initial risk briefing within 5 to 10 business days of data submission. Full scenario modelling capability, which requires deeper BOM-to-plant mapping and safety stock pipeline visibility, typically reaches operational maturity within 4 to 6 weeks. Book a scoping session to review your data readiness and expected onboarding timeline.
How does the platform help with allocation decisions when supply is genuinely constrained across multiple programmes?
When total chip supply is less than total demand across a programme portfolio, the allocation decision — which vehicle gets the available chips — has major financial and customer relationship consequences. Most OEMs make this decision in a manual war room that runs for days and produces a result that is driven as much by organisational dynamics as by financial analysis. iFactory's allocation optimisation module pre-calculates the contribution-margin-maximising allocation across all affected programmes, incorporating programme profitability, model cycle stage, customer delivery commitment penalties, and contractual supply obligations. The output is a ranked programme priority list with the financial justification for each ranking decision — giving the war room a quantified starting point rather than a blank-slate negotiation. The team retains final decision authority; the AI provides the financial analysis that prevents the most costly allocation mistakes. Reach out to our support team to discuss how the allocation optimiser would be configured for your programme portfolio.
The Next Chip Shortage Is Being Signalled Right Now — Upstream
Move Your Visibility from the Purchase Order to the Wafer Fab — Before the Next Allocation Cut Arrives
iFactory's semiconductor supply planning module monitors upstream shortage signals across your full BOM, scores every chip by shortage probability and build plan impact, models allocation scenarios before they become production crises, and delivers a daily prioritised action list to the chip supply team. The system is operational within days, not months — because the signals are already there. You just need to be watching them.