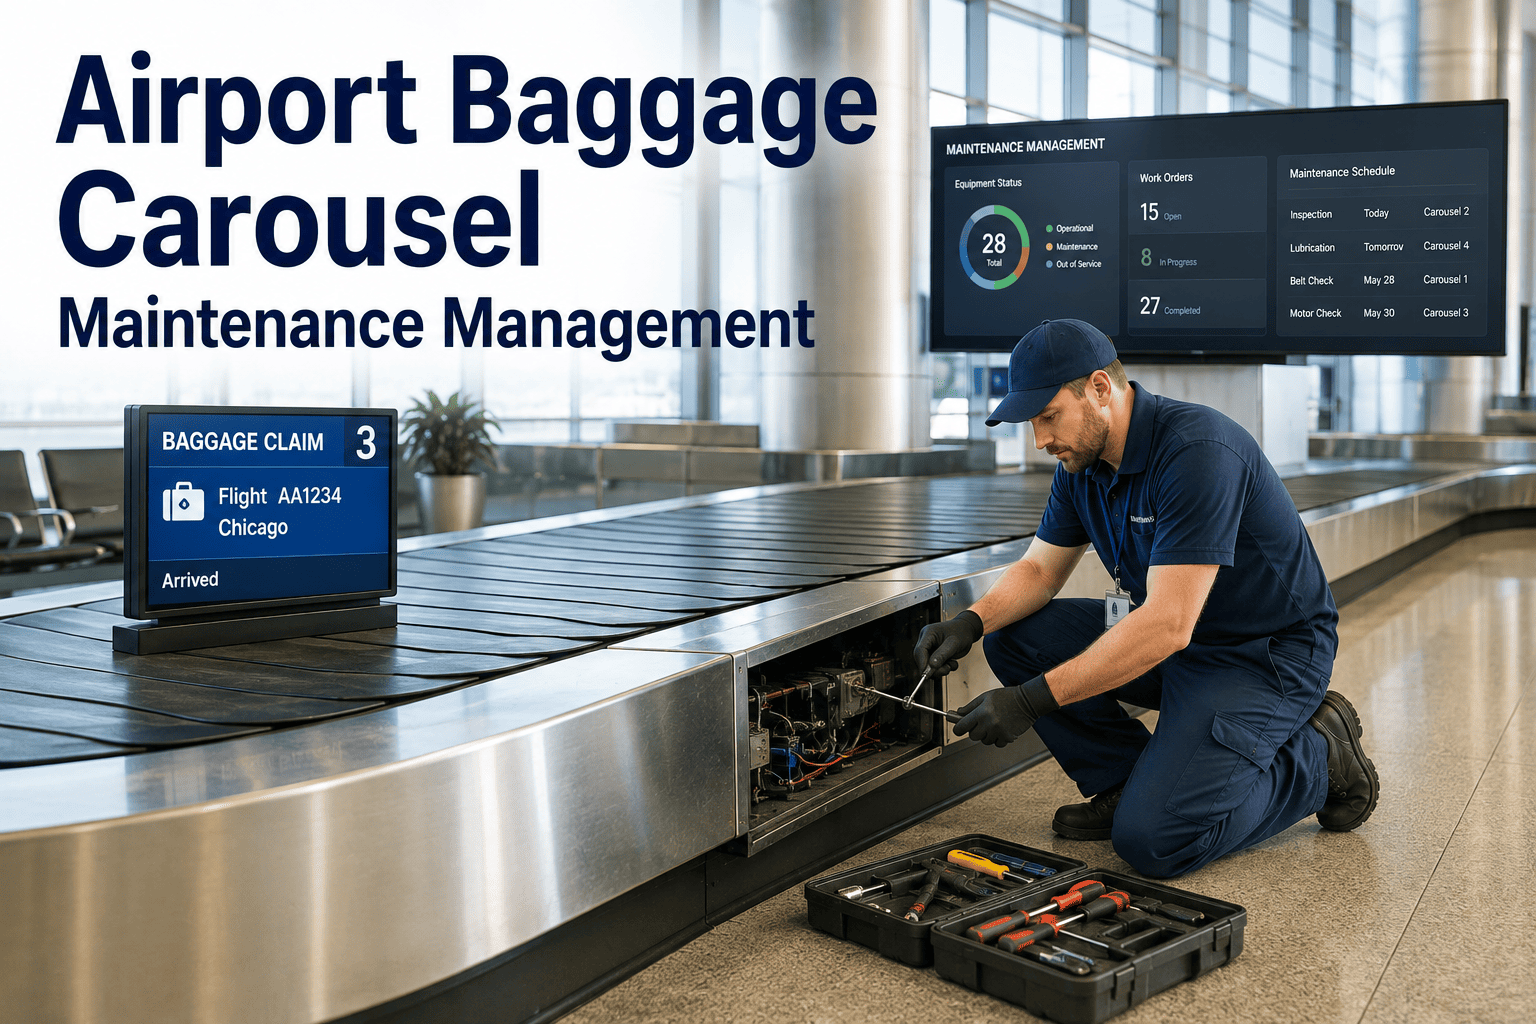
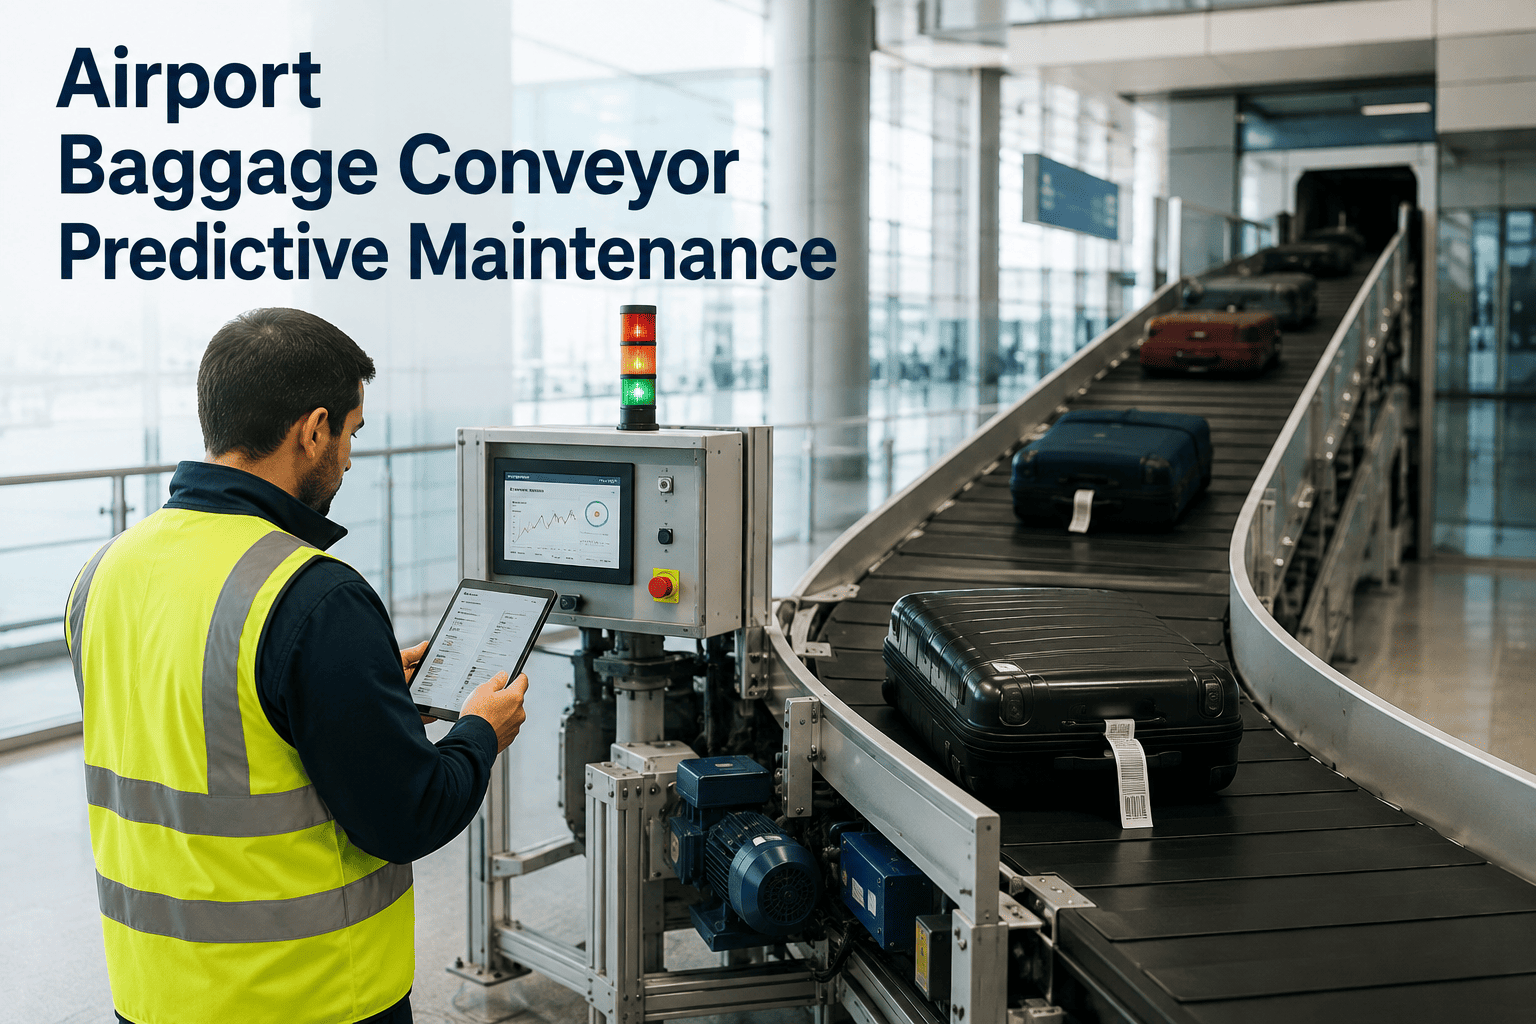
Every baggage carousel at a major airport handles between three thousand and eight thousand bags on a typical peak day, and the moment the drive motor stumbles or a tracking sensor fouls, those bags stop moving while passengers crowd the claim area and gate agents start calculating delay minutes. Most airports still manage carousel maintenance through a mix of operator walkaround checks, OEM-recommended service intervals, and reactive work orders that open only after a unit has already gone down, which means the same failure modes repeat across terminals because the underlying data never gets structured in a way that drives prevention. iFactory centralizes every inspection finding, fault alert, work order, and parts replacement for each carousel into a single asset record so your maintenance team can see what is failing, how often, and what the actual resolution was, and you can book a demo to see how your own carousel fleet data would look inside the platform.
BAGGAGE SYSTEM RELIABILITY · CAROUSEL MAINTENANCE · AIRPORT CMMS
Your Baggage Carousels Have Six Subsystems That Fail in Predictable Patterns
Each carousel is a system of interconnected mechanical, electrical, and control components. A structured maintenance program tracks every subsystem independently rather than treating the carousel as a single asset that either works or does not.
Junction and Merge Points
THE OPERATIONAL COST OF A CAROUSEL STOP
What Happens Every Minute a Baggage Carousel Is Not Moving
When a carousel stops during a bag pull, the cost does not start with the repair bill. It starts with the first passenger who reaches an empty carousel and ends hours later when the last rebooked connection is resolved. The expense breaks down into categories that most maintenance teams can quantify individually but rarely stack together when making the case for a structured maintenance program.
Passenger Wait Time and Complaint Volume
42%
Manual Bag Sorting and Redelivery Labor
28%
Airline Carrier Delay Penalty Clauses
16%
Emergency Repair and Overtime Labor Premium
9%
Regulatory and Audit Compliance Risk Exposure
5%
The repair cost of replacing a seized roller or cleaning a fouled photo-eye sensor is typically a few hundred dollars in parts and an hour of labor. The operational cost of the carousel being down during a narrow bag-pull window can easily reach tens of thousands of dollars. A maintenance management program that prevents even one peak-hour stop per carousel per quarter pays for itself several times over in avoided operational disruption alone, before counting the reduction in emergency repair premiums and parts waste from deferred component replacement.
COMPONENT FAILURE PROFILE
Six Subsystems That Cause the Majority of Unplanned Carousel Stops
Analysis of baggage carousel work order data across multiple airports consistently shows that unplanned stops cluster around a small number of subsystem failure modes. The issue is not that these failures are mysterious or unpredictable. The issue is that inspection routines are not structured to catch the early indicators specific to each subsystem, so the same failures repeat on the same units while the maintenance team reacts to each one as if it were a surprise.
Drive Motor and Gearbox
Bearing wear in the drive motor and gearbox produces increasing vibration and elevated winding temperatures over weeks before a functional failure occurs. Walkaround inspections rarely detect this because the change is gradual and the unit continues to operate. When the bearing finally seizes or the motor trips on over-temperature, the carousel stops immediately and the repair typically requires a motor pull, bearing replacement, and realignment that takes four to eight hours if parts are in stock.
Typical Detection Gap
6-8 Weeks
Photo-Eye and Proximity Sensors
Carousel sensors operate in a harsh environment with constant dust, baggage tag fragments, and moisture from weather-exposed make-up air units. Sensor lenses accumulate contamination that reduces effective range, causing intermittent false triggers or missed detections that the PLC interprets as jams and stops the carousel to protect the system. Technicians often clean sensors during scheduled PMs but do not track which sensors are failing more frequently, so high-failure units do not get prioritized for replacement or protective housing upgrades.
Typical Detection Gap
2-4 Weeks
Conveyor Belt Tracking and Splice Condition
Belt misalignment develops gradually as rollers wear unevenly or the take-up tension mechanism loses adjustment range. A mistracking belt rubs against the frame, causing edge fraying and eventually splice failure that can dump an entire section of bags onto the floor. Visual inspections catch obvious misalignment but do not quantify the rate of drift, so maintenance cannot distinguish between a slow trend that needs a scheduled correction and a sudden shift that needs immediate attention.
Typical Detection Gap
3-5 Weeks
Roller Assembly Condition
Individual carrier rollers seize progressively as their internal bearings fail, creating flat spots that increase belt tension and motor load across the entire carousel. A single seized roller increases energy consumption and accelerates belt wear, but the carousel continues to run so the fault is not treated as urgent. Over time, multiple seized rollers compound the load until the drive motor trips on over-current or the belt tension exceeds the take-up range and the belt jumps the tracking.
Typical Detection Gap
4-8 Weeks
Junction and Merge Point Transfers
Where feed conveyors merge onto the main carousel loop, transfer plates and divert mechanisms experience high impact loads from bags arriving at varying speeds and angles. Transfer plate wear, diverter misalignment, and speed synchronization drift between the feed conveyor and carousel all cause bag jams that the control system interprets as blockages and stops the affected section. These failures are highly sensitive to bag volume and mix, which means they may not appear during off-peak testing but fail consistently during high-volume operations.
Typical Detection Gap
1-3 Weeks
PLC and Control Panel Components
PLC I/O modules, relay contacts, and communication networks that connect the carousel to the broader baggage handling system generally fail less frequently than mechanical components but produce more disruptive failures when they do, because they can affect multiple carousels or an entire terminal section simultaneously. Intermittent communication faults are particularly difficult to diagnose during routine inspections because they may not be present when the technician is physically at the panel, requiring continuous monitoring or event logging to capture.
Typical Detection Gap
1-2 Weeks
BEFORE AND AFTER
The Operational Difference Between Managed and Unmanaged Carousel Maintenance
The gap between an airport that manages carousel maintenance reactively and one that manages it through a structured, data-driven program shows up in a small number of metrics that directly affect passenger experience and operating cost. The numbers below represent typical improvements observed after transitioning from unmanaged reactive maintenance to a centralized platform-driven program over a twelve-month period.
Unplanned Stops Per Month
8.3
Mean Time to Repair
4.2 Hours
PM Schedule Compliance
61%
Avg Bag Delivery Delay
18 Min
Emergency Parts Orders
34% of Total
Unplanned Stops Per Month
1.7
Mean Time to Repair
1.4 Hours
PM Schedule Compliance
94%
Avg Bag Delivery Delay
7 Min
Emergency Parts Orders
8% of Total
The reduction in mean time to repair comes not from faster technicians but from better information. When a work order includes the specific fault code, the affected subsystem, the relevant parts history for that carousel, and the procedures used on the last similar repair, the technician arrives on-site with context rather than starting from zero. The reduction in emergency parts orders comes from the platform identifying which replacement parts are consumed most frequently and ensuring they are stocked at the appropriate par level before the next failure occurs.
See Every Carousel in Your Terminal Ranked by Maintenance Risk
iFactory builds a living asset record for each carousel, pulls in fault data from your BHS controls, and surfaces which units are drifting toward failure before the next peak cycle. Book a demo and bring your last quarter of carousel work orders.
THE MAINTENANCE WORKFLOW
From Fault Detection to Verified Resolution in Six Connected Steps
A structured maintenance program replaces the fragmented sequence of phone calls, paper logs, and spreadsheet trackers with a single workflow that connects every step from the initial fault signal through to post-repair verification. Each step generates data that feeds the next, so the program gets more effective over time rather than remaining dependent on individual technician knowledge and memory.
01
Fault or Condition Alert Received
A PLC fault code, operator observation, or condition monitoring threshold breach is logged against the specific carousel asset record with a timestamp and source identifier, creating a single entry point for every potential issue regardless of how it was detected.
02
Work Order Auto-Generated with Asset Context
The platform creates a work order pre-populated with the carousel identifier, affected subsystem, fault description, relevant parts history, and any similar past repairs on the same unit, eliminating the manual data entry that causes delays and transcription errors in the reactive model.
03
Prioritized by Operational Impact and Flight Schedule
Work orders are ranked by how many passengers and flights are affected, how close the next peak bag-pull window is, and whether a redundant carousel can absorb the load, so the maintenance team always works on the highest-impact issue first rather than responding in arrival order.
04
Scheduled, Assigned, and Parts Reserved
The work order is assigned to the appropriate shift, contractor, or technician based on skill requirements and availability, and required parts are checked against inventory with automatic requisition if stock is below par level, ensuring the technician has everything needed before arriving at the carousel.
05
Maintenance Executed and Findings Documented
The technician completes the work, records actual findings, parts used, time spent, and any additional issues discovered during the repair, building a detailed history that makes future diagnosis faster and more accurate for every subsequent work order on that carousel.
06
Post-Repair Verification and KPI Updated
The carousel is run through a verification cycle to confirm the fault is resolved, the work order is closed with actual resolution data, and the platform updates all relevant KPIs including MTTR, subsystem failure frequency, and PM compliance for that asset.
PERFORMANCE TRACKING
Five KPIs That Prove the Maintenance Program Is Working
Any maintenance program needs measurable outcomes that are visible to both the maintenance team and airport operations leadership. The following five KPIs provide a balanced view of carousel reliability, maintenance efficiency, and passenger service impact, each tracked per carousel, per terminal, and across the entire airport fleet within the iFactory dashboard.
Mean Time Between Failures
2,400 hrs
Target: 4,000 hrs
60% of Target
PM Completion Rate
94%
Target: 98%
96% of Target
First-Bag Delivery Compliance
87%
Target: 95%
92% of Target
Work Order Backlog Over 7 Days
4 Orders
Target: 0 Orders
Significant Gap
Parts Availability at Time of Repair
89%
Target: 95%
94% of Target
FREQUENTLY ASKED QUESTIONS
Questions Airport Maintenance Teams Ask Before Getting Started
Can iFactory connect to our existing baggage handling system SCADA to pull fault codes automatically, or do our technicians need to enter everything manually?
The platform integrates with major BHS SCADA systems through standard industrial protocols and data export formats, so fault codes, motor run hours, stop events, and sensor status can be pulled automatically without manual entry. Where a direct SCADA integration is not immediately available, technicians can log findings through a mobile interface that takes seconds per entry, and the platform still builds the same structured asset history from that input.
Book a demo to discuss integration options for your specific BHS controls platform.
Our carousel maintenance is split between in-house staff and two different contractors depending on the terminal. Can one platform handle that complexity?
The platform assigns work orders to specific teams, contractors, or individuals based on rules you define, so Terminal A carousel work goes to Contractor One and Terminal B goes to in-house staff without any manual routing. Each assigned party sees only their queue, but management sees the full picture across all teams with consistent data structure and KPI reporting regardless of who performed the work.
Contact our support team to discuss multi-contractor configuration for your terminal layout.
Our carousels are from three different OEMs installed across different construction phases. Does the platform handle mixed fleets with different component configurations?
Each carousel is set up as an individual asset with its own subsystem structure, parts list, PM schedule, and failure history, so a Unitel carousel in Terminal 1 and a Vanderlande carousel in Terminal 3 are tracked with their specific component configurations rather than forced into a generic template. The fleet dashboard normalizes KPIs across all units regardless of OEM so you can compare reliability performance on a level playing field.
Book a demo to see how mixed-OEM fleets are structured in the platform.
How quickly after deployment will we start seeing a measurable reduction in unplanned carousel stops?
The fastest improvement comes from eliminating the information gaps that cause delays between fault detection and repair, which typically reduces mean time to repair within the first few weeks as technicians begin receiving work orders with full asset context instead of starting diagnoses from scratch. Reductions in unplanned stop frequency take longer because they depend on the PM compliance rate improving and the failure history data accumulating enough to shift scheduling from calendar-based to condition-based, which typically shows measurable results within three to six months.
Contact our support team to discuss a realistic timeline for your carousel fleet.
Does the platform support the documentation requirements for TSA, FAA, or international aviation authority audits related to baggage system maintenance?
Every inspection, work order, parts replacement, and verification action is timestamped, attributed to a specific technician or contractor, and linked to the specific carousel asset, producing a complete audit trail that can be exported in standard formats for regulatory review. The platform does not replace your formal compliance documentation process but provides the underlying data that makes compliance reporting faster and more defensible because every entry is traceable to a source record rather than a retrospective summary.
Book a demo to see the audit trail and export capabilities in action.
Turn Your Carousel Work Order History Into a Reliability Improvement Plan
iFactory takes your existing fault data, inspection logs, and maintenance records and structures them into a fleet-level view that shows exactly where your carousel reliability is losing ground and what to fix first. Book a demo and bring your last quarter of work orders.