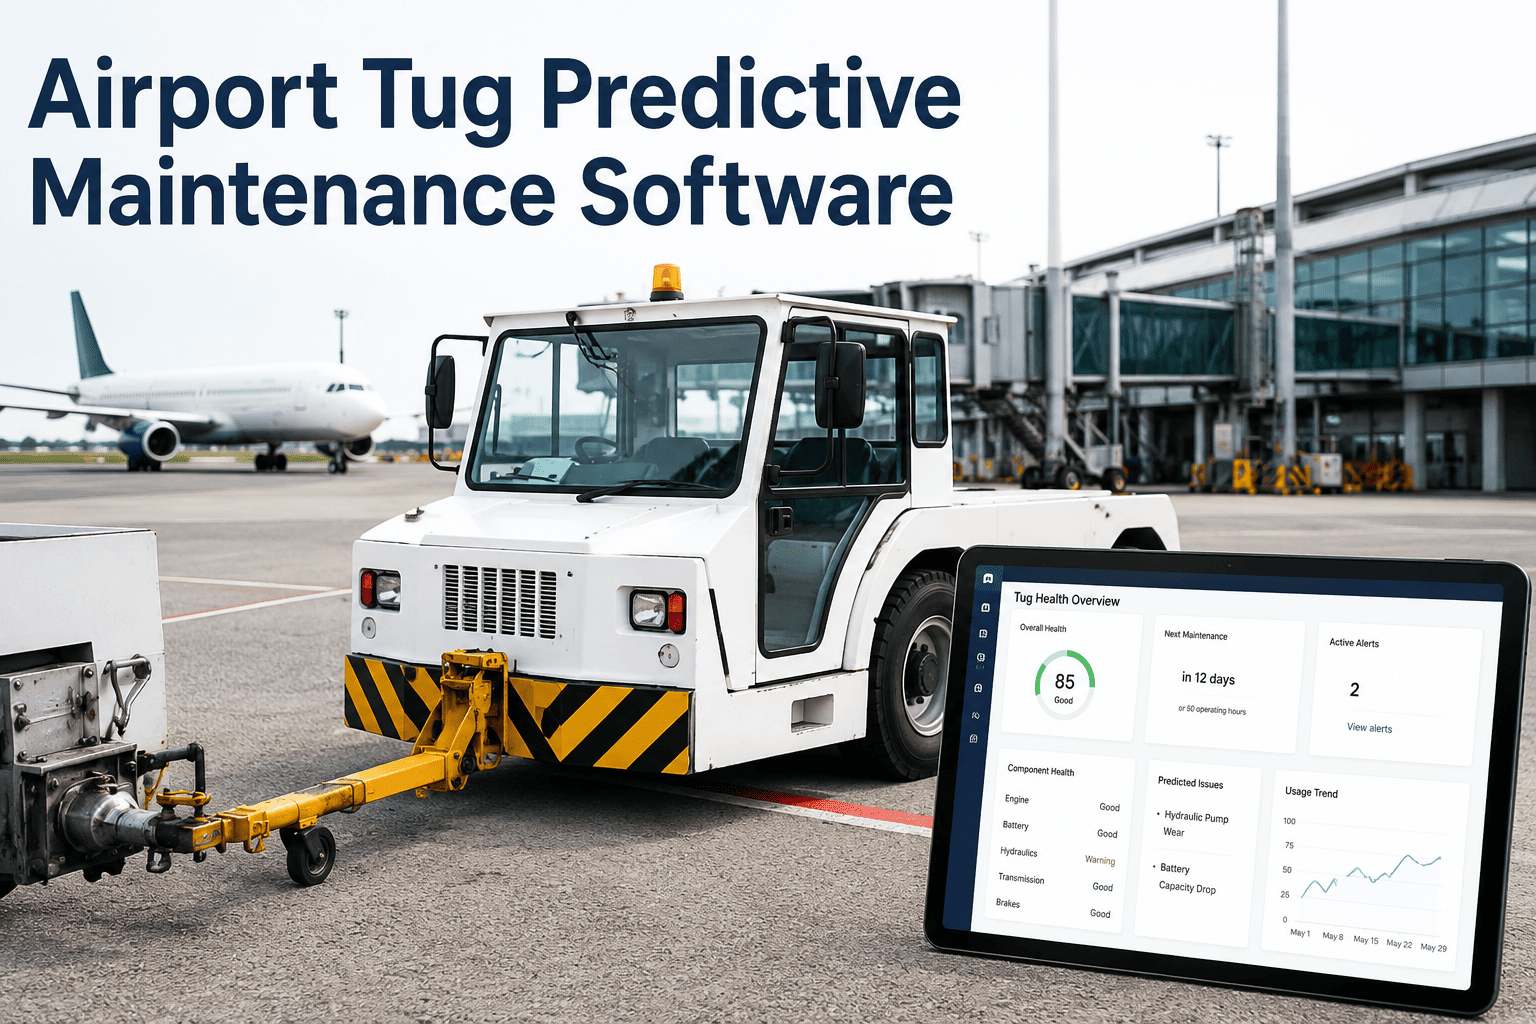
A pushback tractor stalls out mid-turn at the gate with an aircraft already hooked to the towbar, and the ramp freezes — nobody can push, taxi, or clear the stand until a spare tug arrives or the crew wrestles the failure into submission. The equipment log for that tug looked fine three days earlier. That gap between "looked fine" and "failed under load" is where almost every unplanned tug breakdown actually lives, and it's the gap iFactory's predictive maintenance software is built to close.
Your Tugs Signal a Failure Long Before They Stall at the Gate. Predictive Maintenance Software Is What Catches the Signal.
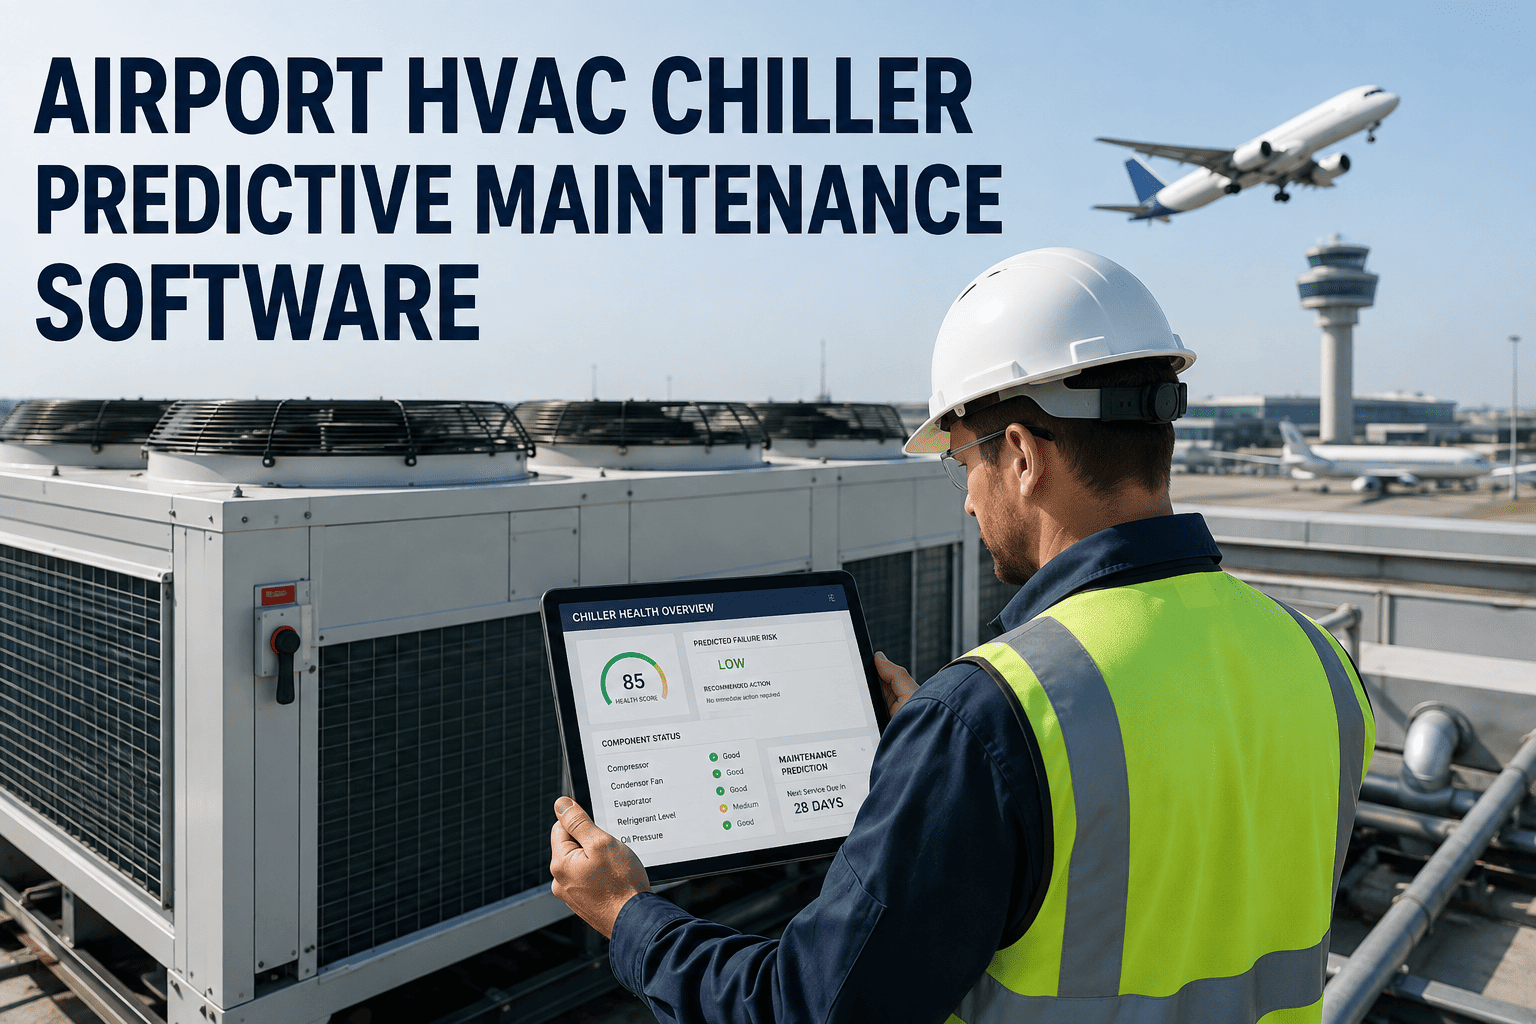
Airport tug predictive maintenance software combines live condition data, service history, and cross-fleet failure patterns into a single model that predicts which pushback tractor is about to fail — and automatically turns that prediction into a scheduled work order before the tug ever reaches the ramp.
Four Systems Where Airport Tugs Fail First — And Why the Failure Rarely Starts on the Ramp
A tug doesn't fail all at once. It fails one system at a time, and the earliest warning almost always shows up somewhere other than the symptom a ground crew eventually notices. Knowing which system is degrading — and what it looks like before it becomes a stall, a stuck brake, or a dead control panel — is the difference between a scheduled swap and a stranded aircraft.
Duty cycle is what separates a tug from most other pieces of ground equipment. A pushback tractor rarely runs continuously — it idles, surges into a heavy pull, stops hard, and repeats that pattern dozens of times a shift, sometimes under a loaded aircraft weighing well over a hundred tons. That start-stop-load pattern is exactly what accelerates wear in couplings, hydraulic seals, and brake components, and it's also exactly the kind of pattern that a fixed monthly or quarterly inspection interval is poorly suited to catch, because the degradation curve doesn't move at a steady, predictable pace.
Torque Converter & Coupling Wear
Stop-start pushback cycles and heavy load transfer wear couplings and drivetrain components unevenly, and the degradation often feels like normal aging right up until traction or stopping distance changes at the worst possible moment.
Pressure Loss & Fluid Contamination
Small leaks, slow pressure loss, and contaminated fluid rarely stop a tug outright on their own, but they erode steering response and control precision with every single towing cycle until a threshold gets crossed.
Uneven Pad Wear & Response Lag
Loose or unresponsive steering and delayed braking response are among the most severe hazards on a crowded ramp, and both typically build gradually through heat cycling long before an operator reports a hard fault.
Intermittent Connections & Sensor Faults
Vibration, moisture, and repeated ramp use loosen wiring and degrade control modules, and these faults tend to appear intermittently for weeks before hardening into a failure that leaves a tug dead at the gate.
The Diagnostic Table: What a Symptom Is Actually Telling You
Most ramp crews already notice something before a tug fails — a slight steering lag, a delayed response on the throttle, a warmer-than-usual gearbox. What's usually missing is the translation between that symptom and its root cause, and the warning window that translation buys.
This is the gap predictive maintenance software is designed to close. Instead of relying on a technician's memory of what a similar symptom meant on a different tug two years ago, the system matches the current reading against a library of confirmed failure signatures across the entire fleet and returns a specific likely cause with a confidence level attached, rather than a generic "inspect further" flag that still leaves the real diagnostic work to whoever picks up the work order.
| Observed Symptom | Likely Root Cause | Typical Warning Window | Risk if Ignored |
|---|---|---|---|
| Delayed steering response | Hydraulic pressure drop or valve wear | 1-2 weeks | Loss of control during nose gear engagement |
| Rising gearbox temperature | Torque converter or coupling wear | 2-4 weeks | Stall under heavy tow load at the gate |
| Intermittent control panel dropout | Wiring harness fatigue or connector corrosion | 3-5 weeks | Total control loss mid-pushback |
| Uneven or spongy braking | Pad wear imbalance or brake fluid degradation | 1-3 weeks | Extended stopping distance on a live ramp |
| Slower hydraulic lift on towbarless units | Seal wear or fluid contamination in the lift cradle | 2-3 weeks | Failed nose gear pickup mid-operation |
A Symptom Is Only Useful If It Reaches a Work Order
iFactory's predictive maintenance software reads these exact signals off your tug fleet continuously and converts them into a scheduled repair automatically, instead of leaving them for a technician to catch on the next walk-around.
What Reactive Tug Maintenance Actually Costs a Ramp
The repair bill is rarely the real cost. A blown seal or a worn coupling is a few hundred dollars in parts — the expensive part is everything that stops moving around it while the tug sits dead at the gate: the aircraft that can't push, the crew burning through their scheduled block time, and the connecting passengers whose next flight is now also at risk.
Industry-wide GSE failure data traced through ramp incident reporting consistently points to the same conclusion — a meaningful share of ground damage and delay events trace back to equipment condition rather than operator error, which means the fix isn't more operator training, it's better visibility into equipment health before it becomes an incident report at all.
A 40-tug fleet losing just three hours a week to unplanned failures bleeds well into six figures annually once delay penalties, expedited parts freight, and overtime repair labor are added together — and that number climbs fast at hub airports running tight connection banks with no slack in the schedule.
There's a second cost that rarely shows up on a maintenance budget line at all: equipment reallocation. Every time a tug fails mid-shift, a spare unit has to be pulled from another stand to cover the gap, which means that one failure quietly creates a second point of exposure somewhere else on the ramp. Fleets running close to their minimum tug count for a given bank feel this compounding effect the hardest, since there's no slack left to absorb a second failure on the same shift.
From Sensor Signal to Scheduled Work Order: How the Prediction Loop Closes
A prediction that sits in a report nobody opens is not meaningfully different from having no prediction at all. The value of predictive maintenance software is entirely in what happens after the model flags something — whether that flag turns into an actual scheduled repair, or whether it gets buried under the next shift's operational noise. That handoff is the part most GSE monitoring tools skip, and it's the part iFactory builds the workflow around.
Continuous Condition Sensing
Hydraulic pressure, gearbox temperature, brake response, and electrical continuity are monitored across every tug in the fleet, not just the units that already have a maintenance complaint logged against them.
Cross-Fleet Pattern Matching
Each reading is compared against the failure history of similar tugs across the fleet, so a subtle drift on one unit gets flagged using patterns already confirmed on other units of the same make and duty cycle.
Failure Window Prediction
The model converts drift into a specific, dated failure window rather than a vague health score, giving maintenance planners a real number to schedule against instead of a guess.
Automatic Work Order Generation
The prediction is pushed directly into the maintenance queue as a scheduled work order with the likely root cause attached, so no one has to manually translate a report into action during a busy shift.
Off-Ramp Repair Scheduling
The repair gets slotted into a planned maintenance window between shifts or during a light connection bank, so the tug never has to be pulled from active rotation mid-turnaround.
A Peak-Bank Failure That Never Happened
A ground handling operation running 42 tugs across a mid-size international hub had a recurring pattern: roughly one hydraulic-related tug failure every five to six weeks during peak connection banks, each one averaging 18 minutes of added gate time and pulling a spare unit off another stand to cover the gap.
After connecting the fleet's hydraulic pressure and gearbox temperature readings to a predictive maintenance model, one towbarless unit showed a slow pressure decay pattern in the lift cradle circuit consistent with early seal wear, with a predicted failure window nine to fifteen days out — right in the middle of the operation's highest-volume connection bank of the month. The maintenance team pulled the unit for a planned seal replacement during an overnight low-traffic window instead, and the tug was back in rotation before the next morning bank started.
Under the previous reactive approach, that same seal would most likely have failed mid-lift with an aircraft's nose gear only partially engaged — one of the more dangerous failure points on a towbarless unit, since it can leave the aircraft unstable at exactly the moment it's being repositioned. Instead, the failure surfaced on a maintenance bay schedule at 2 a.m., with the right part already staged, and never made it onto a single flight delay report.
Manual Ramp Inspection vs AI-Driven Tug Monitoring
Manual walk-around inspections are not a bad practice — they're a necessary one. The issue is what they're structurally capable of catching. An inspection checks whether a fault is already visible, audible, or otherwise obvious to a trained eye at that specific moment in time, which means anything degrading quietly between inspections has an open window to reach the ramp before anyone notices.
| Capability | Manual Walk-Around Inspection | AI-Driven Predictive Monitoring |
|---|---|---|
| Detection timing | Catches faults already visible or audible | Flags drift weeks before a symptom appears |
| Coverage frequency | Once or twice per shift, per tug | Continuous, across the entire fleet |
| Root-cause accuracy | Dependent on individual technician experience | Cross-referenced against fleet-wide failure history |
| Work order creation | Manual, after inspection paperwork is filed | Automatic, generated the moment a threshold is crossed |
| Scheduling outcome | Reactive repair, often mid-shift | Planned repair during a low-traffic window |
Is Your Ramp Ready to Start With Predictive Tug Maintenance
Not every ground handling operation needs to instrument an entire fleet on day one. The operations that get the most value fastest tend to share a few things in common before they even start — mostly around whether the data and the workflow around it are ready to actually act on a prediction rather than just receive one.
You already know which tugs cause the most disruption
If maintenance and ramp operations already agree on which units fail most often or cause the worst delays, that shortlist is the ideal starting scope for a first predictive deployment.
Your tugs already log basic operating data
Existing telematics, hour meters, or fault codes accelerate deployment significantly, though a monitoring program can still be built around new sensor instrumentation from scratch.
Your maintenance team can accept automated work orders
The prediction-to-repair loop only closes if a flagged failure can generate a work order directly, rather than requiring someone to manually re-key a report into the maintenance system.
Ramp leadership is willing to pull a tug before it fails
Predictive maintenance only pays off if the team schedules the repair off the prediction, instead of waiting to see whether the tug actually breaks down during the next peak bank.
Frequently Asked Questions
How is predictive maintenance software different from a standard GSE telematics dashboard?
A telematics dashboard shows hour meters, fault codes, and location data for a technician to review manually, while predictive maintenance software runs a degradation model against that same live data continuously and outputs a specific, dated failure prediction on its own. The dashboard depends on someone actively watching for a trend to emerge; the predictive model surfaces the trend and its consequence automatically, then routes it straight into the maintenance queue. Visit support to see how this distinction applies to your own tug fleet's data.
How much historical failure data does the model need before predictions are useful?
Physics-based degradation models combined with manufacturer service specifications can generate directionally useful predictions from the first weeks of sensor connection, with accuracy improving steadily as fleet-specific failure history accumulates over subsequent months. Most operations see their first confirmed early-warning catch on a real tug within the first full connection-bank cycle after deployment.
Does predictive maintenance replace the need for ramp maintenance technicians?
No — it changes what technicians spend their shift doing, shifting hours away from routine walk-around inspections and emergency mid-shift repairs toward planned, scheduled work guided by the model's predictions. Technicians still perform every repair; the software simply tells them which tug needs attention and why, well before a ramp-level failure forces the decision. Book a demo to see how the daily workflow changes for a maintenance team.
What sensors are needed to start monitoring an existing tug fleet?
Hydraulic pressure, gearbox or transmission temperature, and basic electrical continuity sensors cover the majority of common tug failure modes, with brake response and lift-cradle pressure sensors adding value for towbarless units specifically. Many fleets already have partial instrumentation through existing telematics hardware that can be repurposed as a starting data source rather than requiring a full retrofit.
How many tugs should a first predictive maintenance rollout cover?
Most successful rollouts start with somewhere between five and fifteen of the highest-utilization or most failure-prone tugs rather than instrumenting an entire fleet at once, since a focused scope proves out the prediction accuracy and work order workflow before expanding further. Contact support for help scoping the right starting list for your ramp.
Stop Finding Out About Tug Failures at the Gate
iFactory's predictive maintenance software watches every tug in your fleet continuously, turns early warning signs into scheduled work orders automatically, and keeps failures off the ramp where they cost the most.