Airport infrastructure extends far beyond the aircraft gate. Runways, terminal buildings, baggage handling systems, ground support equipment, HVAC plants, airfield lighting, and utility networks form a complex facility ecosystem that most airport management software treats as separate cost centers rather than an integrated operational system. The global airport management systems market reached USD 11.47 billion in 2025 and is projected to grow to USD 45.72 billion by 2034 as airports worldwide confront aging infrastructure, rising passenger volumes, and the operational cost of fragmented facility oversight. ifactory Airport Facilities Module brings unified analytics to the entire airport facility landscape — from runway friction index trends to terminal energy consumption patterns to ground equipment fleet health — enabling airport operators to manage facilities as a single system rather than a collection of disconnected assets.
Airports are among the most complex facility environments in operation — multi-building campuses with airside and landside infrastructure, 24/7 energy demands, thousands of assets, and regulatory oversight across every domain. Yet most facility analytics platforms treat runways, terminals, baggage systems, ground equipment, and utilities as isolated verticals. ifactory Airport Facilities Module connects them.
Five facility domains that determine airport operational performance — and the analytics each demands.
01
Terminal Operations
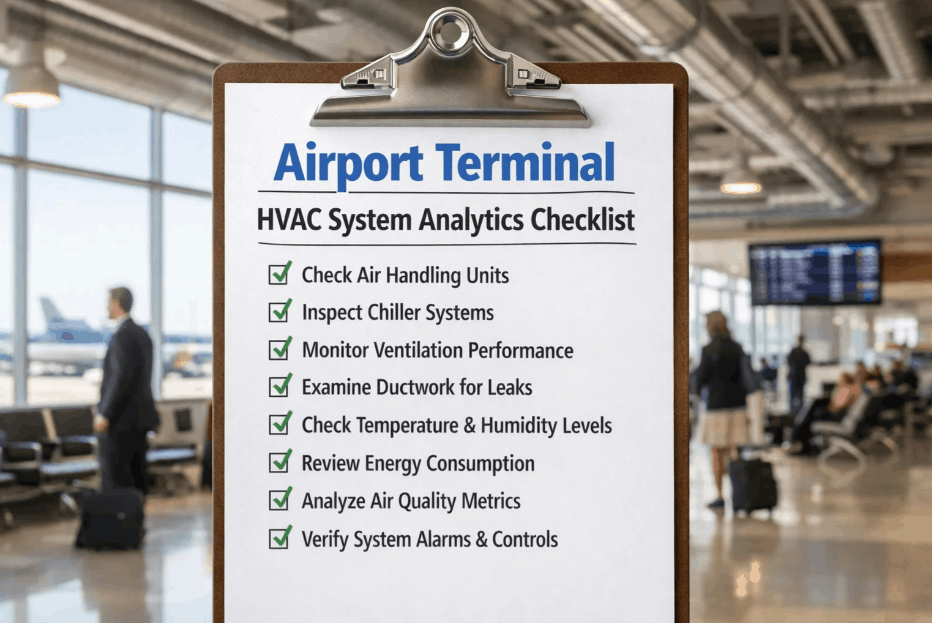
HVAC systems consume 40-60% of terminal energy. Passenger flow, escalator reliability, lighting zones, and gate assignment all feed into facility performance. Analytics must correlate terminal energy consumption with flight schedules, occupancy levels, and outdoor conditions to optimise HVAC without compromising passenger comfort.
40-60% of terminal energy from HVAC
02
Airfield Infrastructure
Runway friction, taxiway lighting, apron condition, airfield drainage, and navigational aids require condition-based maintenance scheduling. The FAA Airport Improvement Program allocated over USD 14.5 billion through 2026 for airfield projects. Analytics must predict when infrastructure degradation will reach intervention thresholds.
USD 14.5B in FAA airfield funding
03
Baggage & Cargo Systems
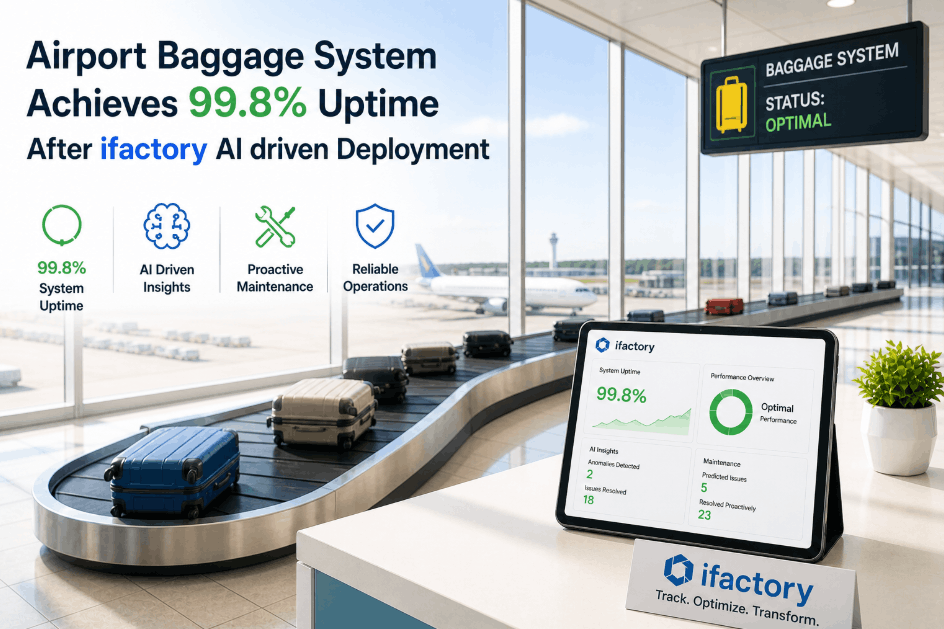
33.4 million bags were mishandled globally in 2024, costing the industry USD 5 billion. Baggage handling system downtime at a major hub can delay 20+ departures within an hour. Analytics must monitor conveyor belt speeds, diverters, screening equipment, and sortation logic in real time, predicting failures before they cause a system-wide stoppage.
USD 5B annual baggage mishandling cost
04
Ground Support Equipment
The global GSE market is valued at USD 10 billion with 44,000+ rented units across 240+ airports. Pushback tractors, baggage tugs, ground power units, air conditioning carts, and de-icing rigs each have maintenance schedules and utilisation profiles. Analytics must coordinate GSE fleet health with flight schedules to avoid equipment shortages at peak departure waves.
USD 10B global GSE market
05
Energy & Utilities
Electricity demand at US airports may quintuple within 20 years. Terminal lighting, airfield signage, escalators, elevators, water systems, fire suppression, and backup generators form a utility network that spans the entire airport campus. Analytics must detect anomalous consumption patterns that signal equipment degradation before a failure disrupts terminal operations.
5x projected energy demand growth
The Cost of Fragmented Facility Oversight
Most airports manage terminal operations, airfield maintenance, baggage systems, ground equipment, and utilities through separate departments with independent budgets, separate software platforms, and no shared view of facility health. This fragmentation hides the true cost of facility operations and prevents cross-domain optimisation that could reduce total expenditure while improving performance. Airlines fund 75% of airport O&M costs at large-hub airports — meaning every dollar of avoidable facility expense flows directly into airline rates and fees.
Domain Cost Breakdown
Terminal O&M34%
Airfield Maintenance26%
Baggage & Cargo Systems16%
Ground Equipment Fleet14%
Energy & Utilities10%
Hidden Cost Multipliers
Emergency Repairs Premium
Reactive repairs cost 3-5x more than planned maintenance when factoring in overtime labour, expedited parts shipping, and operational disruption.
Cross-Domain Waste
A terminal HVAC failure that grounds check-in operations cascades into baggage system idle time and gate re-assignment costs — charges that are never attributed to the facility root cause.
Compliance Penalty Risk
Regulatory non-compliance in any domain — from airfield lighting certification to fire suppression testing — can result in fines, operational restrictions, or airport closure penalties.
Facility Health at a Glance
When facility data is unified, airport operators gain visibility into cross-domain performance indicators that siloed systems cannot provide. These metrics represent the minimum viable dashboard for any airport facility management operation.
94%
Terminal Asset Availability
Percentage of terminal assets — HVAC units, escalators, elevators, lighting zones, boarding bridges, and baggage carousels — available and operational during peak hours. Each percentage point below 94% correlates with measurable passenger satisfaction decline and airline delay cost allocation.
87%
Airfield Infrastructure Condition Index
Composite score measuring runway pavement condition, taxiway lighting reliability, apron surface quality, airfield marking visibility, and drainage system performance. Scores below 85% trigger regulatory scrutiny and accelerated capital planning requirements.
6.3
Baggage System MTBF (Hours)
Mean time between failures for baggage handling system components — conveyors, diverters, screening units, and sorters. Each failure event at a hub airport disrupts an average of 14-22 departures before the system returns to full throughput capacity.
18%
Energy Intensity Reduction Target
Potential energy cost reduction from integrating terminal HVAC, airfield lighting, and utility consumption data into a single analytics platform. Airports that unify energy management across facility domains typically achieve 12-18% reduction within 18 months of deployment.
Siloed vs Unified: The Facility Management Difference
Siloed Facility Management
Terminal, airfield, baggage, GSE, and utilities teams use separate software platforms with no shared data.
Maintenance is scheduled per-department without visibility into cross-domain impact or resource conflicts.
Emergency repairs in one domain are invisible to other departments until operational disruption occurs.
Capital planning is fragmented, with each domain competing for budget without system-level prioritisation.
Unified Analytics via ifactory
Single facility health dashboard covering all domains with cross-correlated data and unified trend analysis.
Condition-based maintenance scheduling with cross-domain resource optimisation and conflict resolution.
Predictive alerts triggered by cross-domain anomaly detection — HVAC degradation that signals baggage system environment risk.
Capital allocation decisions guided by facility-wide condition index, risk scoring, and lifecycle cost analysis.
What ifactory Airport Facilities Module Delivers
The Airport Facilities Module is not a collection of separate facility management tools under one login. It is a purpose-built analytics platform that ingests data from every facility domain and surfaces the correlations, trends, and predictions that siloed systems cannot reveal.
Capability 01
Unified Facility Health Dashboard
Every domain — terminal, airfield, baggage, GSE, utilities — feeds into a single health index displayed on a configurable dashboard. Facility operators see overall campus health, domain-specific scores, and cross-domain correlations that explain how a baggage system slowdown may be related to terminal HVAC degradation in the same zone. The dashboard surfaces the metrics that matter most to each stakeholder — from the terminal manager tracking escalator availability to the airfield superintendent monitoring runway friction trends — all from a single analytics layer.
Cross-domain health index with role-based KPI views
Capability 02
Condition-Based Maintenance Orchestration
The module ingests sensor data, work order history, inspection results, and OEM guidelines to generate condition-based maintenance schedules for every facility asset. When a terminal HVAC unit shows rising discharge temperature trends, the system evaluates whether the issue can be addressed during the next scheduled airfield maintenance window — consolidating site visits and reducing contractor mobilisation costs. The orchestration engine resolves scheduling conflicts across domains and recommends the lowest-net-cost intervention timeline.
Cross-domain maintenance orchestration with conflict resolution
Capability 03
Predictive Failure Detection Across Domains
The module applies anomaly detection models to every asset class — from airfield lighting current draw patterns to baggage conveyor motor vibration signatures to GSE battery discharge curves. When an anomaly is detected, the system calculates the probability of failure within a configurable time window and recommends the optimal intervention window that minimises operational impact. A failing baggage sorter motor detected during low-traffic hours can be repaired overnight rather than failing mid-afternoon during the peak departure bank.
Multi-asset predictive failure models with operational impact scoring
Capability 04
Energy & Utility Optimisation
With electricity demand at airports projected to quintuple within two decades and HVAC consuming 40-60% of terminal energy, the module correlates consumption data with flight schedules, passenger load, weather conditions, and terminal zone occupancy to identify optimisation opportunities. The system detects anomalous consumption spikes that indicate equipment degradation, recommends setback schedules for low-traffic periods, and tracks utility cost allocation per tenant airline — directly supporting the cost allocation transparency that large-hub airports require for rate-setting compliance.
Energy analytics with tenant cost allocation and demand forecasting
Conclusion
Airport facility management has traditionally operated in domain silos — terminal operations, airfield maintenance, baggage systems, ground equipment, and utilities managed as independent cost centers with separate data, separate schedules, and separate performance metrics. As the airport management systems market expands toward USD 45.72 billion by 2034 and passenger volumes continue rising, the cost of this fragmentation becomes unsustainable. Airlines funding 75% of O&M costs at large hubs will demand the operational efficiency that only unified facility analytics can deliver.
ifactory Airport Facilities Module replaces siloed facility management with a unified analytics platform that connects every domain into a single health index, orchestrates maintenance across asset classes, predicts failures before they cascade across systems, and optimises energy consumption across the entire campus. Book a Demo to see how the module maps to your airport's facility infrastructure, or Get In Touch to begin unifying your facility data and receiving cross-domain health insights within your first deployment phase.
Frequently Asked Questions
ifactory is designed as an analytics overlay that connects to existing facility management systems — CMMS, BMS, asset management platforms, energy management systems, and work order databases — through standard APIs and data feeds. It does not replace those systems but aggregates their data into a unified analytics layer that reveals cross-domain correlations and trends that the source systems cannot surface independently. For airports without existing digital facility management, ifactory can serve as the primary platform with direct data ingestion from sensors and equipment controllers. Get In Touch to discuss your current system landscape and integration requirements.
The module supports five primary facility domains: terminal infrastructure (HVAC, lighting, escalators, elevators, boarding bridges, baggage carousels, fire suppression); airfield infrastructure (runways, taxiways, aprons, airfield lighting, navigational aids, drainage systems); baggage and cargo handling systems (conveyors, diverters, screening equipment, sortation units, carousels); ground support equipment (pushback tractors, baggage tugs, GPU, air conditioning carts, de-icing rigs, belt loaders); and energy and utility systems (electrical distribution, backup generators, water systems, solar arrays, microgrids). Each domain has its own asset hierarchy, condition indicators, and maintenance logic within the unified platform. Book a Demo to review the full asset library and configure the module for your airport's specific infrastructure.
The module does not replace departmental authority or reporting structures. It surfaces scheduling conflicts and optimisation opportunities that each department can review independently through role-based dashboards. When the system identifies that a terminal HVAC repair and an airfield lighting maintenance task could share the same site visit and contractor mobilisation, it generates a recommendation that both departments can evaluate on their own timelines. The cross-domain orchestration feature is configurable — airports can choose to enable automated conflict resolution and consolidated scheduling or use the system as an advisory layer that respects existing departmental decision-making processes. Get In Touch to configure orchestration rules that match your airport's organisational structure.
For an airport handling 5-15 million passengers annually with a single terminal, one runway, and standard ground equipment fleet, ifactory implementation typically covers: weeks one to three for system integration with existing CMMS, BMS, and energy management platforms; weeks three to five for asset hierarchy configuration across all five facility domains; weeks five to seven for analytics model training and threshold calibration on historical data; weeks seven to eight for dashboard configuration and team training across terminal operations, airfield maintenance, and facilities departments. Full go-live with cross-domain health index, predictive alerts, and unified reporting is achieved within eight to twelve weeks. The initial unified facility health dashboard is available for review within the first thirty days of the implementation. Book a Demo to develop an implementation plan specific to your airport's current facility management technology stack and organisational structure.
Airport Facilities Are Not Separate Problems. They Are One System.
ifactory Airport Facilities Module — unified analytics across terminals, airfield, baggage systems, ground equipment, and utilities. One platform. One health index. One view of your entire airport campus.