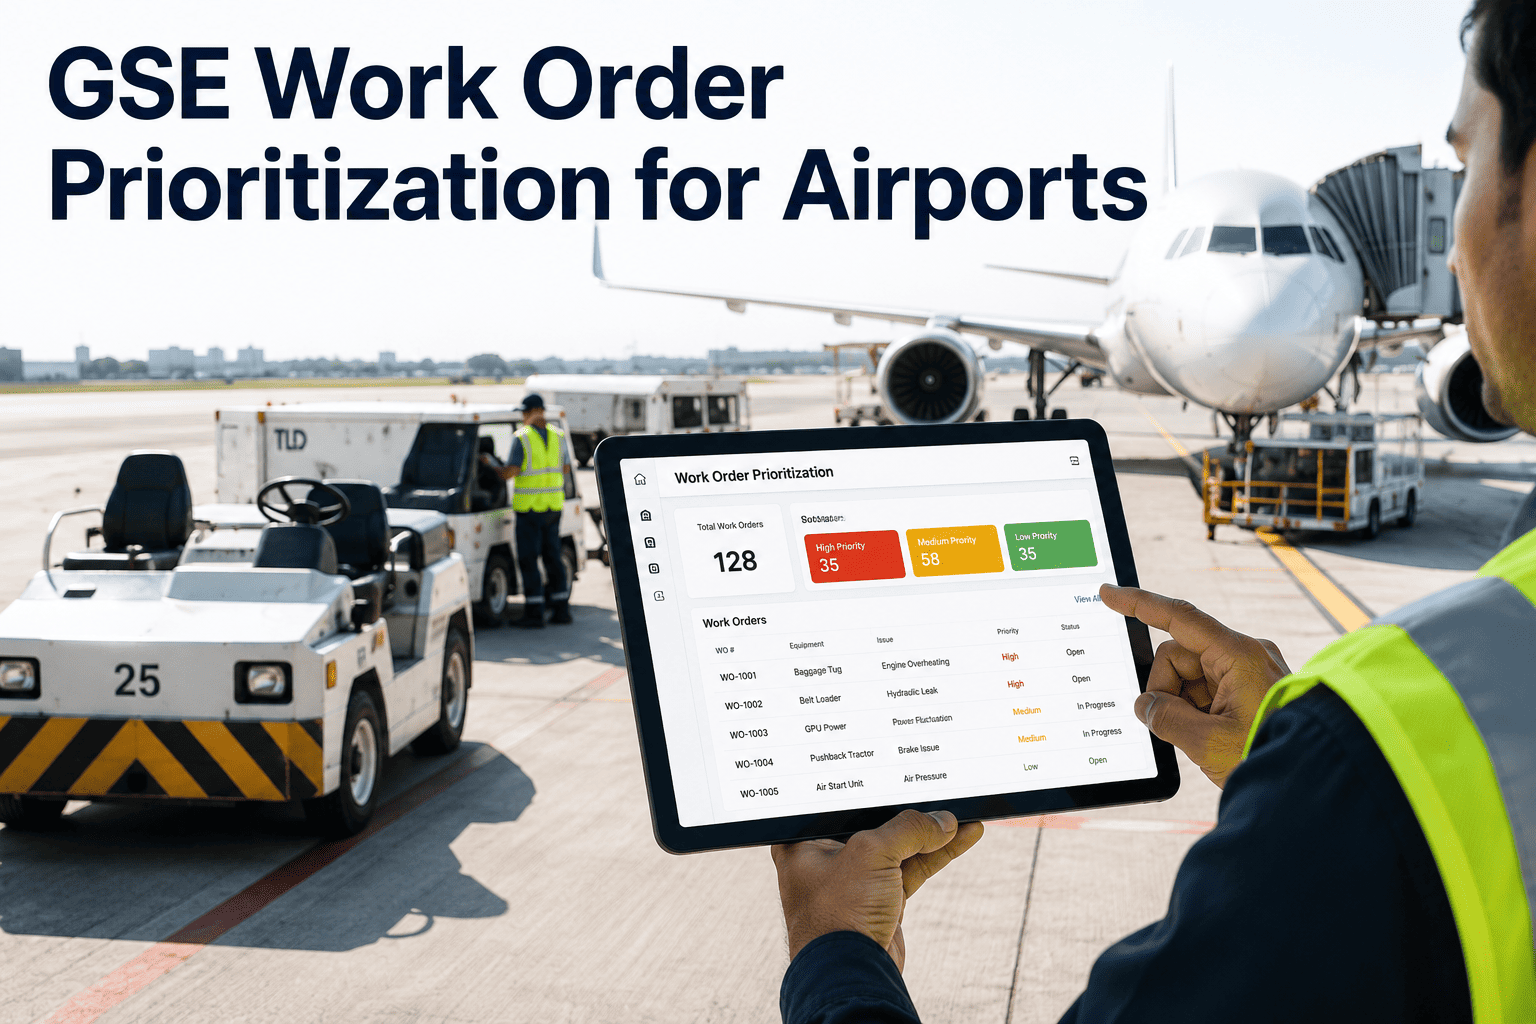
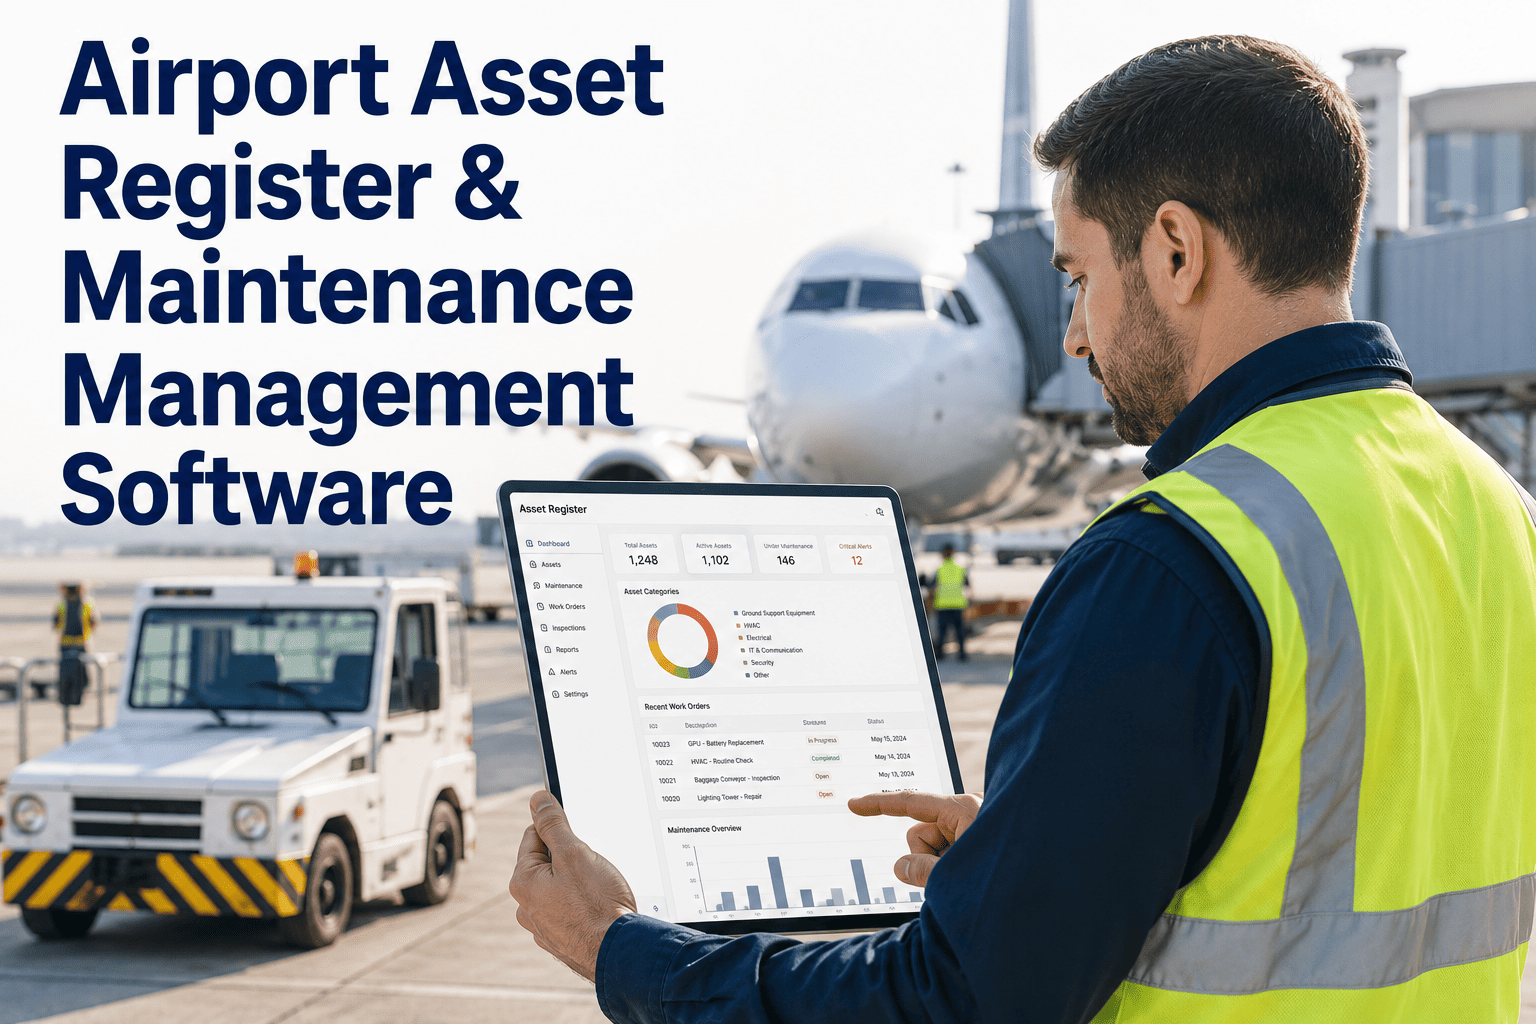
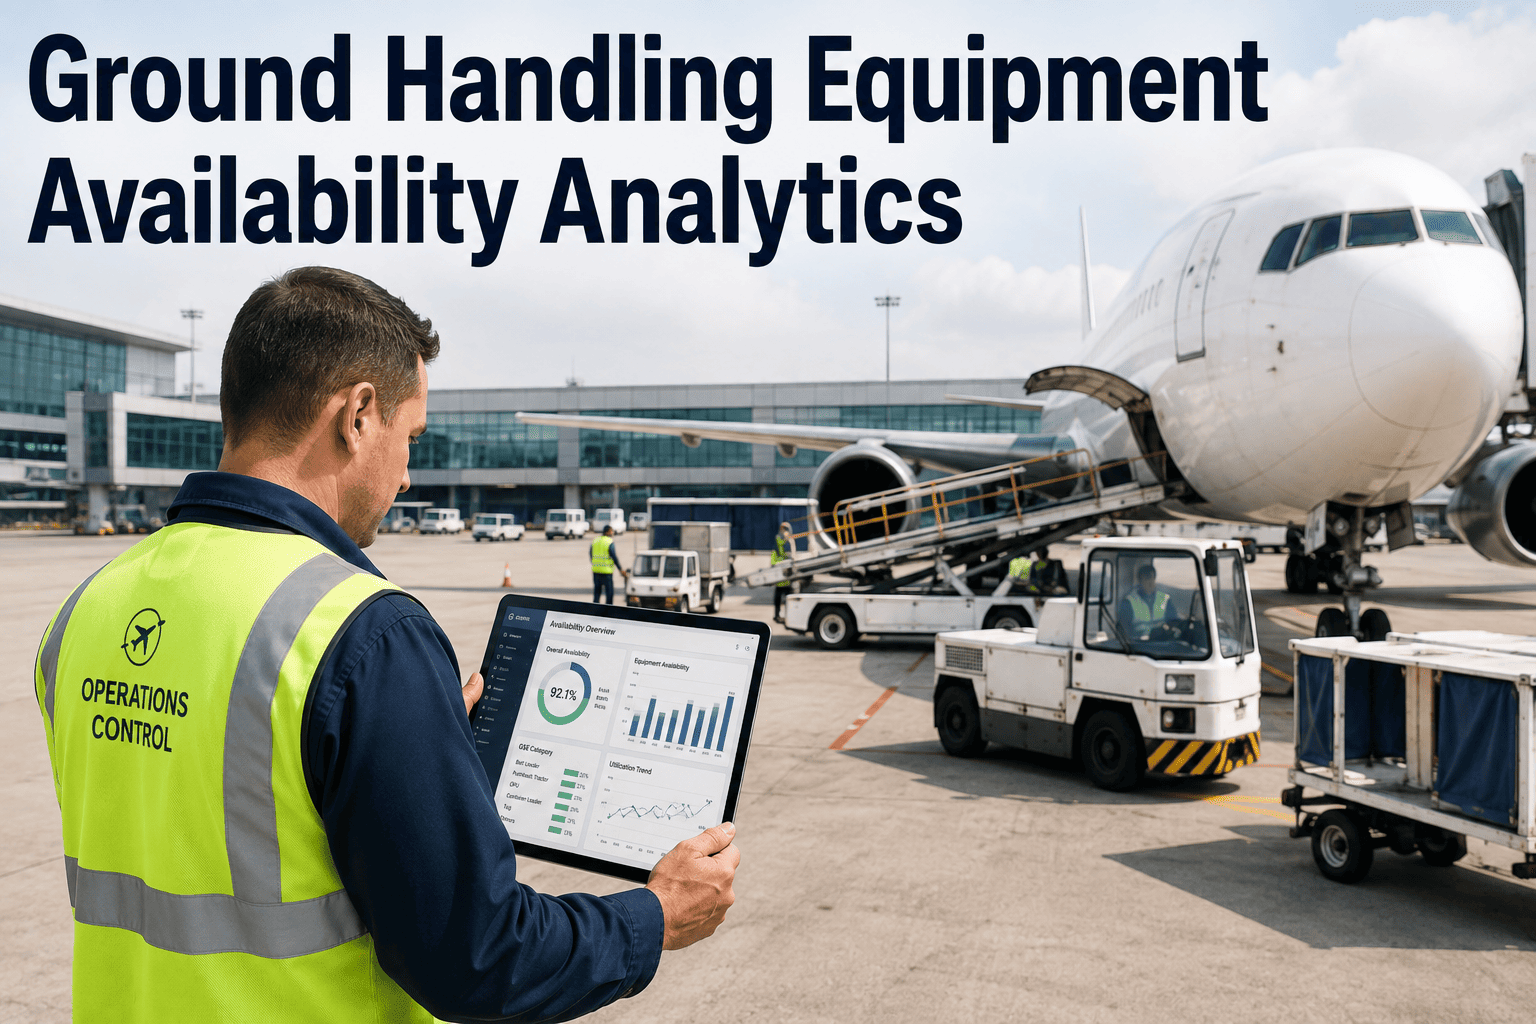
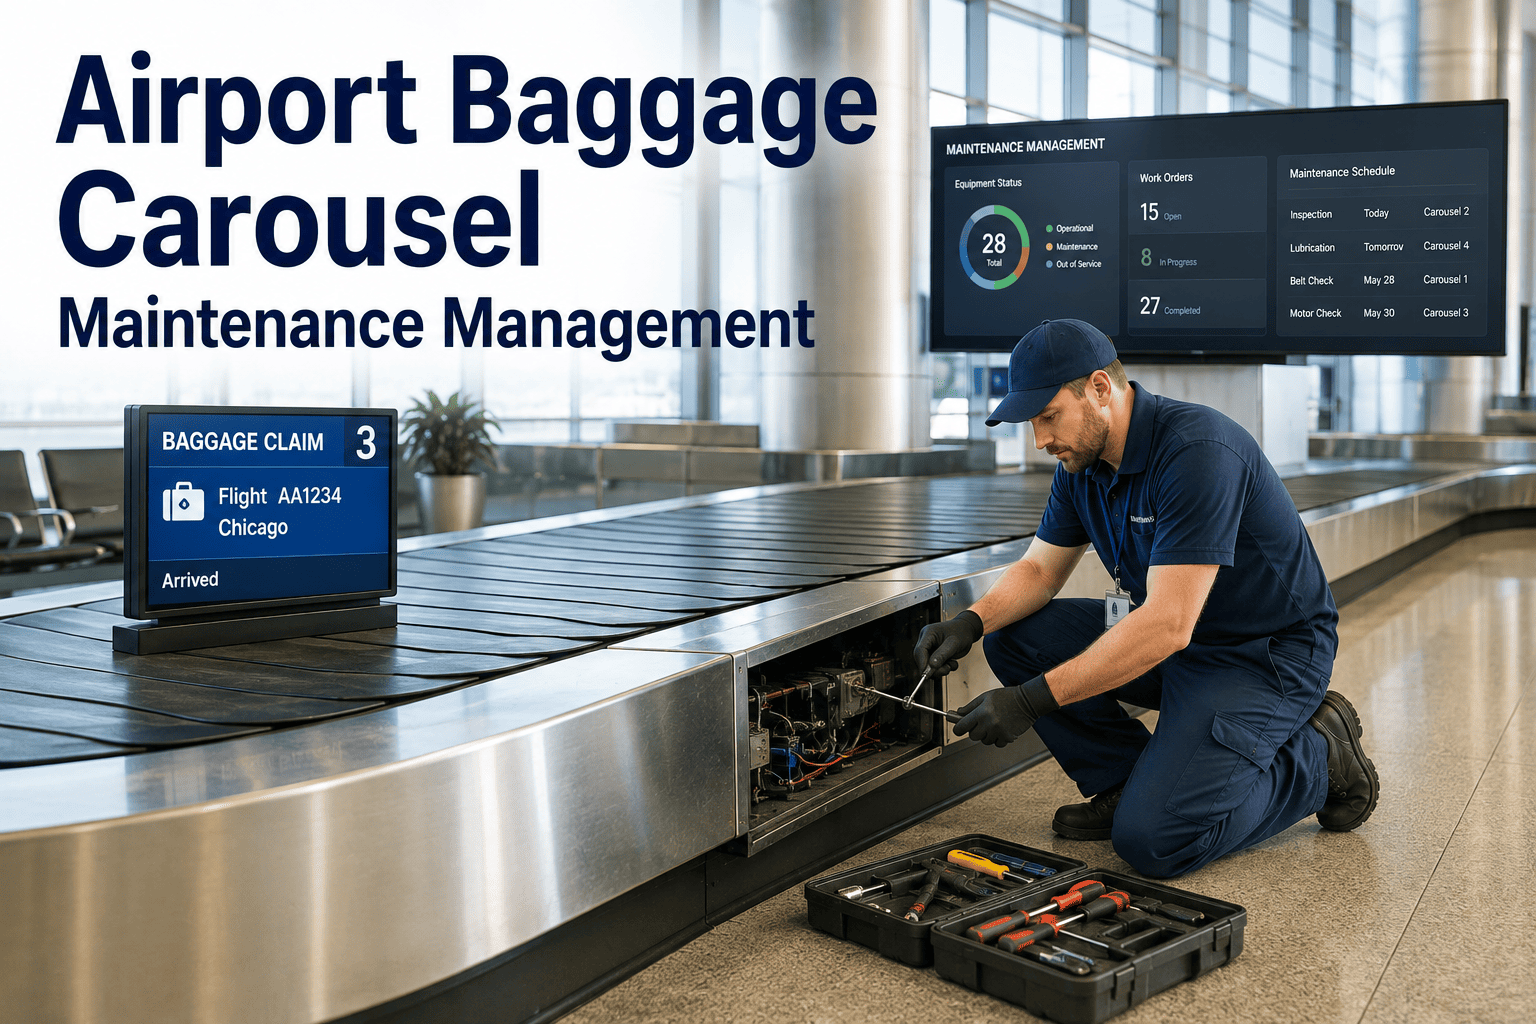
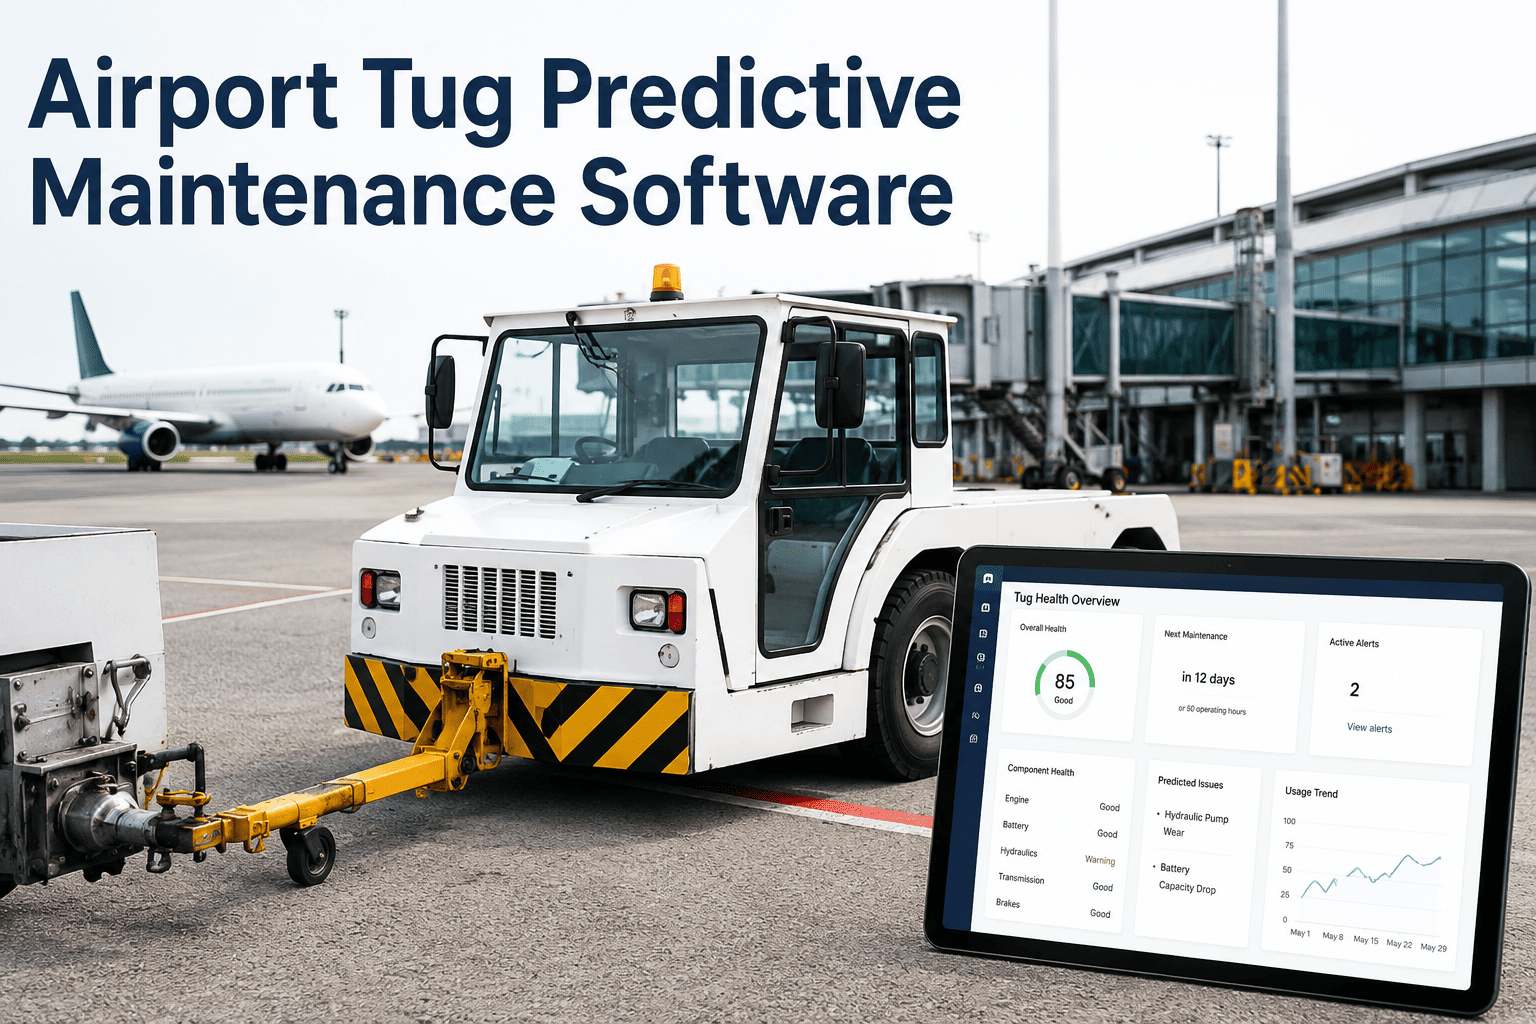
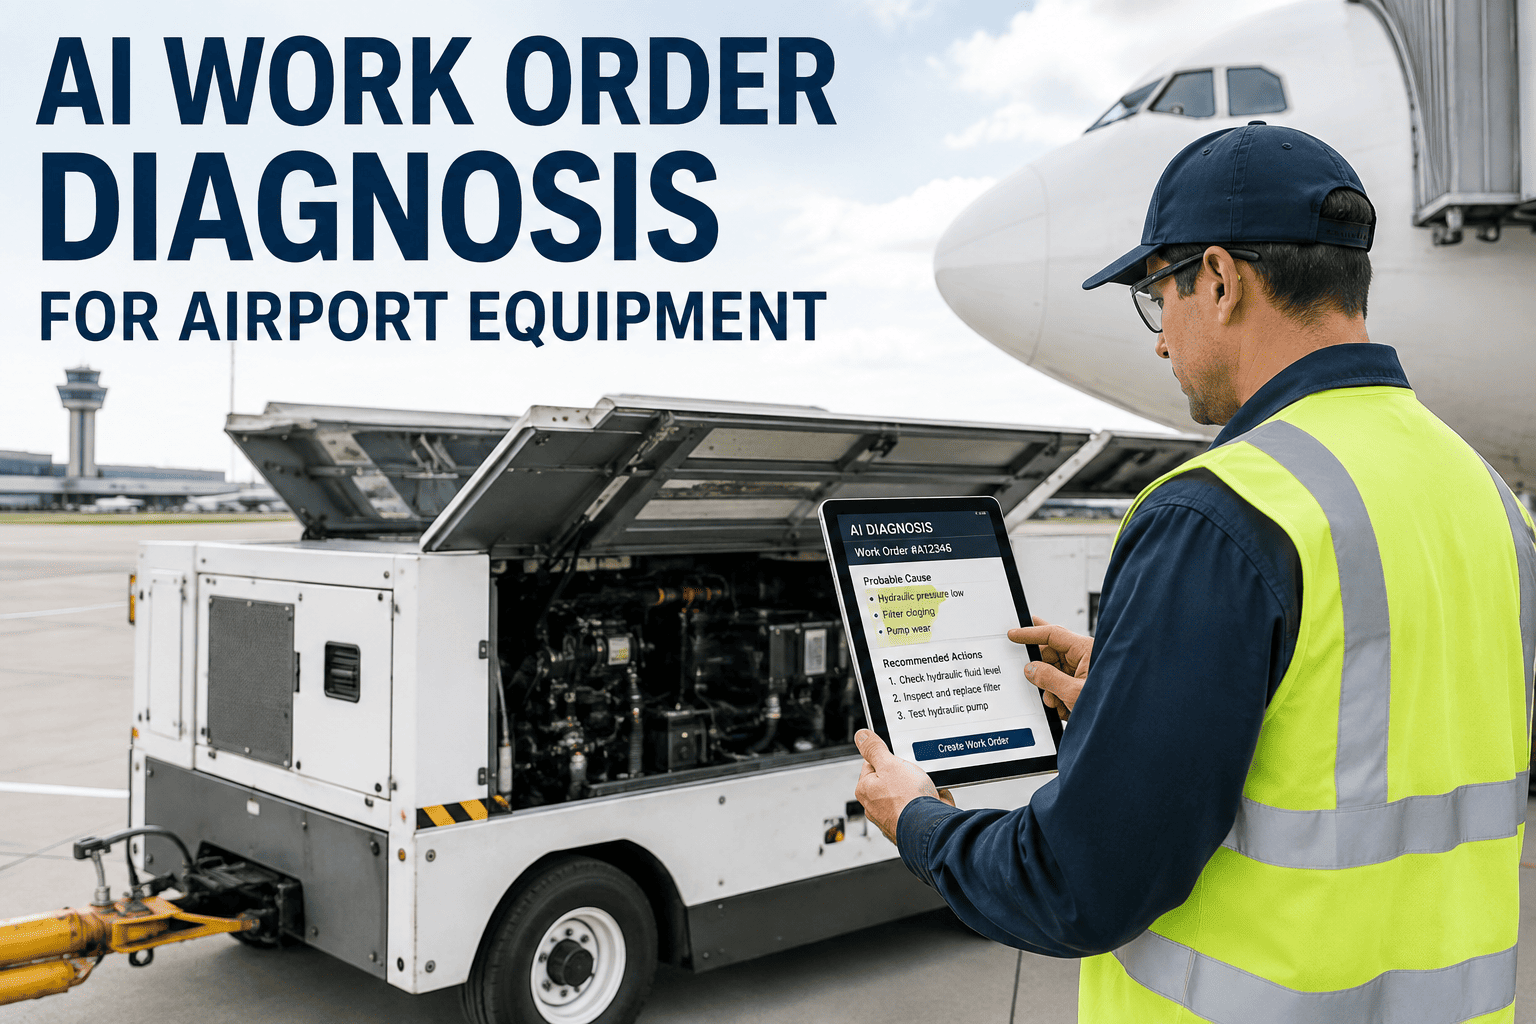
A ramp supervisor opens the maintenance queue on a Monday morning and finds forty-one open work orders with no indication of which one matters most. A belt loader with a slow hydraulic leak sits next to a pushback tractor overdue for an oil change and a deicer with a flagged boom sensor, and all three carry the same visual weight on the screen. Technicians end up working whichever ticket was submitted last, or whichever supervisor shouted loudest, while the one item that actually threatens a turnaround or a ramp injury waits its turn in a list that was never built to rank anything. iFactory scores every GSE work order against safety exposure, turnaround impact, asset criticality, and failure risk the moment it's created, so the queue tells technicians what to fix first instead of just what came in first. You can book a demo to see your current backlog re-ranked against these factors.
GSE BREAKDOWNS · WORK ORDER PRIORITIZATION · AIRPORT MAINTENANCE
Every Work Order Ranked by What It Actually Threatens, Not When It Was Filed
iFactory scores ground support equipment work orders against safety risk, aircraft turnaround impact, asset criticality, and failure probability, so your maintenance team always knows which ticket to open next.
68%
of GSE work orders are worked in submission order, not risk order
3.2x
more likely a critical unit sits idle behind low-priority tickets
<60min
target response window for safety-flagged GSE tickets
THE BACKLOG PROBLEM
Why a First-In, First-Out Queue Fails Ground Support Equipment
Most airport GSE fleets run on a maintenance queue that behaves like a ticket counter: whoever submitted the request first gets served first, regardless of what that request actually means for ramp safety or flight schedules. That approach works fine for equipment where a delay costs nothing more than inconvenience, but a GSE fleet mixes units where a missed repair can ground an aircraft turn with units where a missed repair can wait a week without anyone noticing. Treating every ticket the same way guarantees that low-stakes work gets done on time while high-stakes work drifts, simply because nobody built the queue to tell the difference. The four cards below outline the specific ways an unranked backlog breaks down on the ramp.
01
Safety Signals Get Buried
A hydraulic leak near a jet bridge or a brake warning on a tug can sit in the same list as a cosmetic dent repair, with no mechanism forcing the safety item to the top.
02
Turnaround-Critical Units Wait
A belt loader assigned to a tight international turn carries the same queue position as a spare unit sitting in the yard, even though a delay on one directly threatens on-time performance.
03
Single-Point-of-Failure Assets Are Invisible
A GPU with no backup on a remote stand is functionally more critical than a duplicated unit on a gate with three spares, but a flat ticket list has no way to reflect that difference.
04
Supervisor Judgment Fills the Gap
Without a scoring system, prioritization defaults to whichever supervisor is loudest or most recently escalated, producing a different ranking every shift with no consistent logic behind it.
THE SCORING MODEL
The Four Factors That Should Set Every GSE Work Order's Rank
A defensible prioritization system does not rank tickets on gut feel, it scores each one against a small set of factors that consistently predict operational and safety consequence. iFactory calculates a priority score for every open work order using the same four inputs a seasoned maintenance planner would weigh manually, but applies them instantly and identically across every ticket in the queue rather than depending on whoever happens to be triaging that day.
Safety Exposure
Flags any defect with direct injury potential, such as brake, hydraulic, lighting, or restraint-system faults, and any fault occurring in proximity to aircraft or personnel on the ramp.
Aircraft Turnaround Impact
Weighs whether the unit is currently assigned to an active or upcoming turn, and how tight that turn's scheduled ground time is against the fault's likely effect on the process.
Asset Criticality
Accounts for fleet redundancy at that specific stand or terminal, so a unit with no nearby backup scores higher than an identical fault on a unit with three spares available.
Failure Risk
Draws on inspection history, sensor trend data, and prior fault patterns to estimate how quickly the current defect is likely to progress into a full breakdown.
PRIORITY LEVELS
How Priority Scores Translate Into Response Time Targets
A numeric score is only useful if it maps to a clear action, so iFactory groups every scored work order into one of four priority tiers, each carrying its own response-time expectation. This turns an abstract score into a concrete instruction a technician can act on without needing to interpret anything themselves.
Critical
Safety-flagged or aircraft-blocking faults on assets with no available backup. Target response under 60 minutes, unit removed from service until cleared.
High
Turnaround-assigned units with a developing fault or single-point-of-failure assets showing early warning signs. Target response within the current shift.
Medium
Redundant or spare-fleet units with non-safety faults that don't yet affect an assigned turn. Target response within 48 to 72 hours.
Low
Cosmetic or minor wear items on low-utilization assets with no near-term operational exposure. Scheduled into routine PM windows.
See Your Own Backlog Re-Ranked Against These Factors
iFactory can score your current open work orders against safety exposure, turnaround impact, asset criticality, and failure risk in a live session, showing exactly which tickets should have moved to the top of the queue.
MANUAL VS AI-ASSISTED
What Changes When Prioritization Is Calculated Instead of Guessed
Manual triage depends entirely on whoever is reviewing the queue at that moment having full context on every asset's redundancy, assignment, and recent history, which is rarely realistic during a busy shift change. An AI-assisted scoring model applies the same inputs consistently across the entire fleet, refreshing the rank automatically as new tickets, sensor alerts, or schedule changes come in rather than only at the moment a human happens to look.
HOW IT WORKS
From Work Order Submission to a Ranked Technician Queue
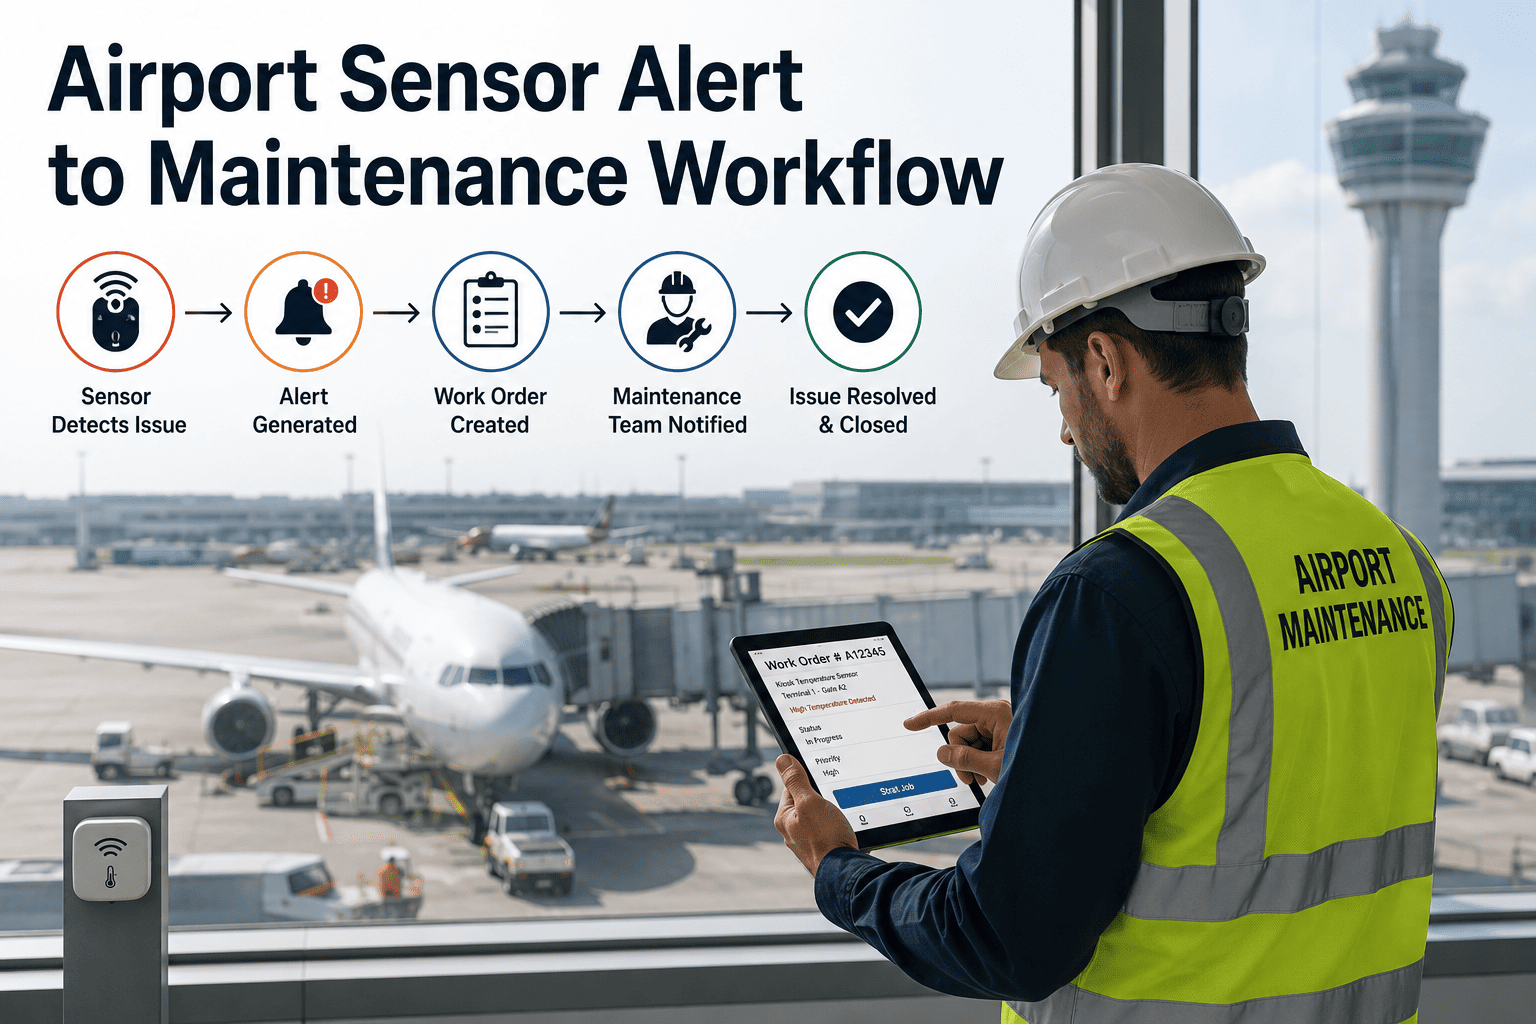
The scoring process runs in the background the moment a fault is reported, whether that report comes from a technician's inspection, a driver's defect log, or an automated sensor alert. The five steps below outline how a raw ticket becomes a ranked, assigned action item without anyone needing to manually re-triage the board.
1
Ticket Captured
A fault is logged from a digital inspection, a driver defect report, or a sensor-triggered alert, capturing the asset ID, fault description, and current stand assignment.
2
Safety Check Applied
The fault description is checked against known safety-critical fault categories, such as brake, hydraulic, lighting, and restraint faults, to determine if it triggers an automatic critical flag.
3
Schedule and Redundancy Cross-Referenced
The asset's current or upcoming turnaround assignment and the number of available backup units at that stand are pulled in to weigh turnaround impact and asset criticality.
4
Failure Risk Estimated
Inspection history and any relevant sensor trend data for that asset are factored in to estimate how quickly the reported fault is likely to progress.
5
Ranked and Routed
The combined score places the ticket into its priority tier and routes it to the appropriate technician queue with the response-time target already attached.
CASE SCENARIO
What Changes When a Belt Loader Ticket Gets Ranked Correctly
Before Scoring
A belt loader assigned to a 35-minute international turn develops a slow hydraulic drift on its lift arm. The defect is logged as ticket 41 of 47 open items, ranked purely by submission time, and sits behind twelve lower-stakes tickets filed earlier that shift. The unit is pulled from service mid-turn when the drift worsens, forcing a scramble for a backup and a delayed pushback.
After Scoring
The same defect is logged and immediately scored against its active turnaround assignment and the stand's lack of an available backup loader, placing it in the Critical tier within seconds. A technician is dispatched before the current turn begins, the lift arm is serviced during the aircraft's scheduled ground time, and the turn proceeds without a substitution scramble.
GETTING STARTED
What a Prioritization Rollout Looks Like
Standing up a scored prioritization system does not require replacing your existing work order intake process, only adding the scoring logic behind it. The checklist below outlines the groundwork most airport maintenance teams complete before their first scored queue goes live.
Map Fleet Redundancy by Stand
Document which stands and terminals have backup units available for each GSE type, so criticality scoring reflects real coverage rather than assumptions.
Define Safety-Critical Fault Categories
Agree with your safety team on which fault types automatically trigger a critical flag regardless of other scoring factors.
Connect Schedule and Assignment Data
Link current GSE-to-flight assignments so turnaround impact scoring reflects which units are actively tied to upcoming turns.
Pilot on One Terminal or Fleet Type
Run scored prioritization on a single terminal or equipment category first, giving your team time to validate the tier thresholds before a full rollout.
FREQUENTLY ASKED QUESTIONS
Questions Airport Maintenance Teams Ask About GSE Prioritization
How is a priority score different from just marking tickets urgent, high, or low manually?
Manual urgency tags depend entirely on the judgment of whoever files or reviews the ticket, and that judgment varies by shift, by supervisor, and by how much context that person has about fleet redundancy or schedule assignments at the moment they triage it. A calculated priority score applies the same four factors, safety exposure, turnaround impact, asset criticality, and failure risk, consistently to every ticket, which means two identical faults on two different assets are scored on their actual operational consequence rather than on who happened to be watching the queue. This consistency also creates an audit trail, since every score can be traced back to the specific factors that produced it.
Book a demo to see how your current tagging compares against a calculated score on the same tickets.
Does the scoring model account for equipment that has no backup unit at all?
Yes, asset criticality is one of the four core scoring factors specifically because single-point-of-failure equipment carries a different risk profile than a unit backed up by several spares at the same stand. A fault on a GPU with no nearby backup will score meaningfully higher on criticality than an identical fault on a duplicated unit, even before turnaround assignment or safety exposure are factored in. This prevents a technically minor defect on a critical, unbacked asset from getting buried behind higher-volume but lower-consequence tickets.
Contact our support team to walk through how redundancy mapping works for your specific fleet mix.
Can the priority tiers and response-time targets be adjusted to match our airport's specific operations?
The four-tier structure, Critical, High, Medium, and Low, along with their default response-time targets, is meant as a starting framework rather than a fixed rule, since a cargo-heavy operation and a high-frequency regional hub can have different tolerances for how quickly a Medium-tier fault needs attention. Most teams pilot the default thresholds on one terminal or fleet type first, then adjust the specific time targets and, in some cases, the weighting between factors, once they've seen how the scores align with how their supervisors would have triaged the same tickets manually.
Book a demo to discuss tier thresholds that fit your operation.
Where does the failure risk portion of the score come from if a fault has never happened on that asset before?
Failure risk draws on a combination of that specific asset's inspection and repair history and, where available, sensor trend data such as hydraulic pressure drift, vibration, or temperature readings that indicate a defect is progressing rather than stable. For an asset with limited history, the model leans more heavily on the fault category itself, since certain fault types, like hydraulic drift or brake wear, have well-established progression patterns across similar equipment even without asset-specific history. As more inspection and repair data accumulates for that unit, the risk estimate becomes increasingly specific to its own behavior.
Contact our support team to see what inspection data is needed to activate failure risk scoring.
Does prioritized scoring replace routine preventive maintenance scheduling, or work alongside it?
Prioritized scoring is built to work alongside routine preventive maintenance rather than replace it, since PM scheduling handles planned, calendar-based service while scoring handles the unplanned faults and defects that arrive unpredictably throughout the day. In practice, a well-scored queue actually protects PM schedules by keeping true emergencies from repeatedly bumping planned maintenance windows, since Critical and High-tier faults are routed to available capacity rather than displacing whatever PM work was already booked.
Book a demo to see how scored work orders and PM scheduling run together in one queue.
Stop Working GSE Tickets in the Order They Arrived
iFactory scores every open work order against safety, turnaround impact, criticality, and failure risk automatically, so your team always knows which unit to fix next. Book a demo to see it running against your own fleet's backlog.