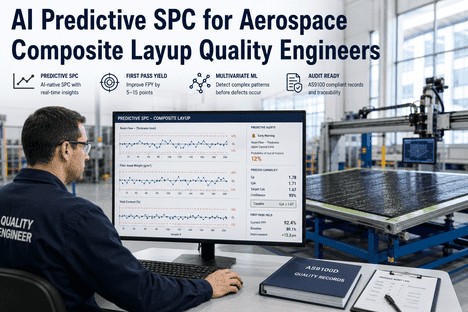
You are at Ply 22. The AFP cell has been running clean for six hours. First-pass yield this shift: 91%. Acceptable — but not where it needs to be. Two panels in the last fortnight went to scrap post-cure, each traced back to fibre orientation drift that was measurable at Ply 8. No alert fired. No correction was made. The process looked fine on the chart. The chart was lying. Predictive OEE changes that equation — by connecting the quality metric that matters most, first-pass yield, to the process intelligence that can actually move it: AI-native SPC, self-tuning control limits, and real-time defect detection that flags deviation before it becomes scrap.
Predictive OEE · First Pass Yield · Composite Layup · AS9100
Raise First-Pass Yield 5–15 Points in Aerospace Composite Layup With Predictive OEE
iFactory's predictive OEE platform combines AI-native SPC and self-tuning control limits to surface process deviation before it reaches the autoclave — and before it destroys your yield number.
85%+
World-class OEE benchmark — the threshold that separates top-quartile aerospace operations from the 60–75% average seen across discrete manufacturing
5–15pt
First-pass yield improvement achievable when predictive OEE replaces static SPC — by catching drift before cure, not after the panel is already committed
6.3%
CAGR projected for smart composite layup systems through 2035, driven by production rate acceleration across narrowbody, widebody, and next-gen defence programmes
What Predictive OEE Actually Means for an Operator on the AFP Cell
OEE — Overall Equipment Effectiveness — is calculated by multiplying three factors: Availability, Performance, and Quality. In composite layup, the Quality factor is first-pass yield: the proportion of panels that exit the process meeting specification without rework or scrap. For most composite layup operations, Quality is the dominant OEE constraint. Availability is controlled through scheduling. Performance is governed by AFP machine parameters. But Quality — specifically, first-pass yield — is lost to process drift that operators cannot see in time to prevent.
Predictive OEE addresses the Quality factor directly. Instead of measuring yield after the panel is cured — when the defect is already locked in — predictive OEE uses AI-native SPC to track the quality distribution in real time, ply by ply, and surface deviation trends before they cross into out-of-tolerance territory. The result is a Quality score that operators can actually influence during production, not a number they can only report after the loss has occurred.
OEE Quality Factor: What the Numbers Mean in Composite Layup
88%
Reactive Quality
Post-cure inspection catches defects. Scrap and rework absorb 12% of output. Static SPC triggers alerts too late or too often to act on.
93%
In-Process Inspection
Vision systems flag defects mid-ply. Rework rate drops. But limits are still static — drift accumulates across panels before correction.
97%+
Predictive OEE
Self-tuning limits detect drift before tolerance breach. Operators correct AFP parameters in real time. First-pass yield becomes the baseline, not the ceiling.
The Three Hidden Yield Killers in Composite Layup — And How Predictive OEE Stops Each One
First-pass yield losses in composite layup do not arrive suddenly. They accumulate through gradual process drift that static systems are not designed to catch. Three mechanisms account for the majority of quality losses — and all three are addressable before cure when predictive OEE is in place.
Yield Killer 01
Fibre Orientation Drift
Fibre orientation deviation accumulates tow by tow across a ply. By the time a single pass exceeds the UCL, the underlying shift has been building for 8 to 15 passes — each one compounding the structural risk of the cured panel. The orientation error that causes post-cure rejection was detectable, and correctable, long before the ply was complete.
Predictive OEE flags the drift trend at pass 3–4, not pass 14
Yield Killer 02
Gap and Overlap Accumulation
Tow-to-tow gap and overlap variations are structurally significant in primary aerospace composites. A single panel may contain hundreds of tow placements — each a potential gap or overlap event. When AFP head wear or material tack variation shifts the gap distribution, the change is gradual and cumulative. Static UCL does not tighten to reflect the shift; it simply waits for the cumulative effect to breach a fixed threshold set months ago.
Self-tuning limits narrow with the process distribution in real time
Yield Killer 03
Cure Commitment With Stale Data
The decision to commit a panel to an 8–48 hour autoclave cycle should rest on the best available evidence of its current quality state. When the quality decision is based on a Cpk from last quarter's qualification and a visual check under time pressure, borderline panels get cured. Predictive OEE provides a current-state Cpk for every measured characteristic at the moment of the cure decision — a data-backed basis that reduces post-cure scrap to near zero on panels that were measurably on-target going in.
Live Cpk at cure authorisation — not qualification-era estimates
AI-Native SPC · Self-Tuning Limits · Live Cpk
The Panel You Commit to Cure Right Now — Does Your Cpk Reflect the Process Running Today, or Six Months Ago?
iFactory's predictive OEE platform updates Cpk in real time, ply by ply — so every cure authorisation is based on current-state process data, not frozen qualification baselines.
How iFactory's Predictive OEE Engine Works at the Layup Cell
Predictive OEE in composite layup is not a single system — it is the integration of three capabilities that must work in sequence: data capture at the required resolution, AI-native analysis that distinguishes signal from noise, and an operator interface that converts analysis into action. iFactory delivers all three as an integrated platform.
Step 01
Continuous Ply-Level Measurement
AI vision arrays measure gap width, fibre orientation, overlap dimension, and surface height deviation at every tow pass — not as an end-of-ply snapshot but as a continuous data stream. Each measurement is tagged with its ply coordinate, material batch ID, AFP head hours, and ambient conditions. This metadata is the input the predictive model needs to separate genuine process deviation from environment-driven noise. Without it, the model cannot distinguish a real gap trend from the expected tack shift caused by a 3°C drop in layup room temperature at shift change.
Sub-mm resolution per pass
Environmental metadata tagging
Batch and head-hours context
Step 02
Self-Tuning Control Limits and Live Cpk
The multivariate ML model processes the incoming measurement stream against the current process model — recalculating UCL and LCL from live data rather than frozen qualification baselines. Limits narrow when the process is stable, widen appropriately for steering-zone geometry, and adjust immediately when a new material batch or AFP head change shifts the process distribution. Cpk updates with every new ply measurement. Cross-panel trend detection identifies whether a gap distribution drifting right across six consecutive panels is an AFP head parameter issue or a material batch characteristic — reducing root cause investigation time from days to under an hour.
Per-ply Cpk update
Geometry-zone-aware UCL/LCL
Cross-panel drift trending
Step 03
Operator Alert and Yield Dashboard
The operator display shows live Cpk for each quality characteristic, colour-coded capability status (green / amber / red), the current control chart with self-tuning limits visible, and a shift-level OEE Quality score that updates in real time. Alerts fire before the limit is breached — when the trend is heading toward the control boundary — giving operators time to adjust AFP parameters and prevent the out-of-tolerance condition. Each alert includes the specific characteristic drifting, its current value, the limit it is approaching, and a suggested AFP parameter correction from the historical correction database. The result is a yield dashboard that operators can act on, not just read.
Pre-breach drift alert
Live OEE Quality score
Suggested AFP correction
From 91% to 97%: What a First-Pass Yield Gain Actually Delivers
A 6-point improvement in first-pass yield sounds like a quality metric. It is also a production capacity metric, a cost metric, and a schedule risk metric — all in one number. The table below shows what a realistic first-pass yield gain from predictive OEE delivers across a composite aerostructure production programme running 200 panels per month.
Impact Area
91% FPY
97% FPY
Gain
Panels to scrap or rework per month
18 panels
6 panels
–12 panels
Effective output delivered to schedule
182 panels
194 panels
+12 panels
Autoclave rebook events from rework
8–10 / month
2–3 / month
–70%
OEE Quality contribution to overall OEE
0.91 factor
0.97 factor
+6.6pt OEE
What Self-Tuning Limits Do That Static SPC Cannot
The term "predictive" in predictive OEE is earned specifically by the self-tuning control limit architecture. Traditional SPC fixes the UCL and LCL at qualification and holds them until the next formal process review. Self-tuning limits update continuously from live production data. The difference in practice is significant for four reasons that aerospace composite operators encounter every production week.
Material Batch Transitions Are Detected and Absorbed
A new prepreg batch arriving mid-production run shifts tack and drapability distributions from the pattern the static limits were calibrated on. Self-tuning limits detect the step-change in the process distribution within the first three to five ply passes of the new batch and update the control model before a systematic gap pattern accumulates into a yield loss.
AFP Head Wear Is Tracked as a Continuous Drift, Not a Sudden Event
Compaction roller wear increases gap width at tow edges gradually over the life of a head assembly. Static limits flag this only when cumulative drift crosses the original qualification sigma. Self-tuning limits tighten around the live process distribution, surfacing the drift trend and triggering a maintenance alert before any panel is produced out of tolerance.
Seasonal and Intraday Temperature Variation Is Separated from Signal
Prepreg tack varies measurably with layup room temperature and humidity — both of which change seasonally and intraday. A programme qualified in January produces different gap distributions in July. Self-tuning limits condition on environmental inputs, removing false alarms driven by expected seasonal variation and keeping operator attention on genuine process deviation.
Steering Zones and Flat Regions Get the Limits They Actually Need
Fibre orientation deviation is not uniform across a part. Steering sections and tight-radius zones produce systematically higher deviation than flat regions. A global UCL applied across the whole ply surface generates constant false alarms in steering zones and misses real deviation in flat zones. Self-tuning limits apply geometry-aware control models — calibrated to the ply coordinate geometry, not averaged across it.
"
Our static limits were generating alerts on the steering sections every third panel. Operators had learned to ignore them — they treated every amber as expected variation. When a genuine fibre orientation shift appeared on a flat section, it went unnoticed until post-cure NDT flagged the panel. The root cause was a compaction roller condition issue that had been present for two weeks. Predictive OEE would have flagged it on day one. We ran three panels through cure with a drift that was already visible in the pass-level data.
— Quality Systems Engineer, Primary Aerostructures — Fuselage Panel Programme
AS9100 and the Audit Trail That Predictive OEE Builds Automatically
First-pass yield improvement is the operational benefit of predictive OEE. AS9100 compliance is the documentary benefit — and for aerospace programmes under customer or regulatory audit, the two are inseparable. Clause 8.5.1 requires evidence of process control under defined operating conditions. Clause 8.6 requires documented basis for product release. Clause 10.2 requires documented root cause and corrective action for nonconformances.
iFactory's predictive OEE platform generates the data record for all three — automatically, at the point of production, without additional manual data entry. Every ply measurement, every control limit update, every alert event, every operator correction, and every cure authorisation decision is logged with its full process context. The build record is exportable in PDF and structured data formats for delivery data packages and audit submissions. For AS9100-registered operations facing NADCAP composite layup audits, this record replaces weeks of manual data compilation with an exportable file that is already correct and complete.
AS9100 Clause 8.5.1
Continuous evidence of process control under defined operating conditions — generated automatically from live ply data, not assembled manually pre-audit
AS9100 Clause 8.6
Documented basis for product release at cure authorisation — current-state Cpk per characteristic, not a static chart from the qualification run
AS9100 Clause 10.2
Root cause and corrective action linked to specific process parameters — cross-panel pattern detection reduces investigation from days to under one hour
Conclusion
First-pass yield in aerospace composite layup is not a post-production metric — it is a real-time process state that operators can influence on every shift, at every ply, if the quality system gives them the right signal at the right time. Predictive OEE connects the Quality factor of OEE directly to the process intelligence that can move it: AI-native SPC that captures deviation at sub-mm resolution, self-tuning control limits that remain statistically valid as process conditions evolve, and an operator interface that turns complex process data into a correction action in seconds.
The composite layup operations that consistently achieve and sustain first-pass yields above 95% share one characteristic: their operators can see the process trending before it drifts out of tolerance, and they have clear, data-backed guidance on what to adjust. Predictive OEE delivers exactly that — and builds the AS9100-compliant documentation record as a by-product of normal production, not as an additional administrative burden.
iFactory's predictive OEE platform is purpose-built for AFP and manual composite layup operations — integrating with existing AFP controllers and MES systems to deliver live adaptive Cpk, self-tuning SPC limits, and automated AS9100 build records without changing the operator workflow. Book a Demo to see predictive OEE running on a composite layup use case matched to your part geometry and process profile, or Talk to an Expert to discuss first-pass yield targets for your specific programme.
Every Ply Is a Yield Decision. Make It With Current-State Data, Not Last Quarter's Qualification.
iFactory predictive OEE — live Cpk, self-tuning SPC limits, pre-breach operator alerts, and automated AS9100 build records for composite layup operations.
Frequently Asked Questions