Predictive SPC in Aerospace Avionics: Quality Engineers Playbook
By Grace on June 15, 2026
Every quality engineer in aerospace avionics knows the sequence: the control chart shows a point beyond the 3-sigma limit, the Western Electric rule triggers an alert, and the investigation confirms that a process shift occurred. The problem is that every element of this sequence happens after the fact. The point appeared on the chart because the defect was already produced. The Western Electric rule detected non-random variation in data that described the past. The investigation reconstructed a process state that no longer exists. By the time the corrective action is written, the next 20 to 50 boards have already moved through the line under the same shifted conditions. Predictive SPC breaks this sequence by inverting the timeline — instead of detecting what the process did, it forecasts where the process is heading. The quality engineer sees the Cpk trend projected 10, 50, and 100 boards forward, and intervenes before the capability index crosses the 1.67 threshold. This is the playbook for deploying predictive SPC on avionics lines where reactive quality management is no longer acceptable.
ML-Driven Forecast · Real-Time Cpk · Predictive Western Electric Rules · Closed-Loop Quality
Traditional SPC Tells You What the Process Did. Predictive SPC Tells You What It Will Do Next — and Gives You Time to Act Before Cpk Drops Below 1.67.
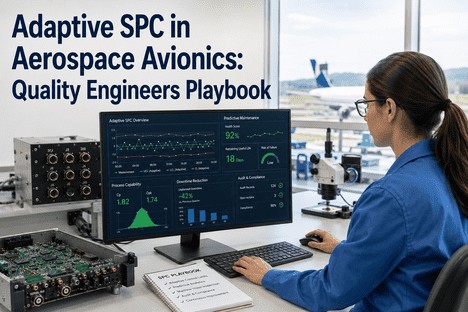
iFactory's predictive SPC platform gives quality engineers ML-driven process forecasts that project Cpk 10, 50, and 100 boards forward — so you intervene before the capability index crosses the threshold, not after the defect record is opened.
Sustainable Cpk on critical avionics parameters achieved with continuous predictive SPC — versus the 1.33 threshold that static SPC can barely maintain between quarterly capability studies
92%
Cpk forecast accuracy at the 8-hour shift horizon demonstrated by ML-driven predictive SPC models trained on avionics process and quality data
50–70%
Reduction in out-of-control events flagged by predictive SPC versus traditional reactive SPC — because forecasts enable correction before the process breaches control limits
30–50%
Scrap rate reduction documented across aerospace electronics production lines deploying predictive SPC with ML-driven process forecasting and real-time Cpk
The Predictive SPC Advantage — Four Dimensions Where Forecasting Changes the Quality Engineer's Workflow
Predictive SPC does not replace traditional SPC — it extends it by adding a forward-looking layer that the original control chart methodology was never designed to provide. The difference operates across four distinct dimensions of the quality engineer's workflow, and each dimension delivers a measurable improvement in detection speed, capability visibility, or scrap reduction. The upgrade from reactive to predictive in each dimension is shown below.
Dimension 01 — Detection Timing
Traditional SPC
Reactive. Control chart signals a shift after the defect data is recorded. Typical detection latency: 2 to 4 hours from the process event to the alert. By the time the shift is confirmed, 20 to 50 additional boards have passed through the shifted process.
→
Predictive SPC
Predictive. ML model forecasts the Cpk trajectory 10, 50, and 100 boards forward based on multivariate process parameter patterns. Alerts fire when the forecasted Cpk crosses the threshold — before the physical defect is produced. Lead time: 2 to 4 hours.
Delta: 2 to 4 hours earlier detection — defects prevented rather than counted
Dimension 02 — Cpk Visibility
Traditional SPC
Batch. Cpk is calculated at the end of a production run, shift, or sampling interval. The quality engineer reviews capability after the fact — if Cpk fell during the run, the record shows the drop but cannot influence the parts already produced.
→
Predictive SPC
Continuous. Cpk is recalculated per board and displayed on the dashboard with a forecasted trajectory. The quality engineer sees not just the current Cpk but the projected Cpk at current drift rate — enabling intervention before the 1.67 threshold is breached.
Delta: Real-time Cpk visibility with forward projection — data-driven decisions, not end-of-run reports
Dimension 03 — Model Inputs
Traditional SPC
Univariate. Each quality characteristic is monitored independently against its own control limits. Cross-parameter interactions — the relationship between solder paste volume and reflow zone temperature, for example — are invisible until they produce a defect that appears on one of the individual charts.
→
Predictive SPC
Multivariate. ML models ingest 15 to 20 process parameters simultaneously — SPI data, placement offset, reflow zone temperatures, conveyor speed — and detect interaction patterns that univariate charts miss. The model identifies the parameter combination most likely to produce the next defect event.
Delta: Multivariate pattern detection — defects predicted from parameter interactions, not individual limit breaches
Dimension 04 — Control Limits
Traditional SPC
Static. UCL and LCL calculated during the last capability study and reviewed quarterly or annually. Limits do not adjust for material batch changes, tool wear progression, or environmental drift. False alarm rate increases as the process drifts away from the study baseline.
→
Predictive SPC
Dynamic. Control limits are recalculated continuously by the ML model based on the current process baseline. When a new solder paste batch is introduced or a reflow zone drifts, the limits transition to the new normal without generating false alarms. Each limit change is logged with the statistical rationale for audit.
Delta: Dynamic limits that move with the process — 50-70% fewer false alarms, every alert actionable
Cpk Forecast Horizons — How Far Ahead Predictive SPC Sees the Process Trajectory
Predictive SPC does not produce a single forecast at a single horizon. It projects the Cpk trajectory at multiple time scales simultaneously, each serving a different quality engineer decision. The forecast accuracy varies with the prediction horizon — shorter horizons use high-frequency process data, while longer horizons incorporate material batch and product variant transition information. The four horizon cards below show what the quality engineer sees at each time scale.
Board-Level
99%
per-board accuracy
Cpk calculated from the current board's AI vision and SPI data. Forecast matches actual inspection outcome within 1 percent. Used for immediate process adjustment decisions.
Data: AI vision + SPI per board
Hour-Ahead
96%
60-min forecast accuracy
ML model projects Cpk trajectory from current process drift trends. Sufficient lead time to adjust reflow temperature, placement force, or paste deposition before the next batch of boards enters the affected process step.
Data: Real-time process trends
Shift-Ahead
92%
8-hour forecast accuracy
ML model trained on historical process-to-quality data projects Cpk across the full shift. Used for shift planning — prioritising product variants, scheduling interventions, and allocating quality engineering attention to the parameters with the highest forecasted Cpk risk.
Data: ML model + historical patterns
Day-Ahead
88%
24-hour projection accuracy
Long-horizon projection incorporating scheduled product variant changes, material batch transitions, and preventative maintenance events. Provides quality engineering management with forward visibility for weekly planning and resource allocation.
Reactive SPC Counts Defects. Predictive SPC Prevents Them. The Difference Is a Cpk That Never Drops Below 1.67.
iFactory's predictive SPC platform for aerospace avionics quality engineers — ML-driven process forecasting at four prediction horizons, continuous Cpk with forward projection, dynamic control limits that eliminate false alarms, and AS9100-ready audit records generated from every board the line produces.
The Predictive SPC Engine — From Raw Data to Cpk Forecast in Four Stages
The transformation from reactive to predictive SPC is accomplished by a four-stage engine that ingests the same data the quality team already collects and processes it through an ML layer that traditional SPC software was never designed to support. The engine operates continuously, evaluating every board, updating every forecast, and recalculating every Cpk without requiring any quality engineer intervention to maintain the cycle.
1
Collect — Real-Time Process Data
Every board on the avionics SMT line generates a data record at every critical process step — solder paste inspection volume and height, pick-and-place offset per component, reflow oven zone temperature profile, and AOI result. The predictive SPC engine ingests this data in real time through standard industrial communication protocols, pairing each measurement with the board serial number for per-unit traceability. No additional sensors or data infrastructure are required beyond what the line already produces.
2
Model — ML Defect Prediction
An ensemble ML model — combining Random Forest, XGBoost, and LSTM network architectures — analyses the multivariate parameter pattern for each board and computes a defect probability per IPC Class 3 defect category. The model is trained on the historical record of process parameters paired with quality outcomes, and it continuously retrains as new production data accumulates. The output is a per-board defect probability score that updates with every new measurement.
3
Forecast — Cpk Trajectory Projection
The defect probability scores are aggregated per quality characteristic and used to project the Cpk trajectory at four forecast horizons — board-level, hour-ahead, shift-ahead, and day-ahead. The Cpk projection incorporates the current process drift rate, the scheduled product variant changes, and the material batch transition plan. The quality engineer sees not just the current Cpk value but the forecasted value at each horizon, with the confidence interval displayed alongside the projection.
4
Act — Alert, Adjust, or Escalate
When the forecasted Cpk for any characteristic crosses the configured threshold, the engine triggers a tiered response. For Cpk trending toward 1.67: an alert is sent to the quality engineer dashboard with the primary parameter driving the trend. For Cpk trending toward 1.33: the system initiates a corrective action workflow and notifies quality engineering management. For Cpk below 1.00: production is halted automatically and the event is escalated. Every forecast, alert, and action is logged for AS9100 audit.
Deploying Predictive SPC — Three-Phase Implementation for Quality Engineers
Deployment follows a three-phase sequence designed to produce measurable improvements in Cpk visibility at each stage. The quality engineer sees value from Phase 1 — the shift from batch to continuous Cpk — while the full predictive capability builds through Phase 2 and Phase 3.
Phase 01
Data Foundation + Continuous Cpk
01
The data pipeline is established to stream SPI, placement, reflow, and AOI data from the avionics line into the predictive SPC engine. Control limits transition from quarterly static values to continuously recalculated dynamic limits. The quality engineer dashboard goes live showing per-board Cpk for every monitored characteristic — the first time the quality team sees continuous capability rather than batch-end reports. The data from this phase also serves as the training foundation for the ML model in Phase 2.
Phase outcome: Continuous Cpk per characteristic with dynamic control limits on the quality engineer dashboard
Phase 02
ML Model + Forecast Deployment
02
The ML ensemble model is trained on the Phase 1 data foundation and deployed in shadow mode — generating Cpk forecasts alongside the continuous Cpk display without driving decisions. Forecast accuracy is validated against actual inspection outcomes over a 2 to 4 week period. Once the model demonstrates 92 percent or higher accuracy at the shift horizon, the forecast is promoted to a primary display element on the quality engineer dashboard. Western Electric rules are evaluated against both current and forecasted data simultaneously.
Phase outcome: Cpk forecast at 4 horizons with validated accuracy above 92%
Phase 03
Closed-Loop Cpk Management
03
The system is configured to automatically adjust process parameters when the forecasted Cpk trend crosses the configured intervention threshold — reducing reflow zone temperature, recalibrating placement force, or adjusting paste deposition pressure — without requiring quality engineer approval for adjustments within configured authority limits. Every forecast, every automatic adjustment, and every Cpk recalculation is logged with full traceability for AS9100 audit review. The quality engineer monitors the closed-loop system and intervenes only when the forecast confidence drops below threshold or the correction exceeds configured authority.
Phase outcome: Cpk sustained above 1.67 with closed-loop forecast-driven correction and full audit trail
"
The first time I saw a Cpk forecast on the dashboard, I assumed it was an extrapolation of the trend line — interesting but not actionable beyond what the control chart already showed. Then the system flagged that our solder paste volume Cpk would drop from 1.72 to 1.48 within the next 40 boards if the current drift in the SPI trend continued. I checked the paste printer calibration log. The squeegee pressure had drifted 12 percent below the target setting, and no one had noticed because the individual SPI measurements were still within specification. We corrected the pressure setting. The Cpk stabilised at 1.68 without a single defective board being produced. That was the moment I understood the difference between watching a control chart and using a predictive forecast. One tells you what already happened. The other tells you what to do next.
Statistical process control was designed in an era when data arrived in spreadsheets and analysis happened offline. The control chart methodology that quality engineers rely on today was developed to detect non-random variation in data that described the past — and the interventions it triggers are inherently reactive because the defect event has already occurred by the time the chart signals. Predictive SPC does not abandon this methodology. It extends it with a forecasting layer that the original designers could not have anticipated: ML models trained on the multivariate process data that every modern avionics line already generates, projecting Cpk trajectories forward at multiple horizons so the quality engineer can intervene before the capability index crosses the threshold.
The documented outcomes across aerospace electronics deployments confirm the pattern: Cpk sustained above 1.67 on critical characteristics, out-of-control events reduced by 50 to 70 percent, and scrap rates cut by 30 to 50 percent through interventions that happen before defects form rather than after they are counted. The quality engineer who operates with predictive SPC is not charting the past — they are forecasting the future, and that is the difference between managing capability and sustaining it.
iFactory's predictive SPC platform is purpose-built for quality engineers in aerospace avionics. Book a Demo to see the Cpk forecast dashboard configured for your avionics product mix and IPC Class requirements, or Talk to an Expert about a free predictive SPC assessment for your avionics line.
Frequently Asked Questions
Traditional SPC with Western Electric rules is fundamentally retrospective. The rules detect patterns — points beyond 3-sigma, runs, trends — in data that has already been collected and plotted. The quality engineer reviews the chart, identifies the rule violation, and investigates a process event that has already concluded. Predictive SPC adds a forward-looking ML layer that projects where each quality characteristic is heading based on the current multivariate parameter combination. Instead of asking "did the process shift?" — which can only be answered after the shift appears in the data — predictive SPC asks "is the process going to shift within the next 50 boards?" and answers with a forecasted Cpk value and confidence interval. The Western Electric rules continue to run on the current data for retrospective analysis; what changes is that the quality engineer now has a second set of indicators — forecasted rule violations — that fire before the defect occurs. The two systems run in parallel: traditional rules for historical pattern detection and predictive rules for forward-looking risk assessment. Book a Demo to see the parallel rule engine configured for your avionics parameters.
Forecast accuracy varies by prediction horizon and is validated through a structured shadow-mode protocol. The ML model generates Cpk forecasts in parallel with the existing quality system for a validation period of 2 to 4 weeks — no forecasts are displayed to the quality engineer or used for decisions during this period. Every forecast is logged alongside the actual Cpk calculated from physical inspection data for the corresponding boards. At the end of the validation period, accuracy is calculated per horizon: board-level forecasts (99 percent), hour-ahead forecasts (96 percent), shift-ahead forecasts (92 percent), and day-ahead projections (88 percent). These accuracy figures are documented in the validation report, which becomes part of the AS9100 quality records. The model is only promoted to active display after the validation confirms accuracy above the configured threshold for each horizon. Continuous accuracy monitoring continues after deployment, and if accuracy degrades below threshold — typically due to a product variant or material change that the model has not yet learned — the forecast is automatically withdrawn from the dashboard and the model retraining cycle is triggered. Talk to an Expert about forecast accuracy validation for your specific avionics product mix.
Predictive SPC requires the same data that the quality engineering team already collects for capability studies and SPC reporting — SPI measurements (solder paste volume, height, area), placement offset data from pick-and-place machines, reflow oven zone temperature profiles, and AOI pass-fail results linked by board serial number. The infrastructure gap, if one exists, is typically not in data collection but in data integration — these data sources are often stored in separate systems (SPI database, placement log, oven recorder, AOI database) without a common index that allows the ML model to correlate them. iFactory connects to each existing data source through standard industrial communication protocols and creates the integrated data layer in the predictive SPC engine. A minimum of three to six months of continuous production data with paired process parameters and quality outcomes is needed to train the initial ML model — the same data the quality team already has in their process historian and LIMS system. Book a Demo to see a data infrastructure assessment for a typical avionics SMT line.
Yes. Predictive SPC manages product mix through a variant-aware architecture where each PCB assembly is registered as a separate production context with its own specification limits, Cpk targets, and defect history. When the line transitions between variants — signalled automatically from the PLC or entered through the operator interface — the predictive SPC engine loads the correct specification profile and recalibrates the ML model to the new variant's parameter ranges. The forecast accuracy for the first board of a new variant is based on the similarity-weighted ensemble of historical data from similar variants, and it improves as the model accumulates production data from the current run. This approach eliminates the false alarm spike that traditional SPC generates during changeover windows when static limits encounter a different board layout with different component types and solder joint geometries. The quality engineer's dashboard shows Cpk per variant, with variant-specific control limits and forecast horizons, so a multi-variant production schedule is managed from a single view without manual reconfiguration between changeovers. Talk to an Expert about configuring multi-variant predictive SPC for your avionics production schedule.
Predictive SPC generates AS9100-compliant documentation from every board the line produces without requiring any additional data entry from the quality team. The documentation includes: continuous Cpk trend reports per characteristic per product variant with the control limit change log showing every dynamic limit adjustment and its statistical rationale; Western Electric rule violation records with both the historical data and the forecast data that triggered each violation; corrective action records linked to the specific forecast event and parameter state at the time of the forecast; and a complete audit trail showing every board serial number with its associated process parameters, forecast outcomes, and inspection results. For NADCAP submissions, the system generates process control documentation packages that include the control chart history, capability index records, and process parameter traceability required for process approval. Audit preparation shifts from days of manual data compilation to a single export covering any date range, product variant, and monitored parameter — with the documentation structure already formatted for direct inclusion in AS9100 or NADCAP submission packages. Book a Demo to see a sample AS9100 audit export from an active avionics predictive SPC deployment.
Stop Auditing History. Start Forecasting Capability. Get a Free Predictive SPC Assessment for Your Avionics Line.
iFactory's predictive SPC platform for aerospace avionics quality engineers — ML-driven process forecasting with Cpk projection at four horizons, dynamic control limits that eliminate false alarms, and AS9100-ready audit records generated from every board your line produces. Built for quality engineers who need to sustain 1.67+ Cpk through prediction, not reaction.