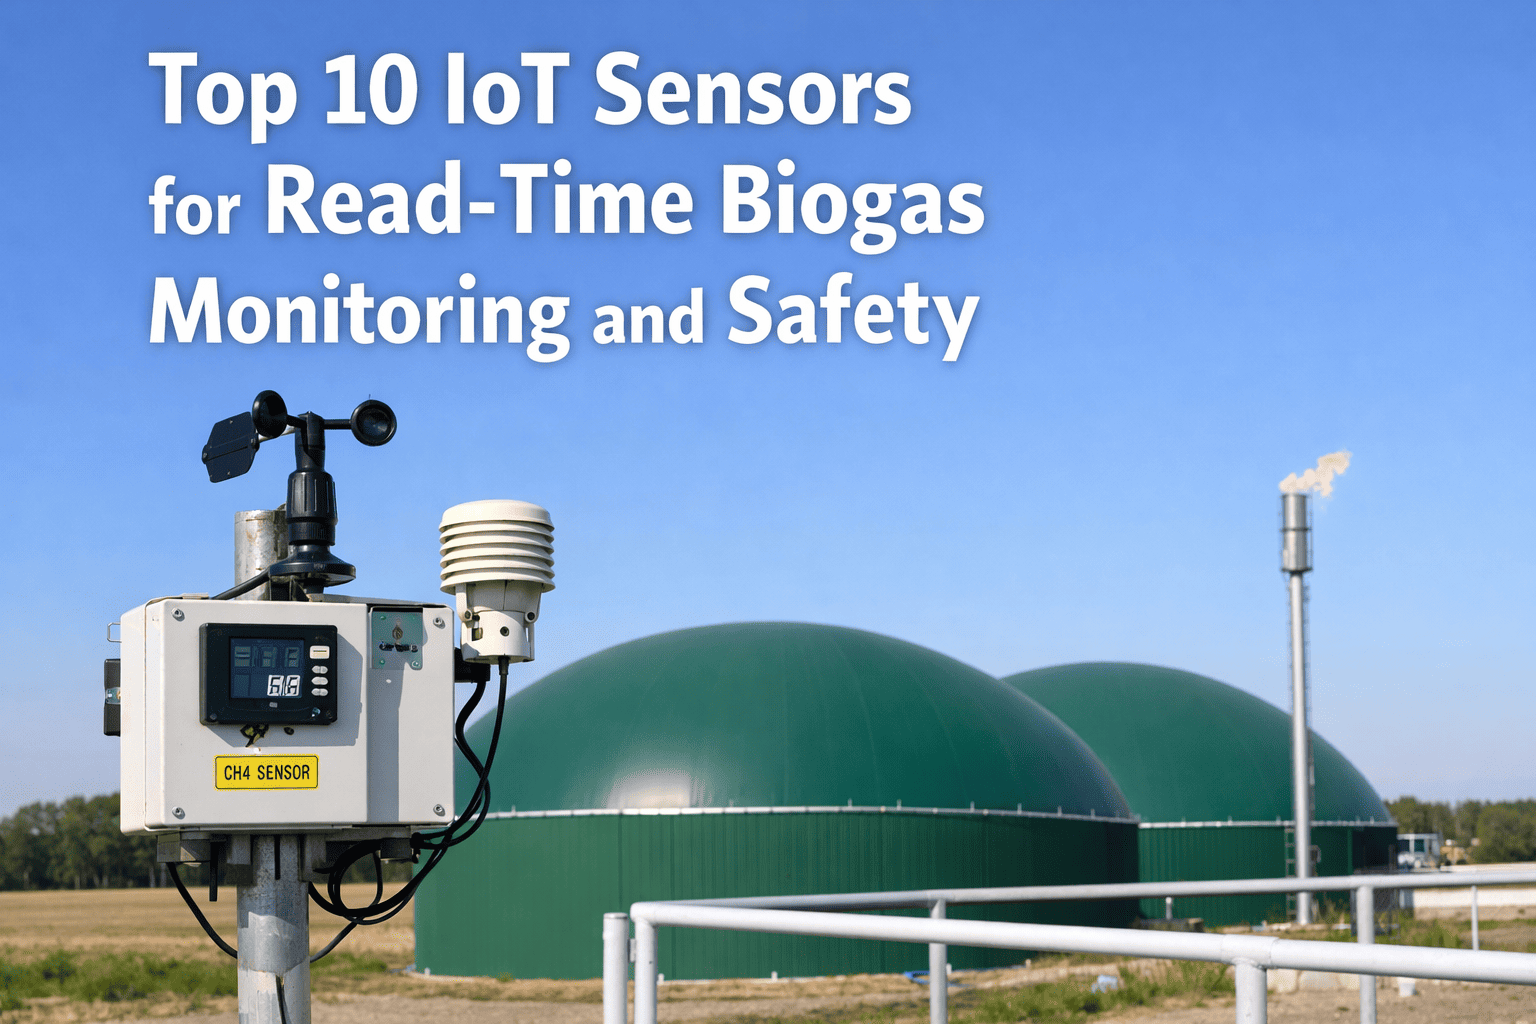
In 2023, a biogas plant operator in Denmark discovered a critical pH crash in his digester — 14 hours after it happened. By then, the microbial community had collapsed, volatile fatty acids had spiked past 8,000 mg/L, and the recovery took 19 days. Total cost: €47,000 in lost production and emergency interventions. Eight months later, the same plant installed a network of smart IoT sensors with AI-driven analytics. When a similar pH drift began, the system flagged it within 11 minutes — before VFA levels crossed the warning threshold. An automated feed rate adjustment prevented the crash entirely. Zero downtime. Zero lost revenue. The difference wasn't better operators. It was better data, delivered faster.
Smart Sensor Intelligence for Biogas
You Can't Optimize What You Can't See.
Start Seeing Everything.
The global IoT sensor market is growing at 34.4% CAGR, projected to reach $70B by 2029. In industrial energy, smart sensors are no longer optional infrastructure — they're the nervous system of every high-performing biogas plant.
$42.2B
Smart sensor market size, 2025
29B+
Connected IoT devices projected by 2030
25%
Maintenance cost savings with predictive IoT
70%
Downtime reduction via sensor-based analytics
Sources: Mordor Intelligence 2025 · Markets and Markets 2025 · GSMA Intelligence 2023 · Siemens 2024
The Visibility Crisis in Biogas Operations
Most biogas plants operate with alarming blind spots. Operators rely on periodic lab samples taken every 24-48 hours, manual gauge readings, and gut instinct to manage a biological process that shifts by the minute. Between those sample points, the digester is essentially unmonitored — and that's exactly where problems develop.
What Traditional Monitoring Misses
24-48 hrs
Gap between lab samples — pH can crash in under 6 hours
4-8 hrs
Typical delay before operators notice gas flow anomalies manually
2-3 days
Average time to detect ammonia inhibition without continuous monitoring
7-19 days
Recovery time from a digester upset that could have been prevented
0%
Visibility into microbial community shifts between sample cycles
What Smart Sensors Reveal
Every 10s
Continuous pH, temperature, and pressure readings streamed to AI
Every 30s
Gas composition analysis — CH4, CO2, H2S concentrations in real time
Every 1m
Flow rate trends with anomaly detection flagging deviations instantly
Every 5m
Predictive VFA accumulation alerts — hours before critical thresholds
24/7
Continuous correlation analysis across all parameters simultaneously
Running your biogas plant on periodic samples and manual checks? See what continuous IoT monitoring looks like in action.
The Sensor Stack: What a Smart Biogas Plant Monitors
A fully instrumented biogas plant doesn't just measure temperature and pH. It builds a complete digital picture of the digestion process — from feedstock intake to gas output to digestate quality. Each sensor feeds a data stream that, when correlated with others by AI, reveals patterns no single measurement can show alone.
Temperature Probes
PT100/PT1000 RTD sensors at multiple depths. Mesophilic range: 35-42°C with ±0.1°C precision. Temperature stratification detection prevents cold zones that kill methanogenic activity.
pH Sensors
Industrial-grade electrochemical probes rated for high-solids environments. Continuous monitoring between 6.5-8.0 with automated calibration cycles. First line of defense against acid crashes.
Pressure Transducers
Headspace pressure monitoring for gas production rate inference. Sudden pressure changes indicate foaming, blockages, or seal failures before they become emergencies.
Level Sensors
Ultrasonic or radar-based liquid level measurement. Tracks fill levels, foam height, and scum layer formation — critical for preventing overflow and maintaining hydraulic retention time.
NDIR Methane Analyzer
Non-dispersive infrared detection for continuous CH4 concentration measurement. Target range: 50-75%. Tracks methane yield in real time to validate feedstock blend performance.
CO2 Sensor
Complementary to CH4 measurement. Rising CO2:CH4 ratio is an early indicator of process stress — the AI flags ratio shifts before they manifest as yield drops.
H2S Detector
Electrochemical hydrogen sulfide monitoring. Critical for CHP engine protection (threshold: <200 ppm) and desulfurization system optimization. Corrosion prevention starts here.
Gas Flow Meter
Thermal mass or ultrasonic flow measurement. Tracks Nm³/hour with trend analysis. Flow rate is the ultimate output metric — every other sensor's value is validated against it.
ORP / Redox Sensors
Oxidation-reduction potential monitoring confirms true anaerobic conditions. Values below -300 mV indicate healthy methanogenic environments. Rising ORP signals oxygen intrusion.
Conductivity Probes
Tracks dissolved ion concentration as a proxy for VFA/alkalinity balance. Rapid conductivity increases correlate with ammonia buildup or salt stress.
Ambient Weather Station
External temperature, humidity, and solar radiation data. The AI correlates weather patterns with digester heat loss, feedstock moisture variation, and seasonal yield patterns.
Vibration Sensors
Mounted on pumps, mixers, and CHP engines for predictive maintenance. Bearing wear, impeller imbalance, and motor degradation detected weeks before failure.
From Raw Data to Actionable Intelligence
Sensors alone don't optimize a biogas plant — analytics do. The real transformation happens when AI correlates thousands of data points per minute across every sensor, identifies patterns invisible to human operators, and translates them into specific actions that improve yield, prevent downtime, and reduce cost.
Collect
Edge Data Acquisition
IoT gateways aggregate sensor streams via industrial protocols — OPC-UA, Modbus TCP, MQTT, 4-20mA. Data is timestamped, validated, and compressed at the edge before transmission. Bad readings are filtered; sensor drift is auto-detected.
10,000+
data points per digester per hour
Correlate
Multi-Variable Analysis
AI models simultaneously analyze temperature, pH, gas composition, flow rate, feed input, and weather data. Cross-correlation reveals hidden relationships — like how Tuesday's feedstock change affects Friday's methane output.
200+
variable interactions tracked simultaneously
Predict
Anomaly & Trend Forecasting
Machine learning models trained on your plant's specific behavior predict process deviations 6-24 hours before they impact production. Isolation Forest and LSTM networks detect subtle pattern shifts that rule-based alarms completely miss.
6-24 hrs
early warning before process deviation
Act
Operational Recommendations
The system delivers specific, time-bound instructions: adjust feed rate by X%, increase mixing duration by Y minutes, schedule desulfurization maintenance in Z days. Not dashboards — decisions.
<60 sec
from detection to actionable recommendation
Your Sensors Generate the Data. We Generate the Intelligence.
iFactory connects to any sensor vendor, any protocol, any SCADA system — and transforms raw readings into predictive insights and automated recommendations. No rip-and-replace. No vendor lock-in. Just a smarter plant from day one.
The Connected Plant: Architecture That Scales
A smart biogas plant isn't just sensors wired to a dashboard. It's a layered architecture where field devices, edge computing, cloud analytics, and operator interfaces work together — each layer adding intelligence to the one below it.
Operator Layer
Dashboards, Alerts & Mobile Access
Web and mobile interfaces deliver real-time plant status, KPI tracking, and push notifications to operators anywhere. Role-based views for plant managers, maintenance teams, and executives. Historical trend analysis and compliance reporting built in.
Cloud / Analytics Layer
AI Models, Benchmarking & Long-Term Storage
Machine learning models continuously retrain on your plant's data. Multi-site operators compare digester performance across facilities. Years of historical data enable seasonal pattern recognition and long-range forecasting. Secure, encrypted, and GDPR-compliant.
Edge Computing Layer
Real-Time Processing & Latency-Critical Decisions
Industrial edge gateways process sensor data locally for sub-second response times. Anomaly detection, feed rate adjustments, and safety interlocks execute on-site — even if cloud connectivity is lost. Edge AI models run inference without internet dependency.
Sensor / Field Layer
Physical Sensors, Actuators & Protocol Bridges
Temperature, pH, gas analyzers, flow meters, vibration monitors, and environmental stations feed data via OPC-UA, Modbus TCP, MQTT, or 4-20mA signals. Protocol converters normalize data from mixed-vendor sensor deployments into a unified data model.
Operating multiple biogas sites with different sensor vendors? See how iFactory unifies them into one analytics platform.
ROI of Going Smart: The Business Case
IoT sensor integration isn't a technology project — it's a profitability project. The numbers below represent documented outcomes from biogas plants that transitioned from periodic manual monitoring to continuous AI-driven sensor analytics.
Payback Period
6-9 Months
Smart sensor systems typically pay for themselves within the first year through reduced downtime, lower maintenance costs, and improved gas yield. The fastest ROI comes from preventing even a single major digester upset.
Downtime Reduction
70%
Predictive maintenance driven by vibration, temperature, and performance trend data catches pump failures, mixer issues, and CHP engine problems weeks before breakdown.
Maintenance Savings
25%
Shifting from calendar-based to condition-based maintenance eliminates unnecessary service intervals while catching real issues earlier — reducing both labor and parts costs.
Gas Yield Improvement
15-30%
Continuous process optimization through real-time sensor feedback keeps the digester in its optimal operating window consistently, not just when lab results arrive.
Labor Efficiency
40%
Automated monitoring replaces manual gauge checks and log entries. Operators focus on high-value decisions instead of data collection rounds.
Carbon Reduction
55 t/yr
Higher full-load hours, fewer process upsets, and optimized CHP operation directly reduce the carbon footprint per kWh generated — measurable in ESG reporting.
Why iFactory for Biogas IoT
01
Any Sensor. Any Protocol. One Platform.
OPC-UA, Modbus TCP, MQTT, EtherNet/IP, 4-20mA, HART — iFactory speaks every industrial language. Connect sensors from Siemens, Endress+Hauser, ABB, Honeywell, or any vendor without middleware. Your existing sensor investment is preserved; our intelligence layer adds on top.
02
Edge-First AI Architecture
Critical decisions happen at the plant, not in the cloud. iFactory deploys AI inference models directly on edge gateways for sub-second anomaly detection and automated responses. Cloud connectivity enhances analytics but is never a single point of failure.
03
Built for Biogas Complexity
Generic IoT platforms treat a biogas digester like any other asset. iFactory's models understand anaerobic digestion biology — VFA dynamics, C:N ratio impacts, methanogenic community behavior, and seasonal feedstock variation. Domain-specific AI, not retrofitted dashboards.
04
Multi-Site Portfolio View
Operating 3 plants or 30? iFactory normalizes data across every site into a single benchmarking dashboard. Compare digester performance, replicate winning strategies, and identify underperformers across your entire portfolio from one screen.
Every Minute Without Sensors Is a Minute Flying Blind
iFactory transforms your biogas plant from a black box into a transparent, predictable, and continuously optimizing operation. Connect any sensor, from any vendor, to one AI-powered analytics platform — and start seeing what you've been missing.
Frequently Asked Questions
What sensors are essential for a smart biogas plant?
At minimum, you need continuous monitoring of temperature (multiple depth points), pH, gas composition (CH4, CO2, H2S), biogas flow rate, and digester pressure. For full optimization, add ORP/redox sensors, conductivity probes, level sensors, and vibration monitors on mechanical equipment. The specific sensor mix depends on your digester type (wet vs. dry, mesophilic vs. thermophilic) and feedstock complexity.
Can iFactory work with sensors we already have installed?
Yes. iFactory is sensor-vendor agnostic. We connect to any industrial sensor that outputs data via standard protocols — OPC-UA, Modbus TCP, MQTT, 4-20mA analog signals, or HART. If your plant already has temperature probes, pH meters, or gas analyzers from any manufacturer, we integrate with them directly. You don't need to replace existing hardware to start getting AI-driven analytics.
How does edge computing differ from cloud-only IoT platforms?
Cloud-only platforms send all sensor data to remote servers for processing, which introduces latency (seconds to minutes) and creates dependency on internet connectivity. Edge computing processes data locally at the plant, enabling sub-second response times for critical alerts and automated control actions. iFactory uses a hybrid approach: edge AI handles real-time decisions on-site, while cloud infrastructure provides long-term analytics, benchmarking, and model retraining. Your plant stays intelligent even during network outages.
How many sensors does a typical biogas plant need?
A mid-scale biogas plant (0.5-2 MW) typically deploys 25-40 sensors across the digester, gas handling, CHP, and environmental monitoring systems. Larger or multi-stage plants may use 60-100+ sensors. The key is not quantity but strategic placement — monitoring the parameters that have the highest impact on yield, safety, and equipment life. iFactory helps you design the optimal sensor layout based on your specific plant configuration and operational goals.
What connectivity options are available for remote biogas plants?
iFactory supports multiple connectivity options to accommodate any site: cellular (4G/5G) for standard deployments, LoRaWAN or NB-IoT for low-power wide-area requirements, satellite IoT for extremely remote locations, and standard Ethernet/Wi-Fi for well-connected facilities. The edge gateway handles local processing regardless of backhaul connectivity, so your plant monitoring never depends on a single network link.