Cement plants have spent the last two decades digitizing individual departments, but the result in most cases is not a smart plant but a fragmented one where production, maintenance, energy, quality, and safety each run on separate software platforms that do not talk to each other. Operational excellence in this environment means optimizing one function at the expense of others, because nobody has the cross-domain data visibility to see the trade-offs. A true AI operational excellence suite does not add another application to the stack; it unifies the existing data streams into a single intelligence layer where a maintenance anomaly on the raw mill can be instantly correlated with a production rate drop, an energy spike, and a quality deviation in the same timeline. Book a platform integration review to see how iFactory unifies your plant data into a single operational excellence environment.
Five Siloed Systems Are Not Operational Excellence
Real operational excellence requires a single AI platform where production, maintenance, energy, quality, and safety data intersect, revealing the cross-domain correlations that fragmented software architectures were never designed to detect.
The Hidden Cost of Fragmented Plant Software
Most cement plants operate with a distributed control system for process control, a computerized maintenance management system for work orders, a laboratory information management system for quality data, an energy management system for fuel and power tracking, and a separate safety incident management platform. Each system serves its department well in isolation, but the boundaries between these systems are where the most valuable operational intelligence is lost. When data cannot flow freely across departmental lines, the plant operates with blind spots that fragmented dashboards cannot illuminate.
The Unified AI Architecture: One Platform, Five Domains
An operational excellence suite replaces the fragmented application model with a unified data architecture where all five core operational domains feed into a single AI analytics engine. The engine does not replace your existing DCS, CMMS, LIMS, or energy meters; it connects to them, normalizes their data into a common time base, and performs cross-domain correlations that are structurally impossible when data lives in separate databases. The visual structure below represents the flow from disconnected data sources through the unified AI layer to domain-specific and cross-domain insights.
Kiln DCS, mill controls, packing plant, dispatch systems
CMMS work orders, vibration monitors, lubrication logs, spare parts inventory
Real-time data ingestion, time-series normalization, cross-domain correlation, predictive modeling, automated reporting, and executive dashboards
Power meters, fuel flow meters, alternative fuel feeding systems, compressor controls
Lab analyzers, online particle size analyzers, safety observation logs, environmental emissions monitors
What AI Delivers in Each Operational Domain
Within the unified platform, each operational domain receives AI capabilities that go beyond what standalone departmental software can provide because every domain-specific insight is enriched by context from the other four domains. The five pillar descriptions below outline the core AI capability delivered to each operational function within the integrated environment.
Production intelligence in a unified platform tracks kiln feed rate stability, clinker factor trends, and cement mill throughput with minute-level granularity, but its real advantage is the ability to attribute every production deviation to a specific upstream cause. When clinker production drops, the AI does not simply report the tonnage loss; it checks whether the drop correlates with a raw mill stoppage from maintenance, a raw mix chemistry deviation from quality, a fuel switching event from energy management, or a kiln instability caused by a process control parameter drift. This root-cause attribution eliminates the hours of cross-departmental investigation that normally follow any significant production event and allows the production team to focus on corrective action rather than data gathering. The system also calculates optimal operating envelopes for different product types and fuel mixes, providing setpoint guidance that balances production rate against energy consumption and quality constraints simultaneously rather than optimizing one variable in isolation.
Maintenance intelligence moves from reactive work order management to predictive failure prevention by combining CMMS history with real-time sensor data from the DCS and dedicated condition monitoring systems. The AI calculates true mean time between failures for every critical asset, adjusted for current operating conditions rather than averaged across all historical conditions. When a vertical roller mill vibration trend begins to deviate from its baseline, the system cross-references the vibration pattern with the maintenance history to determine whether this signature matches a known failure mode such as roller bearing degradation or table liner wear, and it generates a specific maintenance recommendation with a confidence-rated time-to-failure estimate. Because the maintenance AI operates within the unified platform, it can also quantify the production and energy impact of a predicted failure, allowing the maintenance planner to prioritize work orders based on total operational risk rather than just equipment criticality ratings.
Energy intelligence provides real-time specific heat and specific power consumption tracking broken down by equipment, product type, and operating mode, but the unified platform enables energy optimization that respects production and quality constraints. When the AI identifies an opportunity to reduce specific heat consumption by adjusting kiln burner configuration, it simultaneously checks whether that adjustment would push clinker free lime outside the quality specification or reduce kiln production rate below the daily target. This constraint-aware optimization is impossible when the energy management system operates independently of the production and quality systems. The platform also tracks alternative fuel substitution rates in real time, correlating changes in alternative fuel mix with kiln stability, emission levels, and clinker quality to identify the optimal substitution envelope for each fuel combination available at the plant.
Quality intelligence in a unified platform connects laboratory results with the process parameters that produced them, creating a continuous feedback loop that enables proactive quality control rather than reactive quality inspection. When clinker free lime exceeds the target range, the AI does not simply flag the deviation; it traces the root cause backward through the process to identify whether the deviation originated from raw mix chemistry, kiln burning zone temperature, residence time changes, or cooler efficiency drops. This backward tracing is possible only because the quality system has real-time access to the same process data that the production system uses, eliminating the data alignment gaps that make root-cause analysis so time-consuming in fragmented environments. The AI also builds predictive quality models that forecast clinker and cement properties based on current raw material inputs and process conditions, allowing operators to adjust parameters before out-of-spec material is produced rather than after it appears in the lab results.
Safety intelligence correlates incident reports, near-miss observations, and environmental emission data with production pressure indicators and maintenance activity patterns to identify systemic safety risks that are invisible when safety data is managed in isolation. The AI can detect, for example, that maintenance near-miss reports increase in frequency during periods of high production pressure when equipment is being pushed beyond its optimal operating envelope, or that specific emission excursions correlate with maintenance activities on baghouse systems that were not properly isolated before work began. By connecting safety data with operational data, the platform transforms safety management from a compliance reporting function into an operational risk management function that identifies and mitigates hazards before they result in incidents. The system also tracks leading safety indicators such as safety observation completion rates and permit-to-work compliance, correlating these with production schedules to ensure that safety procedures are not being shortcut during periods of high operational tempo.
Replace Fragmented Dashboards With One Operational View
iFactory connects to your DCS, CMMS, LIMS, energy meters, and safety systems, unifying all plant data into a single AI-powered platform where cross-domain insights are generated automatically.
Cross-Domain Intelligence: Insights That Siloed Systems Cannot Produce
The most valuable operational insights in a cement plant do not live within a single department. They exist in the intersections between departments, where a change in one domain creates a cascading effect across others. The table below contrasts the type of analysis possible in a fragmented environment with the analysis possible when all five domains share a unified AI analytics engine.
The Cement Plant Digital Maturity Pathway
Operational excellence through AI does not require a single massive transformation. It follows a maturity pathway where each stage builds on the data infrastructure and organizational capabilities established in the previous stage. Plants that attempt to skip stages by deploying advanced AI without first establishing data integration consistently fail to achieve the projected value because the AI lacks the data quality and cross-domain context required to produce reliable insights.
Data Unification and Visibility
The foundational stage establishes a single data layer that connects all plant systems, normalizes timestamps, and makes every data point accessible from one interface without manual export and alignment. At this stage, the value comes from time savings: engineers spend minutes accessing data that previously took hours to extract and align. The platform provides unified dashboards that replace the fragmented departmental views, giving every stakeholder from the shift supervisor to the plant manager a consistent picture of plant performance. No AI modeling is applied at this stage; the focus is entirely on eliminating the data access barrier that prevents cross-domain analysis. Most plants complete this stage within four to eight weeks depending on the number and complexity of their existing data systems, and the time savings alone typically justify the investment before any advanced analytics are deployed.
Descriptive Analytics and Automated Reporting
With unified data in place, the platform begins calculating performance metrics across all five domains automatically, generating the production, energy, maintenance, quality, and safety reports that were previously assembled manually. More importantly, the platform begins identifying the correlations between domains that manual reporting could not detect: which maintenance events correspond to which production losses, which quality deviations coincide with which energy consumption spikes, and which safety incidents correlate with which operational pressure patterns. These correlations are presented as descriptive findings in the automated reports, giving plant leadership their first clear view of how the five operational domains interact in practice. This stage typically delivers the largest single-step improvement in management decision quality because it replaces intuition about cross-domain relationships with data-validated evidence.
Predictive Analytics and Early Warning
The third stage applies machine learning models to the unified data to predict future operational outcomes rather than simply describing past performance. Predictive models for equipment failure, quality deviation, and energy consumption anomaly are built using the cross-domain data available in the unified platform, which makes them significantly more accurate than models built on single-domain data. A failure prediction model that has access to both maintenance history and real-time process conditions can distinguish between a vibration increase caused by a mechanical bearing problem and one caused by a process upset that will resolve on its own, reducing false alarm rates and building operator trust in the predictions. Early warning alerts are generated when predicted values cross configurable thresholds, giving operations and maintenance teams lead time to take preventive action before the predicted event occurs.
Prescriptive Optimization and Autonomous Control Support
The most advanced stage moves from predicting what will happen to recommending what should be done about it. The prescriptive engine evaluates multiple possible corrective actions for each predicted deviation and recommends the action that optimizes total plant performance across all five domains simultaneously. When the system predicts an impending kiln stability issue, it does not simply alert the operator; it recommends a specific setpoint adjustment that resolves the stability issue while minimizing the impact on production rate, energy consumption, and clinker quality, and it quantifies the trade-offs of each option so the operator can make an informed decision. In some implementations, the prescriptive recommendations are executed automatically through closed-loop control integration, with the AI adjusting setpoints within pre-approved boundaries and escalating to operator approval when the recommended action falls outside the approved envelope. This stage represents full operational excellence where the AI platform is actively managing the cross-domain optimization that human operators cannot perform manually at the speed and scale required.
Measured Impact of Unified AI Operational Excellence
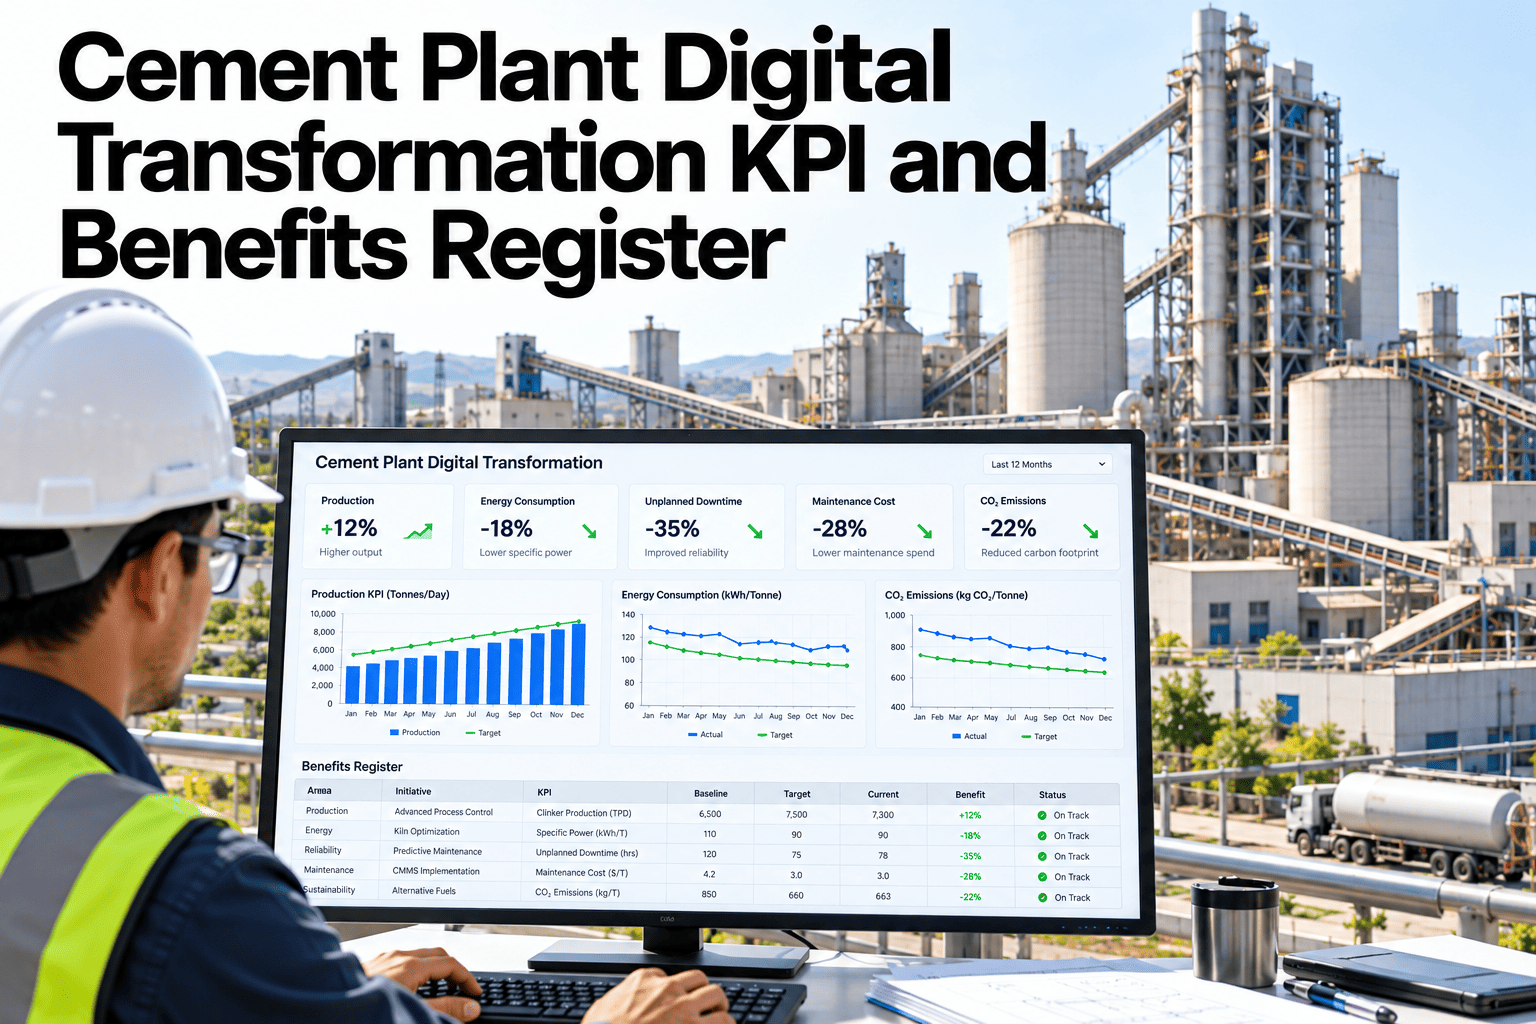
Performance improvements reported by cement plants that implemented a unified AI operational excellence platform, measured over the first twelve months after reaching Stage 3 maturity on the digital pathway described above.
A Cement Group COO on Ending the Data Silo Problem
We had five different software systems across our plants, and every monthly review was a two-day exercise in reconciling numbers that never matched because each system used different time boundaries and different calculation methods. The production team would report one availability figure, the maintenance team would report a different one, and by the time we figured out why the numbers disagreed, the review was over and no operational decisions had been made. When we unified everything onto a single platform, the first thing that happened was the arguments stopped because everyone was looking at the same data. The second thing that happened was we started seeing problems we literally did not know existed, like the correlation between our preventive maintenance scheduling patterns and the specific energy consumption spikes that followed every maintenance shutdown. We had been living with that pattern for years and nobody had ever plotted the two data sets on the same timeline because they lived in different systems managed by different departments with different reporting cycles.
Frequently Asked Questions
Does a unified platform replace our existing DCS, CMMS, and LIMS systems?
No, the unified AI platform does not replace your existing operational systems. It connects to them through standard industrial protocols and APIs, reading the data they generate and storing it in a dedicated analytics layer. Your DCS continues to control the process, your CMMS continues to manage work orders, and your LIMS continues to manage lab samples and results. The unified platform adds an intelligence layer on top of these systems that correlates their data and generates cross-domain insights, but it does not interfere with their core functions. This approach preserves the operational stability of your existing systems while eliminating the data fragmentation that prevents cross-domain analysis. Book a demo to see the specific integration architecture for your plant systems.
How long does it take to deploy a unified operational excellence platform across a cement plant?
Deployment timeline depends on the number and complexity of the data sources being integrated, but most single-plant implementations complete the data unification stage within four to eight weeks. Automated reporting and descriptive analytics are typically operational by the end of the second month. Predictive analytics models require three to six months of unified data to train effectively, so Stage 3 capabilities are typically available between months four and eight. Full prescriptive optimization, which is Stage 4, requires the organization to build trust in the predictive models and establish the governance frameworks for AI-assisted decision making, so it typically comes online between months nine and twelve. The platform delivers measurable value at every stage, so the return on investment begins accumulating during the first month of deployment rather than waiting for the full maturity pathway to be complete. Talk to a specialist about a deployment timeline for your specific configuration.
What is required from our IT team to support the platform integration?
The integration process is designed to minimize the burden on plant IT teams. iFactory handles the configuration of data connections, protocol translation, and data normalization as part of the deployment scope. The plant IT team is typically required to provide network access to the target systems, assist with firewall rule configuration for the data connections, and provide documentation or access credentials for the existing DCS, CMMS, LIMS, and energy management system interfaces. No changes to the existing plant network architecture or control system configuration are required, and the platform can be deployed on-premises within the plant network or in a corporate data center depending on the security and connectivity preferences of the organization. Book a demo to review the IT requirements and deployment options.
How does the platform handle plants with older control systems that lack modern data connectivity?
Cement plants with older control systems can still integrate into the unified platform through a range of data acquisition methods that do not require upgrading the control system itself. For systems with OPC DA or DDE interfaces, protocol gateways translate the legacy protocol into OPC UA for modern integration. For systems with only historical data logging to flat files or proprietary databases, the platform can ingest exported data files on a scheduled basis and align them with real-time data from newer systems. For equipment with no digital connectivity at all, the platform can accept manual data entry through structured input forms that maintain the same data structure as automated feeds, ensuring that even manually collected data participates in the cross-domain correlation engine. The goal is to integrate every relevant data source regardless of its vintage, not to require a control system upgrade as a prerequisite for operational excellence. Talk to a specialist about connectivity options for your legacy equipment.
Can the platform scale across multiple plants in a cement group with standardized reporting?
Yes, the platform is designed for multi-plant deployment with a centralized configuration layer that enforces standardized KPI definitions, calculation methodologies, and report templates across all plants in the group. Each plant connects its local data sources to the platform, and the centralized configuration ensures that every plant calculates metrics using the same formulas and the same time boundaries, eliminating the reconciliation problems that plague multi-plant reporting when each plant uses different methods. The platform also provides cross-plant benchmarking capabilities that compare performance across plants on a normalized basis, accounting for differences in equipment configuration, product mix, and climatic conditions. Corporate leadership receives a unified group-level dashboard that rolls up standardized data from all plants, while plant-level users see the same platform configured with their local data and plant-specific targets. Book a demo to see the multi-plant architecture and benchmarking capabilities.
Unify Your Plant Data Into One Operational Intelligence Platform
Book a 30-minute operational excellence assessment. Share your current software stack and the data gaps between your departments, and iFactory will map a unified platform architecture that connects your existing systems.