A single underweight bag is a quality note. A line that has drifted half a kilogram under target for three days running is a compliance exposure, and the difference between the two is almost always visibility. Bag weight tolerance is one of the most tightly watched numbers in cement packing, tested by regulators, customers and the plant's own quality team alike. This guide covers how to turn individual weight checks into a trend that catches drift before it becomes a rejected shipment. Teams ready to connect their own weigh data can book a demo with the iFactory AI team.
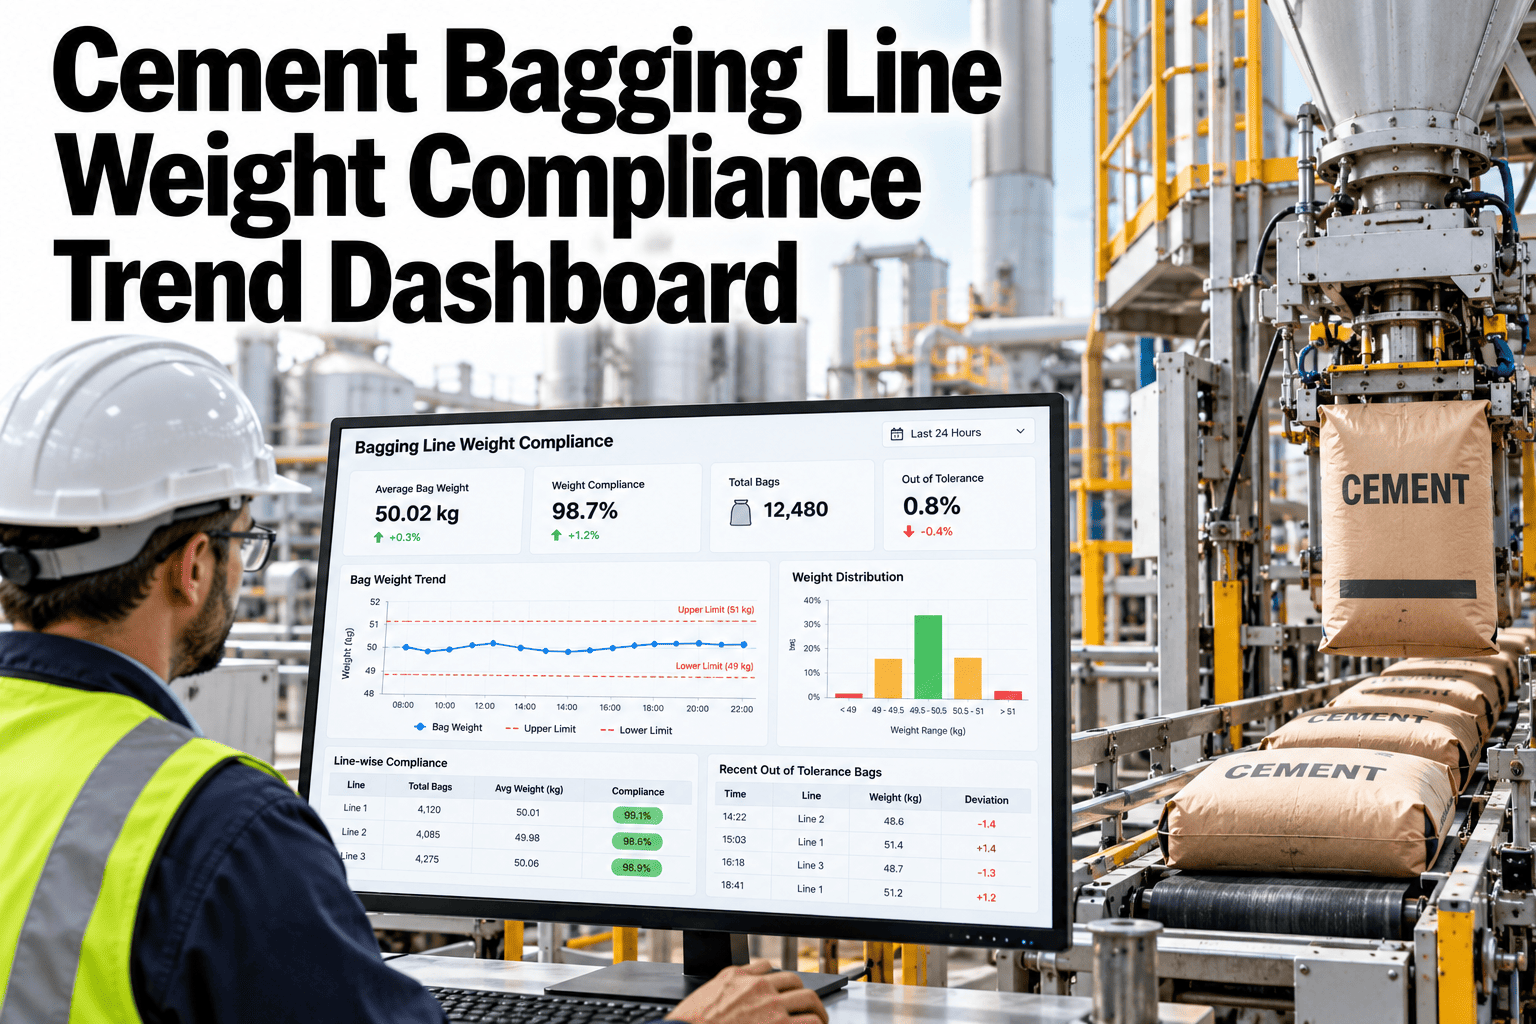
Cement Bagging Line Weight Compliance Trend Dashboard
A weight compliance dashboard turns individual bag checks into a trend by line and by shift, so drift toward the tolerance edge is visible days before it becomes a rejected pallet or a customer complaint.
Measurement Records Worth Keeping
A weight check is only as good as the record behind it. For a compliance trend to hold up to scrutiny, every reading needs to carry enough context to be reproduced later, not just the number itself.
| Field | Why It Is Kept |
|---|---|
| Bag weight | The core measurement |
| Spout and line | Traces drift to a specific source |
| Timestamp | Allows trend and shift analysis |
| Scale ID and calibration date | Supports the measurement's credibility |
| Product grade | Different grades can carry different tolerances |
Tolerance Configuration
Tolerance bands are rarely one number for an entire plant. Different standards, customers and bag sizes can carry different acceptable ranges, and the dashboard needs to apply the right one automatically rather than relying on an operator to remember it.
Batch mean check
The average weight across a sample of bags must sit at or above the nominal weight.
Single bag check
No single bag may fall below a defined floor, even if the batch average passes.
Both checks matter, and a dashboard that only tracks the average can let a batch with several severely underweight bags pass simply because other bags were overweight enough to balance it out. Tracking both together closes that gap.
Trend by Line
The chart below shows an illustrative weekly average weight for three packing lines against a 50 kg nominal target, as a percentage of target.
Line 3 in this illustrative view is drifting closest to a tolerance breach. On a plant that only reviews bag weight at month end, this gap could widen for weeks before anyone notices. A weekly trend view catches it while it is still a maintenance check, not a rejected shipment.
Catch Weight Drift Before a Rejection
iFactory AI trends bag weight by line, shift and grade, flagging drift toward the tolerance edge days before a batch is rejected. Book a 30-minute walkthrough.
Rejection Handling
When a bag or batch does fall outside tolerance, what happens next matters as much as the detection itself. A clear, consistent rejection path keeps out-of-spec product from reaching a customer and keeps the record defensible.
Calibration Evidence
A weight record is only as credible as the scale behind it. Calibration evidence needs to sit alongside the weight data itself, not in a separate binder nobody checks before a customer audit.
| Evidence | Why It Is Requested |
|---|---|
| Calibration certificate | Confirms the scale was accurate as of a given date |
| Calibration frequency | Shows the scale is checked on a defined schedule |
| Drift between calibrations | Shows whether the scale holds steady between checks |
| Traceable reference weights | Confirms the calibration itself is credible |
Corrective Actions
A weight compliance program closes the loop by tracking what was done about a drift event, not just that it was noticed. The same logic that applies to downtime causes applies here: an untracked fix tends to repeat.
Plain-Language Glossary
A shared vocabulary keeps quality, production and customer-facing teams reading the same weight data the same way.
Expert Review
Quality teams reviewing weight compliance programs keep returning to the same two notes.
Track the floor, not just the average
A batch can pass on average while still shipping bags that would fail a customer's own spot check. That gap is exactly what tends to trigger disputes later.
Match calibration to review cadence
A scale calibrated once a quarter but trended weekly gives a false sense of precision in the weeks between checks. Match the calibration frequency to how tightly the tolerance is watched.
Frequently Asked Questions
What is the difference between average and individual tolerance?
Average tolerance checks the batch mean against the nominal weight, while individual tolerance sets a floor no single bag can fall below. Tracking both together catches issues either check alone would miss. Book a demo to see both tracked together.
How often should bag weight be sampled?
Sampling frequency usually follows the applicable standard or customer requirement, though continuous automated weighing at the packer gives far more visibility than periodic manual spot checks.
What should trigger a scale recalibration?
A trend showing the line average drifting steadily in one direction, even while individual bags still pass, is usually the earliest sign a scale needs checking. Book a demo to see drift alerts configured.
Can different grades carry different tolerances on the same dashboard?
Yes, tolerance rules should be configurable per grade and bag size, applied automatically based on what is being packed at the time. Ask support how multi-grade tolerance rules are set up.
Do we need calibration evidence if we trust the scale?
Trust is not the same as evidence, and most customers and auditors will ask for the calibration record directly rather than taking a plant's word for it.
Watch Weight Drift Before It Reaches a Customer
iFactory AI trends bag weight compliance by line, shift and grade, tied to calibration evidence and corrective actions. Book a walkthrough built around your plant.