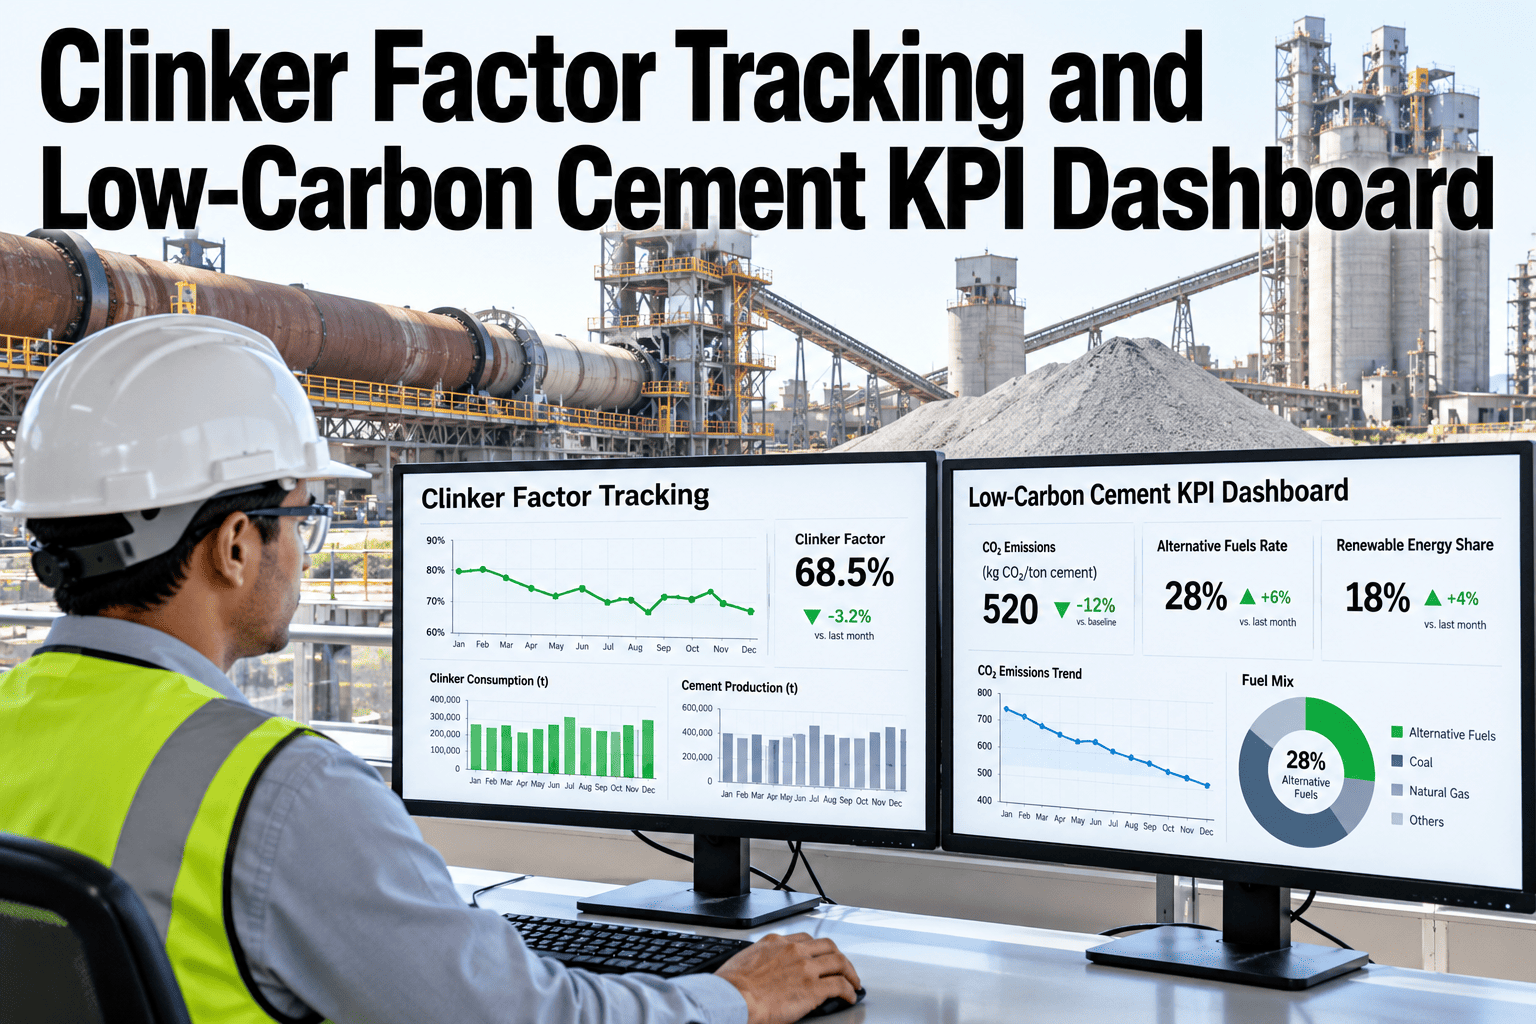
The clinker factor is the most watched number in low-carbon cement, and one of the easiest to get wrong. Plants calculate it in different ways, product mix hides the real trend, and the data sits with four teams. A good dashboard fixes the definition first. See how iFactory AI builds a clinker factor dashboard for your plant.
One Clinker Factor Everyone Trusts, Tracked Month After Month
iFactory AI joins production, material and quality records into one dashboard, so the clinker factor, the product mix and the strength results are read together.
Why the Number Gets Disputed
Two teams can quote different factors for the same month and both be right. The argument is usually about the rules, not the maths.
Define the Clinker Factor Once
The clinker factor is the share of clinker in the cement a plant makes, expressed as a ratio. A plant that makes 100 tonnes of cement with 74 tonnes of clinker has a factor of 0.74. The idea is simple, but the inputs are not.
Clinker made
Kiln output, weighed or estimated, for the period.
Clinker moved
Bought in, sold out and any change in the stock pile.
Cement ground
Mill output, including gypsum and every added material.
Ratio taken
One division, same period, same boundary, same rule.
| Version | How it is built | Good for | Risk |
|---|---|---|---|
| Recipe ratio | Clinker share set in the cement recipe | Design and product specs | Ignores what the mill actually ran |
| Plant factor | Clinker consumed divided by cement produced | Reporting and trend tracking | Stock moves and purchases skew a month |
| Dispatch-weighted | Recipe ratios weighted by tonnes shipped | Customer and product views | Timing gap between production and sale |
Write the rule in plain words on the dashboard itself, in a small note under the headline tile. Readers who see the definition next to the number are less likely to argue about it, and new staff learn the rule on day one.
Show the Product Mix Beside It
A plant factor is an average of its products. A shift in what customers buy can move the number as much as any process change, so the dashboard needs the mix on the same page.
Put Your Own Plant on the Dashboard
Book a 30-minute session and iFactory AI will map your clinker, mill and lab records into one factor your teams can trust.
What the Factor Means for Carbon
Clinker making is the most energy-intensive and CO2-emitting step in cement. Limestone decarbonation in the kiln releases about 525 kg of CO2 per tonne of clinker, before fuel and electricity are counted. A lower factor therefore lowers process emissions in direct proportion.
Intensity is stated per tonne of cement, not per tonne of concrete. The same document notes that a sliding scale tied to clinker content can discourage SCM use, which is one more reason to show the factor and the SCM share side by side.
Boundary Choices That Move the Number
Net or gross CO2
Net accounting credits CO2 tied to waste-derived fuels. Say which you use.
SCM emissions
The IEA boundary leaves out emissions of making fly ash or slag. EN 15804 allocates them economically.
Unit of product
Per tonne of cement, per tonne of cementitious product or per cubic metre of concrete.
Bought clinker
Decide whether its emissions sit in your report or the supplier's.
Static or measured
Some national schemes fix a static ratio. Plants usually report what they measured.
Reporting period
Month, quarter or year, with the same cut-off every time.
Track Every Supplementary Cementitious Material
Supplementary cementitious materials, or SCMs, replace part of the clinker. Each one has its own supply, cost and effect on performance, so each deserves its own line on the dashboard.
Granulated slag
A by-product of iron and steel production.
Fly ash
Fine particles caught in the flue gas of coal-fired power stations.
Natural pozzolans
Volcanic materials and certain clays and sedimentary rocks.
Ground limestone
Finely ground and added without being heated.
Silica fume
A by-product of silicon and ferrosilicon production.
Other additions
Steel slag and other local materials, tracked under their own codes.
Share by type
Percent of each cement, and tonnes per month.
Source and lot
Supplier, delivery and storage, tied to the batch.
Condition
Moisture and fineness at the time of use.
Supply risk
Days of stock and the next delivery.
Never Read the Factor Without the Quality Context
A lower factor is only good news if the cement still performs. Other constituents change how cement behaves in both the short and long term, and the market must accept the result.
| Quality measure | Why it sits beside the factor | How to show it |
|---|---|---|
| Early strength | Blends can gain strength more slowly at first | Early results by product, against the spec limit |
| 28-day strength | The main class requirement for the cement | Rolling average and spread by product |
| Fineness | Finer grinding can recover performance in blends | Fineness trend beside the SCM share |
| Setting time | Customers feel this on the job site | Test results against limits |
| Complaints and returns | The market view of performance | Count by product, linked to the batch |
Use the two columns below as a quick test in the monthly review. If a month looks like the right column, pause the push for a lower number until the cause is found.
Read the Trend, Not the Month
A single month is noisy. Stock moves, mill stops and a big dispatch can push the factor up or down with no real change. Use a rolling view and compare like with like.
Settle Data Ownership Early
A dashboard is only as good as its weakest feed. Give every input one owner, one source and one refresh rhythm, and write it down.
| Data item | Usual owner | Typical source | Refresh |
|---|---|---|---|
| Clinker produced | Kiln and production | Kiln scales or DCS totals | Daily |
| Clinker stock and moves | Logistics | Stock records and weighbridge | Daily |
| Cement produced | Mill operations | Mill totals and packing | Daily |
| SCM and gypsum use | Materials | Feeder totals and deliveries | Daily |
| Recipes and product mix | Quality and technical | Recipe master and sales data | On change |
| Strength and fineness | Laboratory | Lab results | Per sample |
| Emission factors | Sustainability | Reviewed factor list | Yearly |
Dashboard Layout, Top to Bottom
Order the page so a reader gets the headline first, the reason second and the risk third.
Headline tiles
Clinker factor, SCM share, strength status and process CO2 estimate.
Mix and materials
Factor by product and SCM tonnes by type, month to date.
Quality context
Strength, fineness and setting results, with spec limits marked.
Trend and events
Rolling lines with kiln stops, recipe changes and SCM lots marked.
Alerts That Earn Their Place
Outside the band
The mix-adjusted factor leaves its planned band for several days.
Low SCM stock
Days of cover for a key material fall below a set limit.
Strength dip
Early results trend toward the spec limit for a product.
Missing feed
A data input is late or flat, so the factor may be wrong.
Mix shift
The sales mix moves enough to change the plant factor.
Large stock move
Clinker stock changes enough to distort the month.
Mistakes to Avoid
What One Point of Factor Is Worth
Small moves in the factor add up. Using the calcination figure above, each fall of 0.01 trims about 5 kg of CO2 per tonne of cement, before any fuel or power effect. Over a year of output, that is a large amount of carbon.
Treat the result as a range, not a promise. Real savings depend on the strength limits of each product, the supply of SCMs and the grinding energy needed to keep performance. The dashboard's job is to make those trade-offs visible before a decision, and to confirm the outcome afterward.
Measures That Keep the Dashboard Honest
| Measure | What it shows | Review rhythm |
|---|---|---|
| Plant clinker factor | The headline figure on the agreed rule | Monthly |
| Mix-adjusted factor | The trend with product mix held steady | Monthly |
| SCM share by type | Progress and supply risk for each material | Weekly |
| Strength spread | Whether quality stays inside its limits | Weekly |
| Data completeness | Share of inputs present and on time | Daily |
| Restated figures | How often past months had to be corrected | Quarterly |
A Monthly Review That Takes Forty Minutes
The dashboard earns its place in a short, steady meeting. Keep the agenda fixed so the same questions are asked every month and trends become easy to see.
Headline and data
Read the factor, check completeness and note any restated month.
Mix and materials
See what moved the plant factor and how much SCM stock is left.
Quality and market
Review strength, fineness and complaints by product.
Decisions
Agree actions, owners and dates, and mark them on the trend.
Over time the meeting builds a record of decisions beside the numbers. When the factor steps down, the team can point to the recipe change, the new SCM lot or the mill setting that caused it, and a future team can see what worked.
Before You Publish the Dashboard
Run this check with all four teams in one room. The boxes are clickable.
How iFactory AI Supports the Dashboard
iFactory AI joins the kiln, mill, material and lab records your plant already holds and keeps one calculation, so every team reads the same number.
One factor calculation
A single written rule runs on every feed, so reports match.
Product mix view
Factor by cement type, with a mix-adjusted trend line.
SCM tracking
Share, source and lot for each material, linked to the batch.
Quality link
Strength and fineness shown beside the factor, by product.
Trend and events
Rolling lines with markers for kiln stops and recipe changes.
Owner and gap list
Each input shows its owner and flags missing or late data.
A 90-Day Starting Plan
The plan below gets one plant to a trusted dashboard. Agreeing the rule comes first on purpose, because every later step depends on it.
Agree the rule
Write the factor definition and name an owner for each input.
Connect the feeds
Link kiln, stock, mill, materials and lab data, and flag the gaps.
Check against history
Rebuild past months and compare with the old reports.
Publish and review
Release the dashboard and hold the first monthly KPI review.
Frequently Asked Questions
What is the difference between clinker factor and clinker-to-cement ratio?
The terms are often used for the same idea, the share of clinker in cement. The key is to state whether you mean the recipe, the plant total or a dispatch-weighted figure. Book a demo to see all three views on one screen.
Why does our factor change when we change nothing?
Product mix, clinker stock moves and timing gaps can shift the number without any process change. A mix-adjusted line shows the real trend. Book a demo and bring last year's monthly figures, or ask support about the calculation.
How do we show strength next to the factor?
Place strength and fineness results by product on the same page, with the spec limit marked. A falling factor with steady strength is the outcome to aim for. Book a demo of the quality view using sample lab data.
Who should own the dashboard?
Give each input to the team that produces it, and give the dashboard itself to a small group that includes operations, quality and sustainability. A monthly review keeps it honest. Book a demo to plan ownership across your teams.
How long does it take to go live?
The turnkey build runs 6–12 weeks. Much of the time goes into agreeing definitions and cleaning feeds, not into charts. Book a demo to build your timeline with the team.
Make the Clinker Factor a Number You Can Defend
iFactory AI gives cement teams one definition, one dashboard and a clear owner for every input. Book a walkthrough on your own plant data.