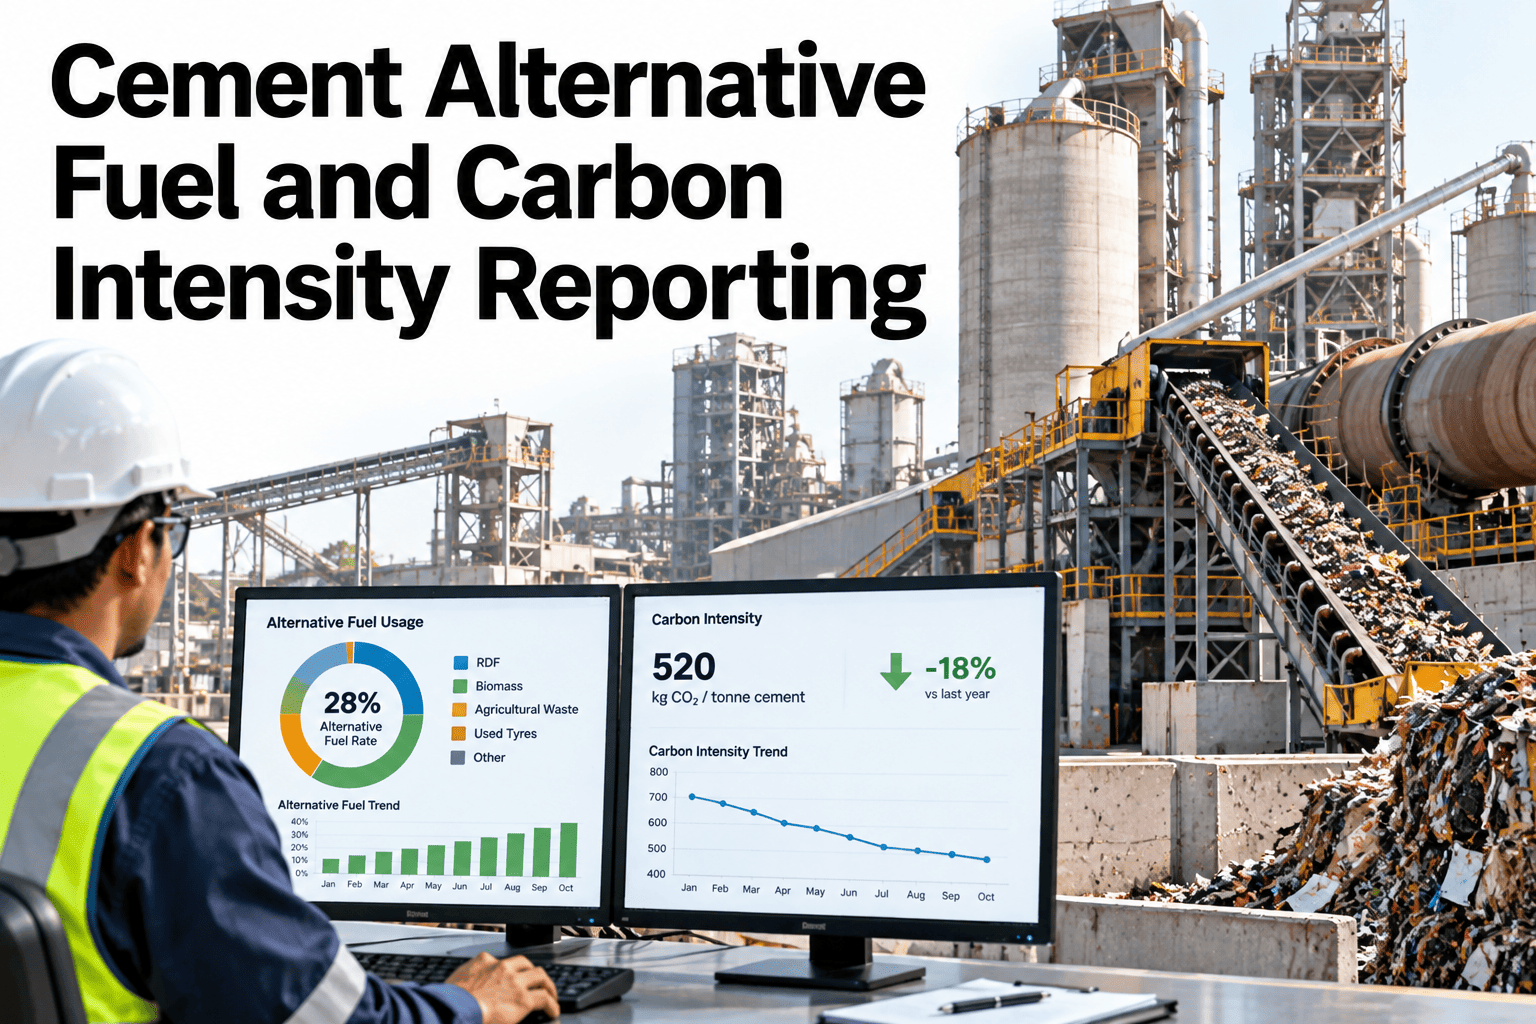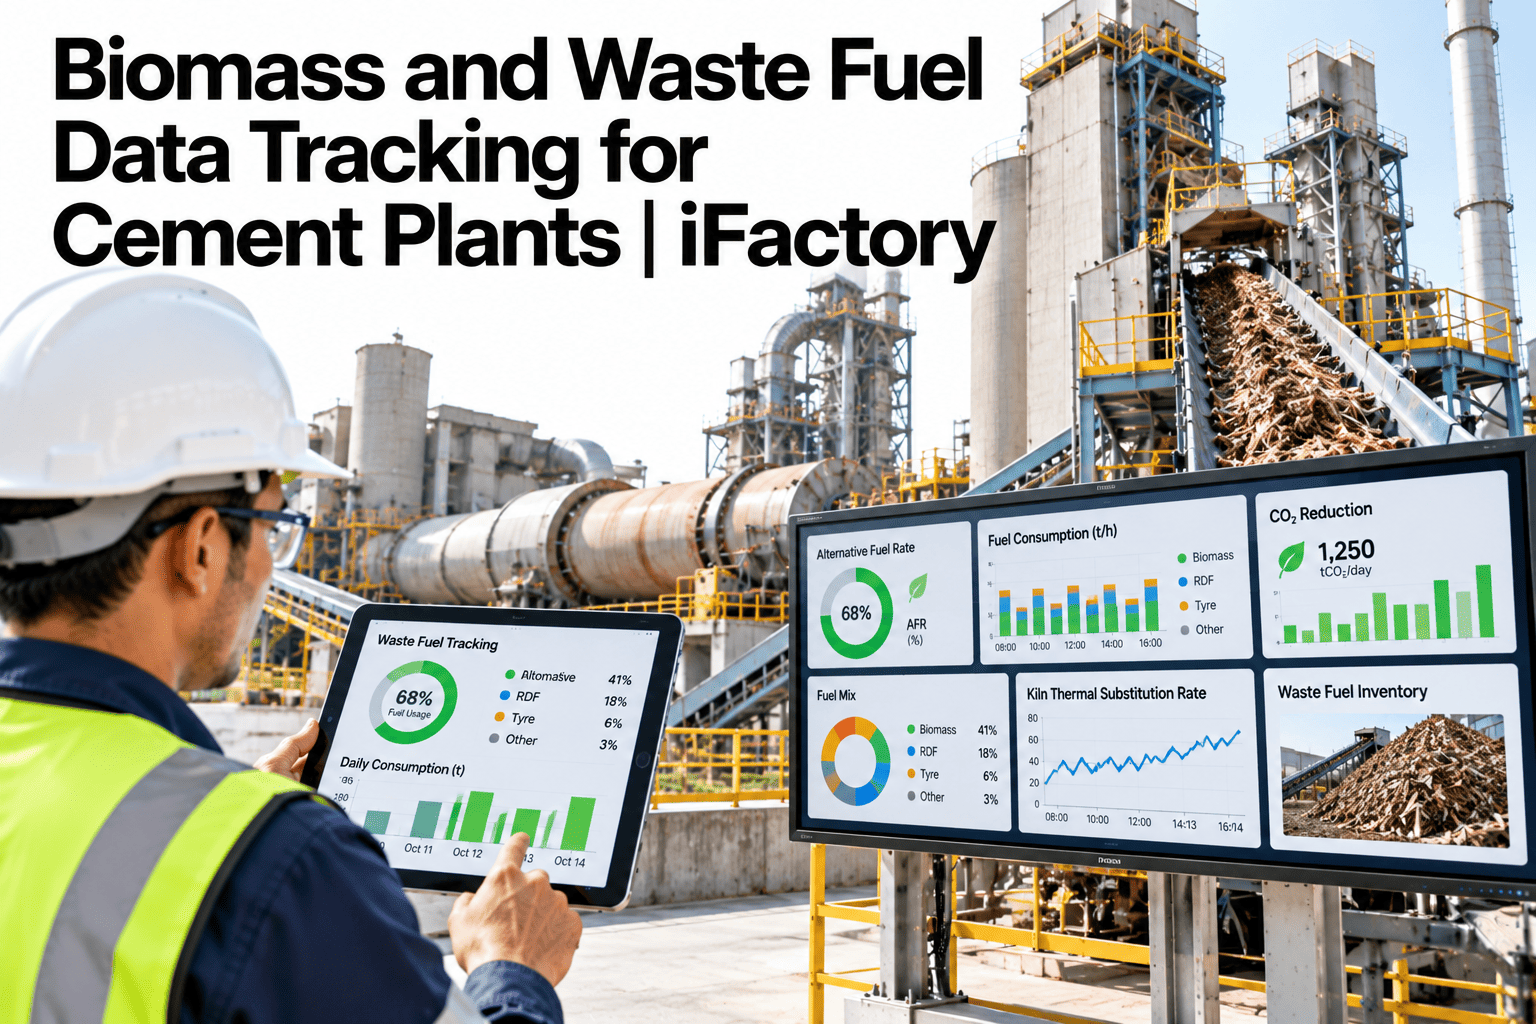
Carbon reporting for a cement plant pulls from production logs, fuel records, electricity bills and emission factor tables that usually live in different systems maintained by different teams. A plant assembling a carbon report by hand each quarter is really doing a data reconciliation exercise disguised as an environmental report, and every manual step is a place where a boundary gets drawn inconsistently or a factor gets applied the wrong way. Managing this well means treating emissions data the way production data is already treated: with a defined boundary, traceable inputs, and a version-controlled calculation, not a spreadsheet rebuilt from scratch each reporting cycle. Plant teams reviewing their current process can see production, fuel and energy records connected into one carbon data workflow before the next reporting deadline.
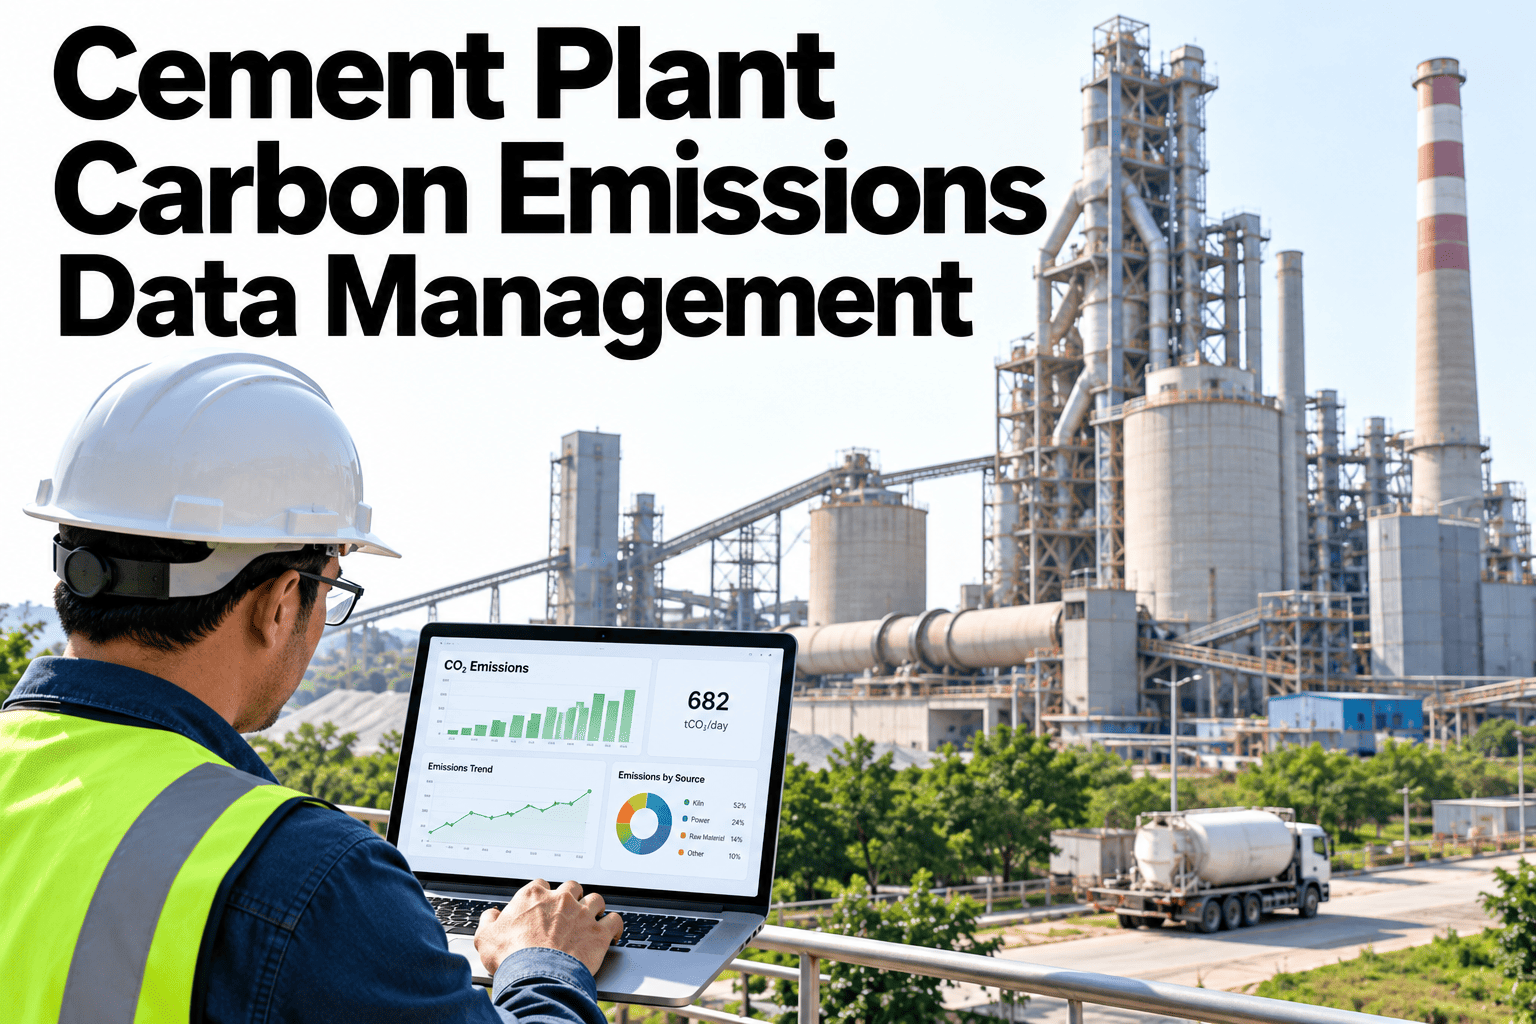
Cement Plant Carbon Emissions Data Management
Production, material and energy records connected into one workflow that supports carbon reporting, not a rebuilt spreadsheet.
Why a Manual Report Rebuild Each Cycle Breaks Down
Rebuilding the carbon report from scratch every quarter creates three recurring problems.
Which kilns, lines or processes count can shift slightly between reporting periods without anyone noticing.
Emission factors applied by hand can differ between the person who built last quarter's report and this one.
A number questioned months later is hard to trace back to the source record it came from.
A structured data workflow fixes all three by locking the boundary, versioning the factors, and keeping every number traceable to its source.
Boundary Definitions
What counts inside the reporting boundary needs to be defined once and applied consistently.
Organizational Boundary
Which plants, lines and legal entities are included in the reported figure.
Operational Boundary
Which processes and emission sources within those facilities count under each scope.
Fuel and Energy Inputs
Every fuel and electricity input needs to be captured at the level the calculation actually requires.
Kiln Fuel Records
Conventional and alternative fuel consumption, tracked by type and quantity.
Purchased Electricity
Grid electricity consumption, tracked against utility billing records.
Check Your Own Data Sources Against This Workflow
Book a 30-minute session and bring your current reporting process. iFactory AI will show where the data already exists and where it needs connecting.
Production Denominator, Emission Factors and Lineage
The final three pieces turn raw records into a defensible, traceable number.
| Component | What It Does | Why It Matters |
|---|---|---|
| Production denominator | Converts total emissions into a per-tonne figure | Lets performance be compared across periods and routes |
| Emission factors | Converts activity data into CO2 equivalent | Needs to be version-controlled, not applied inconsistently |
| Data lineage | Traces every reported number back to its source record | Lets a questioned figure be explained, not just defended |
Review and Export
The final step turns the connected data into a report that can actually be reviewed and submitted.
Internal Review Workflow
Numbers are reviewed and signed off before export, with the review itself logged.
Multi-Format Export
The same underlying data exports in the formats different reporting frameworks require.
iFactory AI connects production, fuel and energy data into one carbon data workflow. Scope covers boundary definition, data integration, and reporting setup.
Expert Review
The plants that struggle most at audit time are rarely the ones with wrong numbers. They are the ones that cannot explain how a number was calculated, because the boundary and factor assumptions were never version-controlled in the first place.
Data lineage is the feature that pays off the least in a normal quarter and the most the one time a number gets questioned. Building it in from the start costs far less than reconstructing it after the fact.
Frequently Asked Questions
Does this replace our current carbon accounting spreadsheet?
It replaces the manual rebuild process behind the spreadsheet, pulling data from existing production, fuel and energy systems automatically so the final report is assembled rather than reconstructed each cycle. See how an existing process transitions in a working session.
How are emission factor updates handled over time?
Factor updates are version-controlled, so a report always references the specific factor version used at the time, and historical reports remain reproducible even after factors are updated for future periods. Ask support about factor version management.
Can the boundary differ between internal reporting and a regulatory submission?
Yes, different boundaries can be configured for different reporting purposes, since an internal management report and a specific regulatory submission may legitimately draw the line differently. Request a multi-boundary example.
What happens when a data source is temporarily unavailable?
Missing data is flagged explicitly rather than silently estimated, and the system supports a documented approach for handling gaps so the final report stays transparent about where estimates were used. Contact support about your specific data gap handling needs.
How long before the full workflow is producing a report we can use?
Most plants have a working end-to-end report within seven to ten weeks, depending on how many data sources need connecting and how complex the boundary definition is. Book a session to estimate your own timeline.
Stop Rebuilding Your Carbon Report From Scratch Each Cycle
iFactory AI connects production, fuel and energy data into one traceable carbon workflow. See it on your own plant.