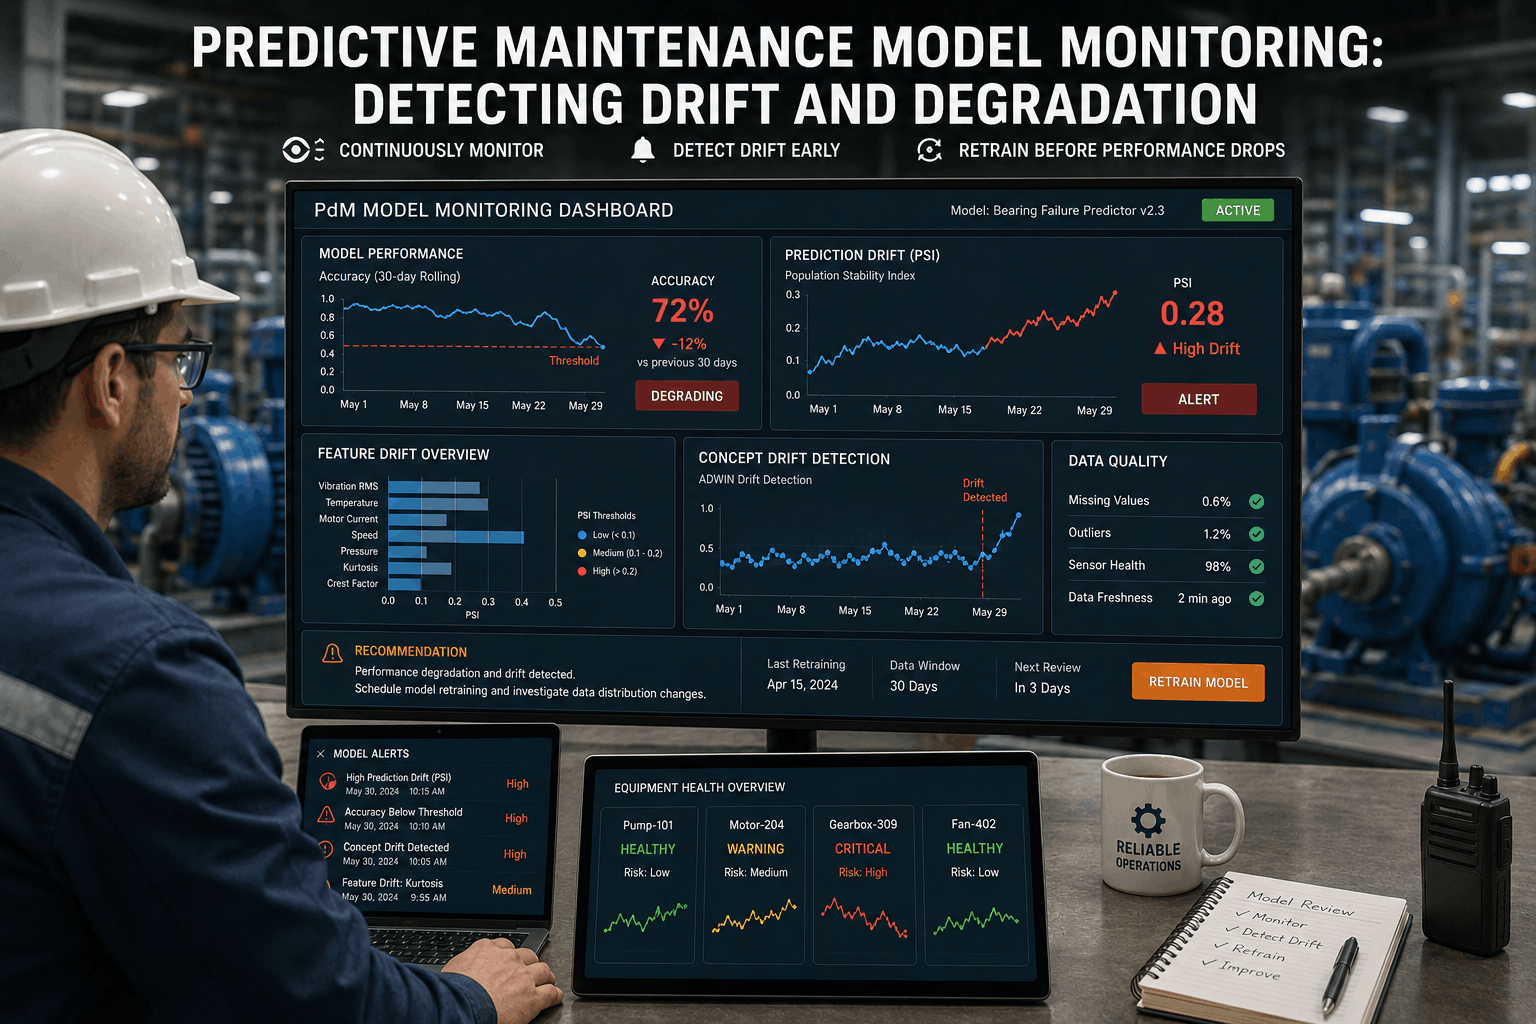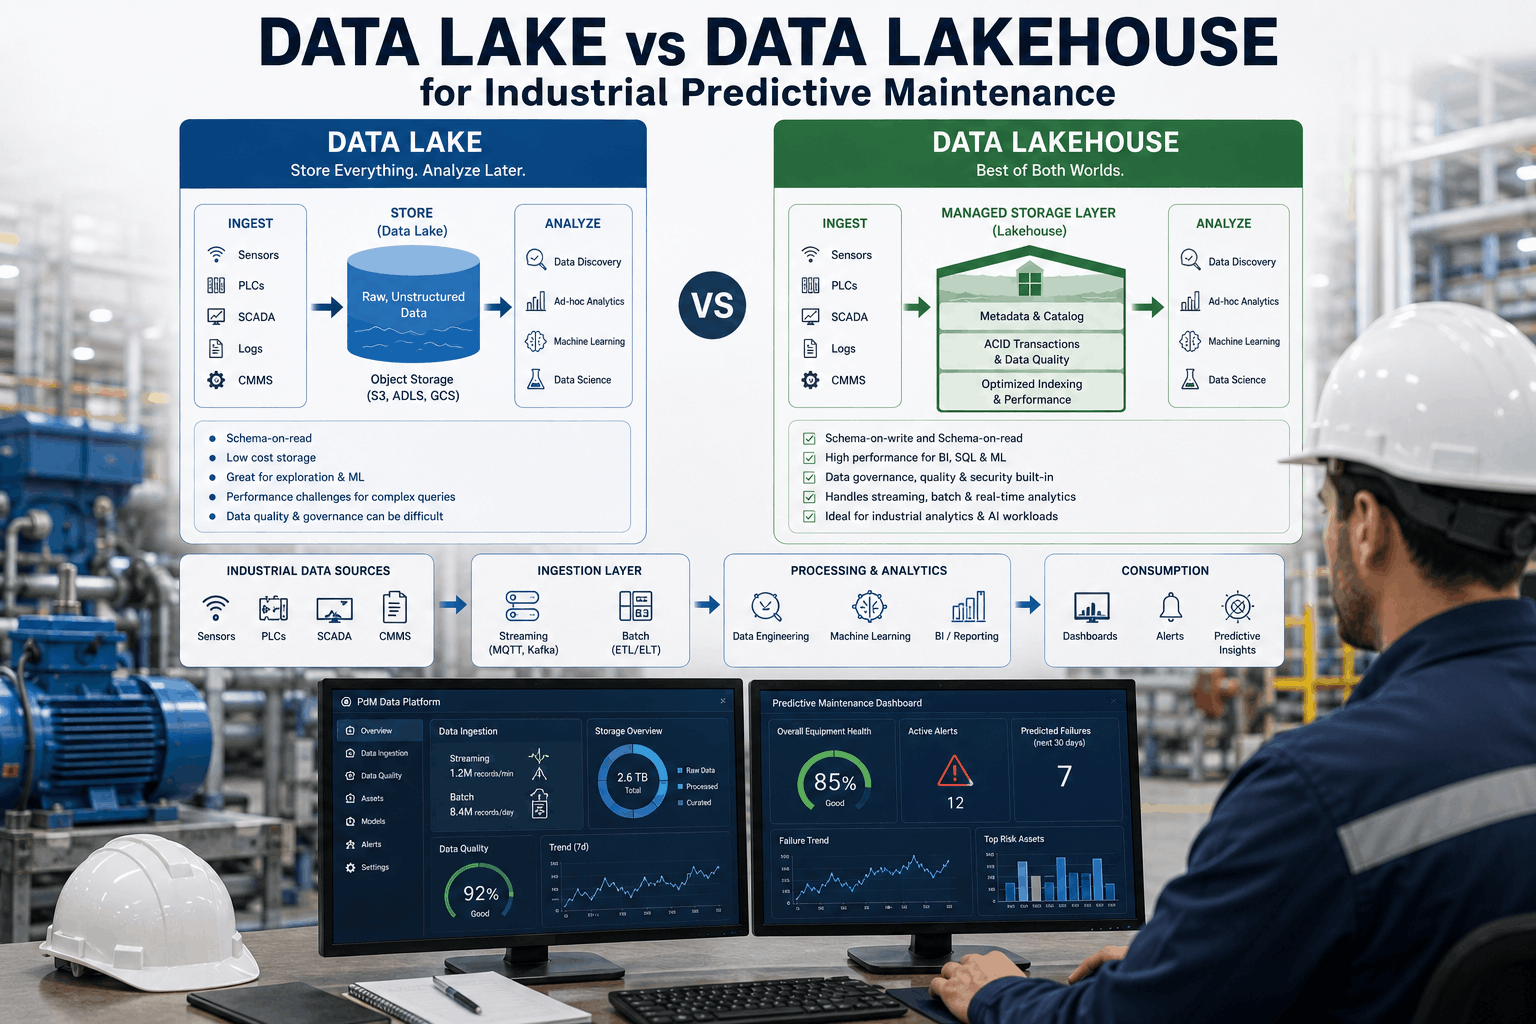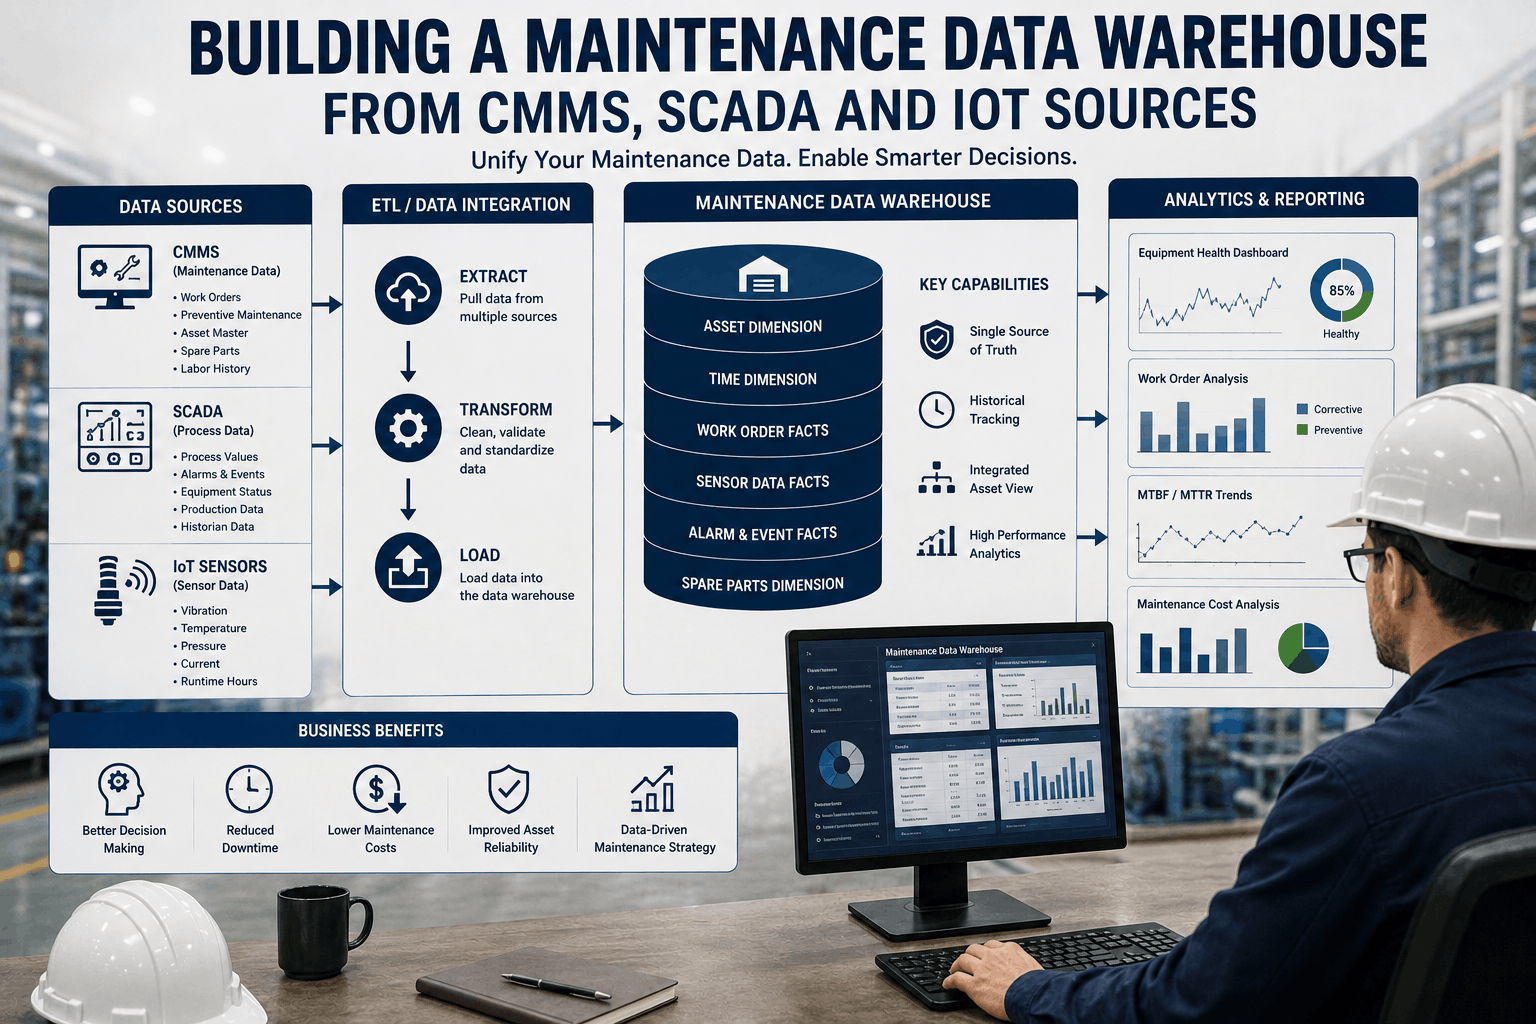
Integrating work order history from CMMS, process data from SCADA, and sensor streams from IoT into one analytics‑ready data warehouse unlocks comprehensive maintenance insights that isolated systems can’t provide. Start Trial Free to see how iFactory unifies your fragmented maintenance data into a single, queryable source of truth.
Merge CMMS, SCADA, and IoT Data into One Analytics Powerhouse
iFactory connects to your EAM, process historians, and sensor brokers, harmonizes disparate schemas, and loads a purpose‑built data warehouse that enables cross‑system reliability analytics without manual data stitching.
Why a Unified Maintenance Data Warehouse Outperforms Siloed Systems
CMMS holds what was repaired, SCADA knows how the machine was running, and IoT sensors capture the vibration signature before the failure. When these sources stay separate, reliability engineers spend hours manually correlating work orders with process trends to find root causes. A unified data warehouse aligns all three on a common asset hierarchy and time base, enabling queries like “show all vibration anomalies in the 48 hours before a pump seal failure” in seconds. iFactory automates the ETL, schema mapping, and incremental loading so your warehouse stays current without manual pipelines. Teams that Book a Demo see how pre‑built connectors ingest CMMS, SCADA, and MQTT data into a single analytics layer.
-
Automated CMMS Connector
iFactory extracts work orders, failure codes, and part replacements from SAP, Maximo, Infor, and other EAM systems — mapping them to the asset register automatically.
-
SCADA Historian Integration
Native connectors for OSIsoft PI, Wonderware, and OPC UA historians pull process variables and aggregate them to the same time base as maintenance events.
-
IoT Sensor Stream Ingestion
MQTT and OPC UA subscriptions flow high‑frequency vibration, temperature, and current data directly into the warehouse with exactly‑once delivery guarantees.
-
Unified Asset Hierarchy
iFactory reconciles different asset naming across systems — mapping CMMS functional locations to SCADA tags and IoT topics — so every data point lands on the correct machine.
-
Time‑Series Alignment Engine
Resampling and interpolation align sensor data with work order timestamps to sub‑second precision, enabling precise failure precursor analysis.
-
Incremental and Historical Load
iFactory supports both full historical backfill and continuous incremental updates, keeping the warehouse up‑to‑date with zero data gaps and minimal latency.
Critical Data Integration Capabilities for Maintenance Analytics
-
Asset Hierarchy Unification Across CMMS, SCADA, and IoT
Data AccuracyWithout a unified asset register, a pump’s vibration data from IoT, its pressure readings from SCADA, and its repair history from CMMS live in three separate naming conventions. iFactory’s mapping engine cross‑references equipment tags, functional locations, and serial numbers to create a single golden record per asset. This ensures every analysis — from MTBF calculations to failure prediction — operates on a complete, correctly attributed dataset, not partial views that miss critical correlations.
Mapping
Tag cross‑reference, serial number matching, AI‑assisted merge
Output
Single asset ID across all source tables
iFactory Record
Asset merge audit log with confidence scores
-
Temporal Alignment of Work Orders and Sensor Data
Correlation EngineA work order timestamped “08:00 Tuesday” tells you when the repair started, not when the failure began. iFactory’s temporal alignment engine back‑fills process and vibration data from configurable windows before each event, aligning multi‑rate streams on a uniform timeline. This allows reliable engineers to run precise queries like “show all SCADA tags and IoT spectra in the 72 hours preceding each bearing replacement,” building the labeled datasets needed for supervised PdM models.
Window
Configurable pre‑ and post‑event periods
Alignment
Resampling, interpolation, event‑triggered snapshots
iFactory Record
Aligned feature table per failure event
-
Incremental ETL with Change Data Capture
FreshnessBatch reloads of entire CMMS or SCADA databases create stale analytics windows and wasted compute. iFactory uses change data capture and log‑based incremental extraction to pull only new and modified records from source systems. IoT streams are ingested continuously; CMMS and SCADA updates land in the warehouse within minutes. This keeps the warehouse perpetually fresh without full‑scan overhead on production source systems.
CDC Methods
Transaction log, timestamp, trigger‑based
Latency
CMMS/SCADA updates in <5 minutes
iFactory Record
Data freshness metric per source table
-
Data Quality Enforcement at Ingestion
Clean InputCMMS free‑text fields, SCADA flat‑line signals, and IoT sensor dropouts introduce garbage that pollutes the warehouse if not caught at the gate. iFactory applies validation rules during ETL: reference checks for work order asset codes, dead‑band and freeze detection on SCADA streams, and completeness thresholds on IoT topics. Records that fail validation are quarantined with a quality flag, not silently loaded, ensuring warehouse tables remain trustworthy.
Rules
Referential integrity, range, completeness, staleness
Action
Load, quarantine, or reject with quality score
iFactory Record
Data quality dashboard per source system
-
Star‑Schema Modeling for Maintenance Analytics
Query PerformanceRaw transactional tables are not optimized for analytical queries like “failure count by asset type and month.” iFactory transforms integrated data into a star schema with fact tables (work orders, sensor readings, alarms) and dimension tables (asset, time, failure mode, location). This enables sub‑second OLAP queries on multi‑year datasets, powering interactive dashboards without pre‑aggregation or data extracts.
Fact Tables
Work order events, sensor aggregates, alarm log
Dimensions
Asset, time, failure mode, part, crew
iFactory Record
Schema version and query performance benchmark
-
Data Warehouse Automation and Orchestration
Hands‑Free OperationManual pipeline maintenance is unsustainable. iFactory orchestrates the full warehouse lifecycle: connection health checks, schema drift alerts, incremental load scheduling, quality score monitoring, and automatic retries on transient failures. An operations dashboard shows pipeline status at a glance, and failures trigger notifications to the data team — ensuring the warehouse never goes stale without someone knowing.
Orchestration
DAG‑based with error handling and retry logic
Monitoring
Pipeline status, latency, row counts, quality
iFactory Record
Pipeline run history and SLA compliance
Unified Data Warehouse Performance Indicators
Data Integration Coverage
iFactory automatically onboards 95% of CMMS, SCADA, and IoT data sources within the first week, leaving no critical asset data disconnected from the warehouse.
Cross‑System Query Speed
Time to correlate work orders with SCADA trends.
Queries that join CMMS failure records with SCADA process data complete in under 1 second versus 12 seconds of manual export and spreadsheet correlation.
Data Freshness (Latency)
Incremental CDC pipelines deliver CMMS and SCADA updates to the warehouse in under 5 minutes, down from overnight batch windows, enabling near‑real‑time analytics.
Data Quality Pass Rate
Integrated validation rules ensure 88% of incoming records pass quality gates; quarantined records are flagged for source‑system correction, keeping warehouse tables analytically safe.
Data Warehouse Integration Reference Specifications
Scroll for more
| Source System | Data Type | Integration Method | Warehouse Table | Update Cadence |
|---|---|---|---|---|
| CMMS / EAM | Work orders, failure codes, parts | CDC via API or DB log | fact_work_order, dim_failure | Every 5 minutes |
| SCADA / Historian | Process variables, alarms | OPC UA HA or historian SDK | fact_scada_reading | Continuous or 1‑min batch |
| IoT Sensor Broker | Vibration, temperature, current | MQTT / OPC UA subscription | fact_iot_reading | Real‑time streaming |
| Asset Registry | Equipment hierarchy, specs | API or file import | dim_asset | Daily sync |
| Maintenance Plans | Scheduled tasks, routes | API extract | dim_maintenance_plan | Hourly |
How iFactory Delivers a Complete Maintenance Data Warehouse
A unified data warehouse is the foundation for every advanced maintenance use case — from MTBF dashboards to AI‑driven failure prediction. iFactory builds and maintains that foundation: pre‑built connectors pull data from CMMS, SCADA, and IoT without custom coding, a reconciliation engine maps every record to a common asset hierarchy, and incremental ETL keeps the warehouse fresh. When a reliability engineer investigates a recurring pump failure, they can query the warehouse to pull every work order, the aligned SCADA trend for the failure window, and the IoT vibration spectrum — all in one SQL statement. Facilities can Start Trial and connect their first CMMS and SCADA sources in under an hour using iFactory’s guided integration wizards.
Unified Asset View
Every data point from every source maps to a single, deduplicated equipment record — no more conflicting asset names.
Event‑Aligned Analytics
Work order events anchor sensor data retrieval, enabling precise “before and after” failure analysis across all sources.
Continuous Freshness
CDC and streaming ingestion ensure the warehouse reflects the plant floor in near‑real‑time, never a day old.
Analytics‑Ready Schema
Star‑schema modeling eliminates complex joins, empowering self‑service analytics for reliability teams without SQL expertise.
Building Your Maintenance Data Warehouse: Step‑by‑Step
01
Inventory All Maintenance Data Sources
Catalog CMMS instances, SCADA historians, IoT brokers, and asset registries, noting connection details, data volumes, and refresh requirements.
02
Define the Common Asset Hierarchy
Create the golden asset record structure and map CMMS functional locations, SCADA tags, and IoT topics to the unified model using iFactory’s reconciliation tool.
03
Configure Pre‑Built Connectors
Set up iFactory connectors to extract data from each source using CDC, OPC UA, MQTT, or API calls, applying schema mapping and initial historical backfill.
04
Apply Data Quality and Validation Rules
Define per‑source quality checks, quarantines, and deduplication logic to ensure only clean, attributed data lands in the warehouse fact tables.
05
Transform to Star‑Schema Model
Run iFactory’s transformation jobs that load fact and dimension tables, compute pre‑joined aggregates, and update slowly changing dimensions.
06
Validate Analytics and Set Refresh Schedules
Test cross‑system queries, confirm data freshness SLA, and configure pipeline monitoring alerts. Book a Demo to see the full warehouse build‑out in action.
Frequently Asked Questions
Can I add new data sources after the warehouse is live?
Absolutely. iFactory’s connector library is extensible. New sources can be added and mapped to the asset hierarchy without rebuilding existing tables. Incremental loads begin immediately after configuration.
How does iFactory handle different time zones and timestamps across systems?
All incoming timestamps are normalized to a configurable warehouse time zone (typically UTC or plant local) during ETL. The alignment engine uses normalized timestamps to ensure cross‑system correlations are accurate.
What if my CMMS uses custom fields for failure codes?
iFactory’s schema mapping tool allows you to map any custom field to the standard dim_failure table. Free‑text fields can be parsed with configurable regex or NLP extraction to populate structured failure mode codes.
Is historical backfill possible without affecting live systems?
Yes. iFactory throttles historical extract jobs to stay within source‑system resource limits. Backfill runs in the background, and the pipeline seamlessly switches to incremental mode once caught up.
Can I use my own BI tool on top of the warehouse?
Yes. The warehouse is accessible via standard SQL endpoints. Any ODBC/JDBC‑compatible tool — Power BI, Tableau, Grafana — can query the star‑schema tables directly with full performance.
Turn Fragmented Maintenance Data into a Single, Analytics‑Ready Warehouse
iFactory connects CMMS, SCADA, and IoT sources into a governed, high‑performance data warehouse — delivering the complete asset picture that reliability analytics and AI demand.