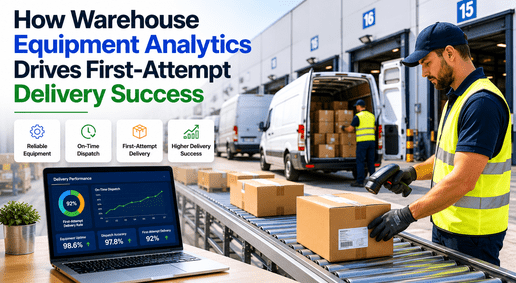
How Warehouse Equipment analytics Drives First-Attempt Delivery Success

By Arel Dixon on May 27, 2026

warehouse-delivery-operations-first-attempt-fulfilment-equipment-link-url.png_optimized_300

Most warehouse and delivery operations attribute first-attempt delivery failures to recipient availability — the package arrived, nobody was home, the delivery window didn't match. That explanation feels accurate because it is sometimes true. But it is incomplete. When equipment failures in the warehouse delay dispatch by 30, 60, or 120 minutes during a peak sort window, delivery drivers depart after the optimal delivery window has already closed. The recipient who would have been home at 2 p.m. is unavailable by 3:45 p.m. when the delayed driver finally reaches the address. The operation records a first-attempt failure, attributes it to recipient unavailability, and misses the operational root cause entirely: a conveyor failure at 11:15 a.m. pushed the dispatch window past the point where on-time first-attempt delivery was still achievable. First-attempt delivery success rate is as much a maintenance metric as it is a logistics metric. The warehouse equipment controlling sort timing, dispatch sequencing, and parcel release to carrier loading is the upstream variable that determines whether drivers are on route at the right time to reach recipients at home. iFactory AI's predictive maintenance and analytics platform creates the operational connection between warehouse equipment reliability and first-attempt delivery performance — giving logistics operations the intelligence to see the true root cause of first-attempt failure rates and the maintenance capability to eliminate the equipment failures that cause them. To see how iFactory AI's platform applies to your operation, Book a Demo with our warehouse analytics engineering team.

Equipment Reliability · Dispatch Timing · First-Attempt Delivery · AI Analytics
How Warehouse Equipment Analytics Drives First-Attempt Delivery Success
Most operations blame recipients for first-attempt delivery failures. The real driver is warehouse equipment failures that delay dispatch past the optimal delivery window. iFactory AI connects equipment reliability data to delivery performance — revealing the maintenance root cause of first-attempt failures and eliminating it before it impacts SLA performance.
30–45% Of first-attempt delivery failures in high-throughput fulfillment operations trace back to dispatch timing delays caused by upstream warehouse equipment failure events
$4–$17 Cost per failed first-attempt delivery — including re-delivery labor, carrier penalty, and customer satisfaction impact — that predictive maintenance eliminates at the source
90 min Average dispatch delay caused by a peak-window conveyor or sorter failure — enough to push delivery windows past recipient availability for 30%+ of affected routes
3–5% First-attempt delivery rate improvement achievable by connecting warehouse equipment reliability management to dispatch timing analytics

The Hidden Causation Chain: How Equipment Failures Become Delivery Failures

The connection between warehouse equipment failure and first-attempt delivery failure is not visible in standard operations reporting because the two events are recorded in different systems with a 3–6 hour time gap between them. Equipment failures appear in the maintenance system. First-attempt delivery failures appear in the TMS or carrier reporting system. Without analytics specifically designed to cross-correlate these datasets by timestamp, the causation chain is invisible — and the true operational root cause of first-attempt failures is consistently misattributed to recipient behavior rather than warehouse equipment performance.

01
Equipment Failure During Peak Sort Window
A conveyor drive motor fails at 10:45 a.m. during the primary sort window for afternoon residential delivery routes. The failure stops a zone handling the residential carrier loading feed — not the entire facility, but the specific zone serving the 1–5 p.m. delivery window.
Maintenance system records: Motor bearing failure, Zone 7, 10:45 a.m., repair completed 12:20 p.m.
02
Sort Backlog Accumulates Behind the Failure Point
During the 95-minute repair window, parcels accumulate in buffer zones or divert through alternative paths at reduced throughput. A backlog of 1,200–1,800 residential parcels builds. When Zone 7 comes back online, the backlog must clear before the residential loading bay can complete carrier dispatch.
Backlog impact: 1,400 residential parcels delayed — loading bay closes 92 minutes behind schedule
03
Dispatch Departs Outside Optimal Delivery Window
Carrier vehicles that should have departed at 12:30 p.m. for the afternoon residential delivery run depart at 2:05 p.m. Drivers operate against a compressed delivery window with the same number of stops — producing later-in-day attempts and first-attempt failures on the final 30–40% of route stops.
Dispatch impact: 92-minute delay pushes final route segment past 6:30 p.m. on an 83-stop residential route
04
First-Attempt Failures Recorded as "Recipient Unavailable"
Delivery attempts at stops 60–83 occur at 6:35–7:15 p.m. instead of the 4:55–5:45 p.m. window recipients expected. Recipients who were home during the promised window are now unavailable. The TMS records 18 first-attempt failures marked "recipient unavailable" — with no connection to the 10:45 a.m. conveyor failure that initiated the cascade.
TMS records: 18 failed first-attempt deliveries "recipient unavailable" — root cause: Zone 7 bearing failure, invisible without cross-system analytics

Why First-Attempt Failure Rates Are More Expensive Than They Appear

First-attempt delivery failure is consistently underestimated as a cost driver because the individual event cost appears modest — $4 to $17 per failed attempt — but the volume is large and the compounding effects extend well beyond the direct re-delivery cost. Understanding the true cost profile reframes the economic case for connecting warehouse equipment reliability to delivery performance.

Direct Re-Delivery Cost
$4–$17 per event
Driver time, fuel, carrier fee, and administrative processing for a second delivery attempt. At a 2–3% first-attempt failure rate on a 50,000-parcel-per-day operation, this is $4,000–$25,500 of daily waste before any multiplier effects are included.
Customer Experience Cost
3–7% repeat rate drop
Repeat purchase rate reduction for e-commerce customers experiencing a first-attempt delivery failure. Customer expectations for same-day and next-day delivery make a single failed attempt a significant satisfaction event — particularly when it occurs inside a promised delivery window.
Carrier Contract Penalty
Six-figure annual exposure
Carrier contracts with first-attempt success rate minimums trigger penalty clauses when performance falls below threshold. For operations with sustained failure rates above 3–5%, carrier penalty exposure can reach six figures annually — often never connected back to the warehouse equipment failures causing dispatch delays.
Operational Compounding Cost
2–3× cost multiplier
Second-attempt deliveries require route optimization adjustments, increase off-peak vehicle utilization, and consume customer service capacity handling inquiries from recipients who expected delivery the previous day. The true cost multiplier on direct re-delivery cost is consistently 2–3× when all secondary impacts are included.
iFactory AI · Warehouse Equipment Analytics
Connect Equipment Reliability to First-Attempt Delivery Performance
iFactory AI's predictive maintenance and analytics platform creates the cross-system connection between warehouse equipment failure events and delivery performance data — revealing the maintenance root cause of first-attempt failures and eliminating the dispatch delays that cause them.
3–5%First-Attempt Rate Gain
70%+Downtime Reduction
6–8 wkFailure Warning Window
14 DaysTo Live Analytics

How iFactory AI Connects Equipment Reliability to Delivery Performance

iFactory AI's platform closes the analytics gap between warehouse maintenance data and delivery performance data through five integrated capabilities. Together, they create the operational connection that transforms equipment reliability from a maintenance metric into a first-attempt delivery performance driver.

01
Predictive Failure Detection — Preventing the Dispatch Delay at Source

iFactory AI's predictive maintenance engine monitors vibration, current, and temperature signatures on conveyor motors, sorter drives, dock equipment, and warehouse automation assets — detecting bearing wear, drive degradation, and thermal anomalies 6–8 weeks before failure. When a predictive alert fires on a sorter drive serving the residential sort zone, maintenance intervenes during a low-throughput window rather than during the 10:00 a.m.–2:00 p.m. peak sort feeding afternoon delivery routes. The failure that would have created a 90-minute dispatch delay during peak never occurs. First-attempt delivery rates are protected before they are ever threatened.

Delivery Impact: Zero dispatch delay from this failure mode — predictive intervention removes it from the peak window entirely before it can affect route timing
02
Dispatch Timing Analytics — Correlating Equipment Events to Delivery Windows

iFactory AI's analytics platform ingests both maintenance event timestamps and dispatch timing data — creating the cross-system correlation that reveals which equipment failure events caused which dispatch delays and which dispatch delays produced which first-attempt delivery failure windows. Operations managers can now see the full causation chain: bearing failure at 10:45 a.m. → 92-minute dispatch delay → 18 first-attempt failures on stops 60–83. This attribution data transforms the root cause conversation from recipient behavior to specific, preventable equipment failure events.

Delivery Impact: Root cause attribution shifts from recipient behavior to equipment events — enabling preventive action rather than operational acceptance of recurring first-attempt failures
03
Peak Window Maintenance Scheduling — Protecting Critical Sort Windows

iFactory AI's CMMS integrates with WCS throughput data to identify the specific daily windows when equipment failure would produce the highest dispatch delay and first-attempt delivery impact. For residential delivery operations, this is typically the 10:00 a.m.–2:00 p.m. primary sort window. All preventive maintenance on equipment serving residential sort zones is scheduled outside this window. Predictive alerts are evaluated against the operational calendar, and intervention timing is recommended to minimize throughput impact while fully protecting the peak dispatch window.

Delivery Impact: Both unplanned failures and planned maintenance incursions are removed from the peak dispatch window — maximum first-attempt rate protection across the operating calendar
04
Equipment Criticality Scoring — Prioritizing by Delivery Impact

Not all warehouse equipment failures produce the same first-attempt delivery impact. A failure in returns processing has no effect on outbound dispatch timing. A failure on the primary residential sort belt is a direct dispatch delay event. iFactory AI's analytics platform calculates equipment criticality scores incorporating first-attempt delivery impact alongside repair cost and downtime duration — ensuring maintenance investment priority is calibrated to delivery performance impact rather than maintenance cost alone. Assets whose failure causes dispatch delays receive elevated monitoring frequency proportional to their delivery impact profile.

Delivery Impact: Maintenance resources concentrate on equipment whose failure causes dispatch delays — maximum delivery performance protection per maintenance dollar invested
05
First-Attempt Rate Dashboard — Closing the Analytics Loop

iFactory AI's analytics reporting module integrates carrier first-attempt delivery rate data with warehouse equipment downtime records and dispatch timing logs — producing the closed-loop dashboard showing the full equipment-to-delivery performance chain in a single operational view. Operations managers see which equipment failure events correlated with first-attempt failure spikes, which sort zones carry the highest delivery performance risk, and whether predictive maintenance interventions are producing measurable improvement in dispatch timing consistency and first-attempt delivery rates. This dashboard is the evidence base for the maintenance budget conversation: maintenance investment produces measurable first-attempt delivery rate improvement that translates to reduced re-delivery cost and carrier penalty avoidance.

Delivery Impact: Equipment reliability investment becomes defensible in delivery performance terms — closing the ROI loop from maintenance cost to delivery revenue protection for finance leadership

Equipment Performance vs. Delivery Outcome: Side-by-Side

The performance difference between a warehouse running reactive maintenance and one running iFactory AI's predictive maintenance platform — measured in delivery performance terms rather than maintenance cost terms — is quantifiable across every dimension of the equipment-to-delivery causation chain.

Performance Dimension Reactive Maintenance Operation iFactory AI Predictive Maintenance
Failure Detection Timing Detected at breakdown — during peak sort window Predictive alert 6–8 weeks before failure — intervention off-peak
Peak Window Downtime Events 2–5 peak-window failures per month on active sorter fleet 70%+ reduction in peak-window failures — dispatch delays eliminated
Average Dispatch Delay per Failure 60–120 minutes per primary sort window failure event Near-zero dispatch delay — failures prevented before they occur
First-Attempt Failure Root Cause Attributed to recipient availability — no equipment correlation Equipment failure events correlated to failure spikes — true root cause visible
Re-Delivery Cost Exposure $4–$17 per failed attempt × volume of equipment-driven delays Equipment-driven re-delivery cost reduced 70%+ alongside downtime reduction
Carrier Penalty Exposure First-attempt rate penalties triggered by sustained dispatch delays Carrier first-attempt rate meets contract threshold — penalty exposure eliminated
Maintenance Budget Defense Justified by repair cost and downtime hours alone Justified by first-attempt rate protection and carrier penalty avoidance data
Customer Experience Impact Repeat purchase rate reduced 3–7% for equipment-driven failed attempts Consistent first-attempt delivery protects customer satisfaction and repeat purchase

Equipment Classes Ranked by First-Attempt Delivery Impact

Not every warehouse equipment failure has equal impact on first-attempt delivery rates. Delivery impact depends on where in the facility the failure occurs, when during the operating day it occurs, and how long repair takes. The framework below maps warehouse equipment classes against their typical first-attempt delivery impact profile — the foundation for iFactory AI's equipment criticality scoring.

HIGHEST DELIVERY IMPACT
Primary Sort Conveyors & Cross-Belt Sorters
The primary residential and B2C sort belt is the highest-impact asset class for first-attempt delivery rates. A failure during the 10 a.m.–2 p.m. peak sort window produces the full causation chain: backlog accumulation → dispatch delay → late delivery window → first-attempt failures on late-route stops. iFactory AI monitors all primary sort drive motors with vibration and current sensors at highest priority and earliest intervention threshold.
Cross-belt sorters · Tilt-tray sorters · Primary induction conveyors · Zone transfer belts
HIGHEST DELIVERY IMPACT
Carrier Loading Bay Systems & Dock Levelers
Dock leveler failures preventing carrier vehicle loading during dispatch windows create direct dispatch delays even when all upstream sort equipment operates normally. A single failed dock leveler blocking a carrier bay during loading delays dispatch for the entire vehicle load — affecting every delivery on that route. Peak-window PM scheduling keeps dock systems operating through the critical loading window.
Dock levelers · Loading bay conveyors · Vehicle restraints · Overhead dock doors
SIGNIFICANT DELIVERY IMPACT
Induction Stations & Merge Points
Induction station failures reduce sort throughput at the point where parcels enter the sort system — creating throughput degradation that extends the sort window rather than stopping it entirely. Multiple simultaneous induction station failures can produce the same dispatch delay profile as a primary sorter failure. iFactory AI tracks induction station uptime as a fleet-level metric rather than individual asset metric.
Induction belts · Merge points · Scan-and-apply stations · Gap control conveyors
SIGNIFICANT DELIVERY IMPACT
Labeling & Manifesting Systems
Print-and-apply labeling system failures and manifesting scanner failures block parcel release to the sort system — creating upstream bottlenecks that produce dispatch delays when failures occur during the labeling peak window for outbound sorts. Label print failures can delay dispatch even after the sort backlog clears, because carrier manifesting cannot complete without valid labels.
Print-and-apply systems · Scan tunnels · Manifest scanners · Weigh-and-dimension stations
LOWER DELIVERY IMPACT
Returns Processing & Receiving Equipment
Equipment failures in returns processing and inbound receiving zones do not directly affect outbound dispatch timing or first-attempt delivery rates. These failures carry significant operational cost — labor disruption, inventory delay — but the delivery performance impact is indirect and deferred. Maintenance prioritization reflects this lower delivery criticality while ensuring repair does not consume resources needed for high-impact assets.
Returns conveyors · Receiving dock equipment · Cross-dock staging systems
LOWER DELIVERY IMPACT
Storage & Buffer Retrieval Systems
AS/RS systems and carousels serving buffer storage rather than active outbound sort have minimal direct first-attempt delivery impact unless they serve goods-to-sort functions. Failures in pure storage equipment affect inventory access and replenishment cycles but do not create the dispatch delays that translate to delivery performance degradation on outbound routes.
Buffer storage AS/RS · Static racking systems · Non-outbound carousels · Overflow zones

Expert Perspective

The single most underreported driver of first-attempt delivery failure in fulfillment operations is warehouse equipment downtime during the primary sort window. I have reviewed first-attempt delivery performance data across many fulfillment operations, and the pattern is consistent: operations with sustained first-attempt failure rates above 4% almost universally have reactive maintenance programs that allow equipment failures during peak sort windows. Operations with rates below 2% almost universally have predictive maintenance programs protecting those windows. The causal connection between equipment reliability and delivery performance is not speculative — it is measurable. What makes it invisible in most operations is the absence of analytics that crosses the boundary between the maintenance system and the TMS. When you overlay maintenance event timestamps on dispatch timing charts and first-attempt failure rate trends, the equipment causation pattern is unmistakable. The operations that see this and act on it — by moving peak-window equipment to predictive maintenance — see first-attempt delivery rate improvements of 2 to 5 percentage points. At scale, that improvement is worth far more than the maintenance program cost that delivers it.
— VP of Fulfillment Operations, U.S. National Last-Mile Delivery Network · 18 Years Logistics & Fulfillment Operations · Former Head of Operations Engineering, Fortune 100 E-Commerce · Certified Supply Chain Professional (CSCP)

What Warehouse Operations Achieve: The Maintenance-to-Delivery ROI Chain

3–5%
First-Attempt Rate Improvement
Eliminating equipment-driven dispatch delays removes the peak-window failures pushing delivery windows past recipient availability — directly improving first-attempt success rates on affected routes
70%+
Peak-Window Downtime Reduction
Predictive maintenance interventions scheduled off-peak eliminate the unplanned failures during sort windows that drive dispatch delays — the upstream cause of the first-attempt failure cascade
$4–$17
Re-Delivery Cost Eliminated Per Event
Every first-attempt failure prevented by eliminating an equipment-driven dispatch delay saves the full re-delivery cost plus carrier penalty exposure and customer satisfaction impact
<12 mo
Platform ROI Achieved
Re-delivery cost avoidance, carrier penalty elimination, and maintenance cost reduction from predictive versus reactive operations typically return the platform investment within the first year

Ready to see how iFactory AI connects your warehouse equipment reliability data to first-attempt delivery performance? Book a Demo — we configure the analytics correlation for your specific WCS, TMS, and equipment fleet.

Conclusion: First-Attempt Delivery Rate Is a Maintenance Metric

The operational connection between warehouse equipment reliability and first-attempt delivery performance is real, measurable, and actionable — but it is invisible to operations that manage maintenance data and delivery data in separate systems without an analytics bridge. The bearing failure at 10:45 a.m. that creates 18 failed delivery attempts at 6:45 p.m. is a single operational event with a clear beginning and end — recorded as two unrelated data points in two unrelated systems and attributed to two unrelated causes. iFactory AI's predictive maintenance and analytics platform closes this gap — creating the cross-system connection that reveals the equipment root cause of first-attempt delivery failures, provides the predictive warnings to eliminate them before they occur, and builds the analytics evidence base that makes the maintenance investment case in delivery performance terms. First-attempt delivery rate is not just a TMS metric. It is a warehouse maintenance metric in disguise — and the operations that manage it as such consistently outperform those that continue to attribute it to forces outside their control.
iFactory AI · Warehouse Equipment Analytics & Predictive Maintenance
Connect Your Equipment Reliability Data to Your Delivery Performance
Predictive maintenance. Dispatch timing analytics. Equipment criticality scoring. Cross-system first-attempt rate correlation. iFactory AI delivers the analytics platform that reveals the maintenance root cause of first-attempt delivery failures — and eliminates the dispatch delays that cause them.

Frequently Asked Questions

Q How does iFactory AI create the connection between warehouse equipment events and delivery performance data?
iFactory AI's analytics platform creates the equipment-to-delivery connection by ingesting three data streams and correlating them chronologically: warehouse equipment failure events and repair timestamps from the CMMS, dispatch timing logs from the WCS or WMS, and first-attempt delivery performance data from the TMS or carrier reporting system. The correlation engine matches equipment failure windows against dispatch delay events on the same sort zones, then matches dispatch delays against first-attempt failure rate changes on the delivery routes served by those zones. This cross-system correlation is built automatically from the data integration layer — operations teams do not need to manually build the connection. Book a Demo to see the correlation architecture for your specific TMS and WCS data sources.
Q What TMS and carrier reporting systems does iFactory AI integrate with for first-attempt delivery data?
iFactory AI integrates with major TMS and carrier reporting platforms used in U.S. last-mile and fulfillment operations. TMS integrations include Oracle TMS, SAP TM, MercuryGate, Manhattan TMS, McLeod Software, and Trimble TMS. For carrier-direct reporting, the platform accepts data feeds from UPS, FedEx, USPS, Amazon Logistics, OnTrac, and regional carrier API exports in standard formats. Where direct API integration is not available, scheduled data file imports from carrier portals provide the delivery performance data needed for the correlation analysis. The integration team assesses your specific TMS and carrier reporting configuration during the deployment planning session.
Q How quickly does the correlation between equipment failures and first-attempt delivery rates become statistically meaningful?
Statistical significance of the equipment-to-delivery correlation depends on the frequency of equipment failure events and the volume of delivery routes affected. For high-throughput operations with 2–5 peak-window equipment failures per month, the correlation pattern becomes statistically meaningful within 60–90 days of data integration. For operations with lower failure frequency, the correlation analysis uses historical data first — importing 12–24 months of maintenance and delivery records to establish the pattern before the live analytics layer adds real-time correlation. The analytics team conducts an initial correlation analysis during deployment and presents findings to operations leadership before the live dashboard is activated. Book a Demo to understand the correlation timeline for your specific data history and failure frequency profile.
Q Can iFactory AI distinguish equipment-driven first-attempt failures from genuine recipient availability failures?
Yes — the analytics engine separates equipment-driven first-attempt failures from baseline recipient availability failures through temporal pattern analysis. Genuine recipient availability failures distribute relatively randomly across route positions and delivery time-of-day windows regardless of dispatch timing. Equipment-driven first-attempt failures cluster at the tail-end of delayed routes and correlate with specific equipment failure events during the preceding sort window. The analytics platform identifies this clustering pattern and quantifies the equipment-attributable first-attempt failure increment above the baseline recipient availability rate. iFactory AI's delivery performance dashboard presents both the baseline rate and the equipment-attributable increment separately — giving operations teams the clarity to address both failure types with appropriate operational responses.
Q How does the maintenance budget conversation change when first-attempt delivery data is connected to equipment performance?
Connecting maintenance data to delivery performance data converts maintenance from a cost center into a revenue protection function with quantifiable ROI. Before the connection, maintenance budget is defended by repair cost reduction and downtime minimization. After the connection, it is defended by first-attempt delivery rate protection, re-delivery cost avoidance, and carrier penalty elimination — metrics translating directly to P&L impact. A predictive maintenance investment preventing three peak-window sorter failures per month eliminates approximately 54 first-attempt delivery failures per event at $4–$17 per failure — or $648–$2,754 of avoided cost per prevented failure event, excluding carrier penalty avoidance and customer satisfaction impact. When this calculation is presented alongside the maintenance investment cost, the ROI case becomes straightforward to defend to finance leadership.

Share This Story, Choose Your Platform!