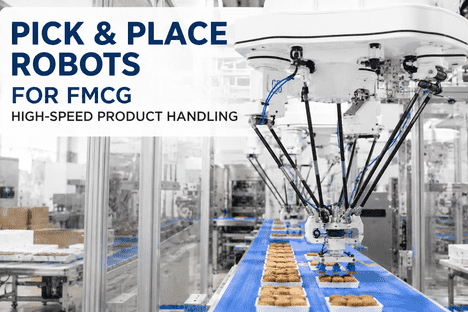
A beverage manufacturer in the UK ran eight high-speed filling lines producing 1.2 million bottles per day at 720 units per minute per line. When Line 4 experienced a recurring capping misalignment issue at 3:45 PM on a Friday, the line lost 47 minutes of production before the root cause was identified — and the quality check on the preceding 12,000 bottles had already been bypassed because the vision inspection system was calibrated for 600 ppm and could not keep pace at the 720 ppm line speed. The total cost of the incident, including scrapped product, rework, line restart, and lost production capacity, exceeded £83,000 for a single shift event. Across high-speed FMCG packaging, 58% of quality deviations on lines running above 600 units per minute are traced not to equipment failure but to speed-quality trade-offs that were never formally optimised — the line was running faster than the inspection and changeover systems could support. FMCG production teams that deploy AI-driven line efficiency optimisation and Book a Demo with iFactory receive a facility-specific line efficiency assessment that maps every speed, quality, and changeover interaction across their high-speed packaging lines before any configuration begins.
FMCG Production — High-Speed Line Efficiency 2026
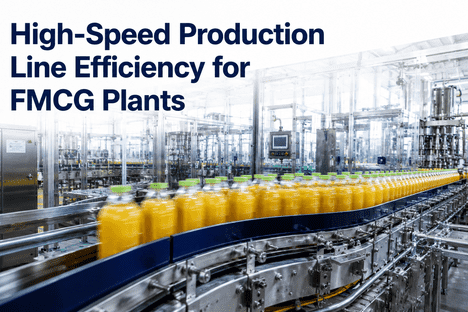
High-Speed Production Line Efficiency for FMCG Plants: AI-Driven Speed and Quality Optimisation
12–18% OEE improvement · 35% fewer speed-related quality deviations · 27-minute average changeover reduction · 600–1,200 ppm line optimisation · Real-time speed-quality balancing · Multi-line analytics dashboards.
12–18%
OEE improvement on high-speed lines
35%
Fewer speed-related quality deviations
27 min
Average changeover time reduction
600–1,200
Units per minute line speed range
The Three Efficiency Bottlenecks AI Optimisation Eliminates From High-Speed FMCG Lines
At 600–1,200 units per minute, every second of unplanned stoppage costs 10–20 units of lost production, and every minute of changeover downtime costs 600–1,200 units of capacity. Traditional line efficiency approaches based on manual OEE tracking and reactive troubleshooting cannot keep pace with modern high-speed packaging demands. AI-driven line efficiency optimisation solves three interconnected problems that exist across every FMCG high-speed operation: the speed-quality trade-off (running faster than inspection and changeover systems can support creates hidden quality and waste costs), the changeover time penalty (high-speed lines lose 45–90 minutes per changeover when optimised by experience rather than data), and the line-balancing blind spot (upstream and downstream speed mismatches cause micro-stoppages that compound into significant OEE loss). These are not independent problems — a filler running 5% faster than the labeler creates 30-second micro-stoppages every 8–12 minutes, accumulating 45–90 minutes of hidden downtime across an 8-hour shift. AI line efficiency optimisation operating on real-time production data addresses all three simultaneously.
1
Speed-Quality Trade-Off: 58% of Quality Deviations on Lines Above 600 ppm Are Speed-Related
When line speed exceeds the calibrated range of inspection systems — vision cameras, checkweighers, metal detectors, x-ray systems — quality deviations go undetected or trigger false rejects that compound into line stoppages. A carbonated beverage filler running at 800 ppm that experiences a 50-millisecond fill-head timing drift will under-fill 12–15 bottles before the checkweigher detects the trend, generating product waste and potential line clearance. FMCG plants that deploy AI-driven speed-quality optimisation models consistently reduce speed-related quality deviations by 35% while increasing effective line speed by 8–12%, because the AI model dynamically adjusts line speed based on real-time quality feedback rather than running at a fixed setpoint that trades one for the other. The optimisation model learns the optimal speed envelope for each SKU, packaging format, and ambient condition — enabling operators to run consistently at the maximum speed that quality systems can support rather than conservatively below it.
58% of deviations speed-related
35% reduction with AI optimisation
8–12% effective speed increase
2
Changeover Time Penalty: 45–90 Minutes Lost Per Changeover on High-Speed Lines
High-speed FMCG lines require 45–90 minutes for format changeovers — cleaning, tooling swap, parameter adjustment, start-up waste, and inspection verification. When changeovers are managed by operator experience rather than standardised, data-driven procedures, actual changeover times vary 40–60% between shifts and operators. The cost of 60 minutes of changeover downtime on a line running 800 ppm with a contribution margin of $0.08 per unit is $3,840 per changeover — and plants running 3–5 changeovers per day lose $11,500–$19,200 per day in capacity alone. AI-driven changeover optimisation using SMED-based time analysis, automated parameter pre-setting, and start-up waste reduction algorithms consistently reduces average changeover time by 27 minutes (a 38% reduction) and reduces start-up waste by 45% — delivering documented payback within 6–10 weeks on single high-speed lines.
45–90 min per changeover
38% reduction with SMED + AI
6–10 week payback period
3
Line-Balancing Blind Spot: Micro-Stoppages Compound Into 45–90 Minutes of Hidden Downtime Per Shift
When individual machines on a high-speed line operate at slightly different speeds — filler at 810 ppm, labeler at 785 ppm, capper at 795 ppm, packer at 790 ppm — the speed mismatch creates micro-stoppages of 5–30 seconds that are rarely recorded in OEE systems as downtime events but accumulate to 45–90 minutes per shift of hidden capacity loss. A filler that runs 2.5% faster than the labeler will trigger an accumulation-table full condition every 8–12 minutes, causing a 15-second filler pause each cycle. Over an 8-hour shift, this pattern repeats 40–60 times, accumulating 10–15 minutes of hidden stoppage time from that single mismatch. AI line-balancing models using real-time speed data from every machine on the line identify and resolve these mismatches by recommending optimal relative speed targets, buffer management rules, and accumulation zone settings — delivering 5–8% OEE improvement from balancing alone without any capital investment.
45–90 min hidden downtime/shift
5–8% OEE gain from balancing
Zero capital investment required
AI Line Efficiency Optimisation Deployment Models for High-Speed FMCG: Three Configurations
Model A
Single-Line Speed-Quality Optimiser
Individual High-Speed Line Optimisation
AI model focused on optimising speed and quality interaction on a single high-speed packaging line. Ingests real-time line speed, reject rate, checkweigher data, vision inspection results, and micro-stoppage events from PLC and SCADA systems. Dynamically adjusts target line speed based on real-time quality feedback — reducing speed when quality deviations increase and increasing speed when quality systems can support higher throughput. Generates automated speed adjustment recommendations and shift performance summaries. This model delivers immediate OEE improvement (8–12%) on the targeted line without requiring cross-line data integration or enterprise deployment complexity.
OEE improvement: 8–12% on targeted line
Deployment: 3–4 weeks per line
ROI: $8–$15 per $1 invested
Book a Demo
Model B
Multi-Line Performance Analytics Platform
Cross-Line Pattern Detection and Benchmarking
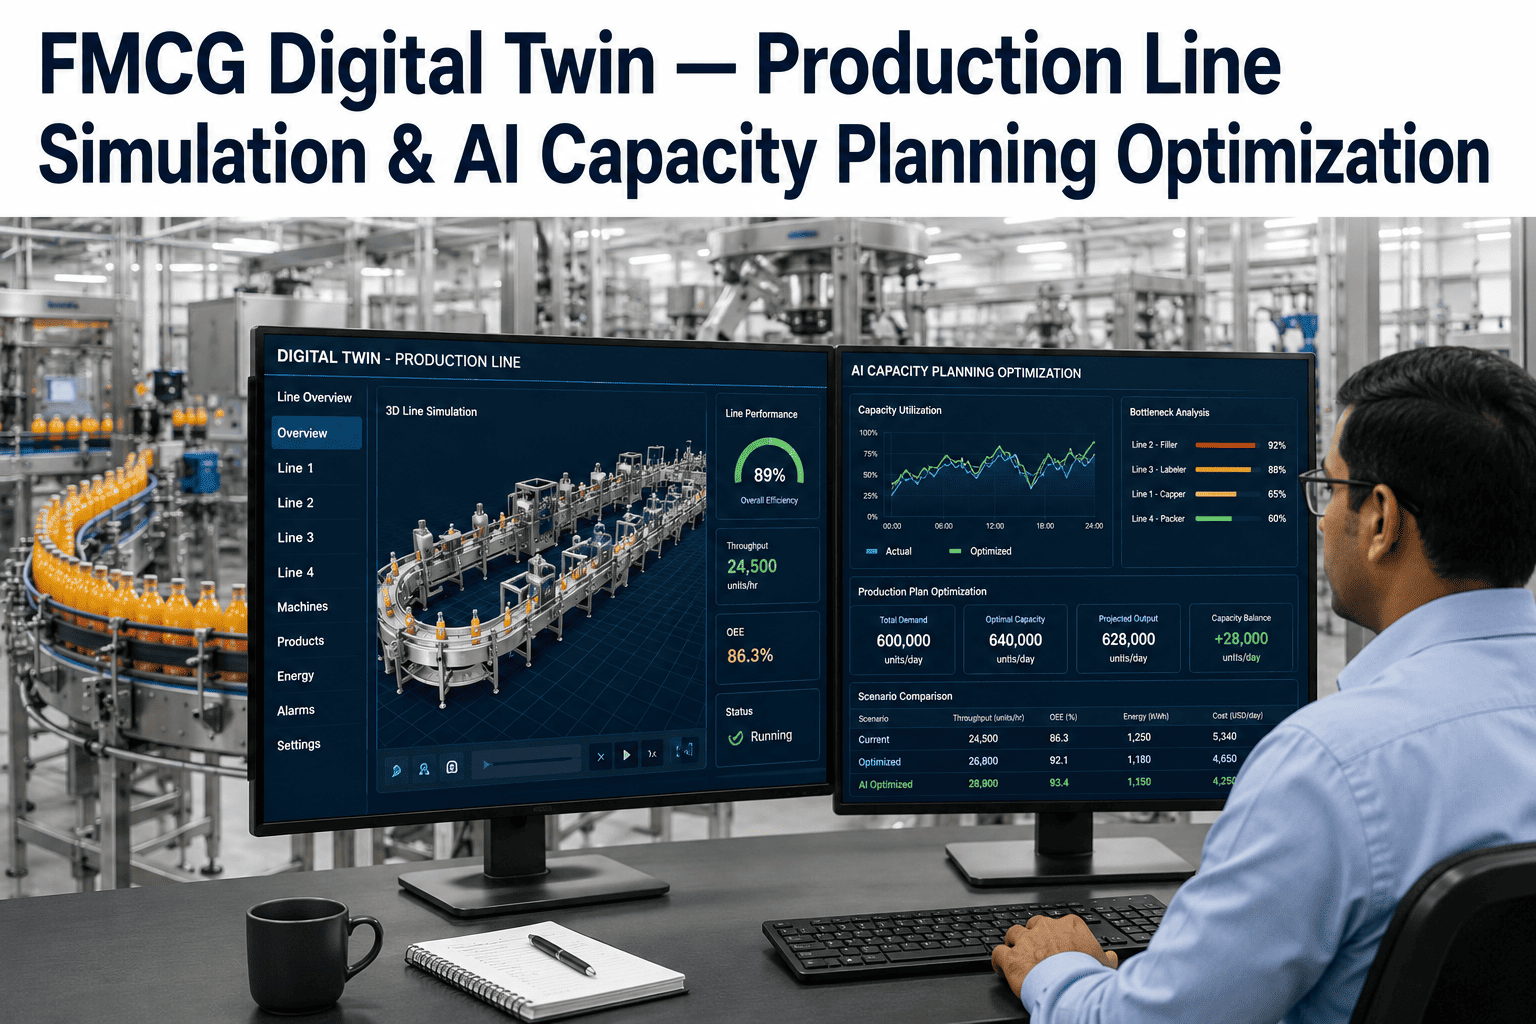
AI models deployed across multiple high-speed lines (filling, labelling, capping, packaging) detecting cross-line performance patterns invisible to single-line analysis. Correlates speed, quality, changeover, and micro-stoppage data across lines, SKUs, shifts, and operator teams to identify systemic efficiency opportunities. Benchmarks each line against internal best practices and external industry standards. Includes automated shift performance dashboards with root cause classification of every OEE loss category. This model delivers maximum network efficiency benefit — identifying best-practice transfer opportunities across lines and shifts that compound into 12–18% total OEE improvement across the plant.
OEE improvement: 12–18% plant-wide
Deployment: 6–8 weeks for 4–8 lines
ROI: $12–$20 per $1 invested
Talk to an Expert
Model C
Full-Stack Production Optimisation Suite
Speed + Quality + Changeover + Maintenance + Energy
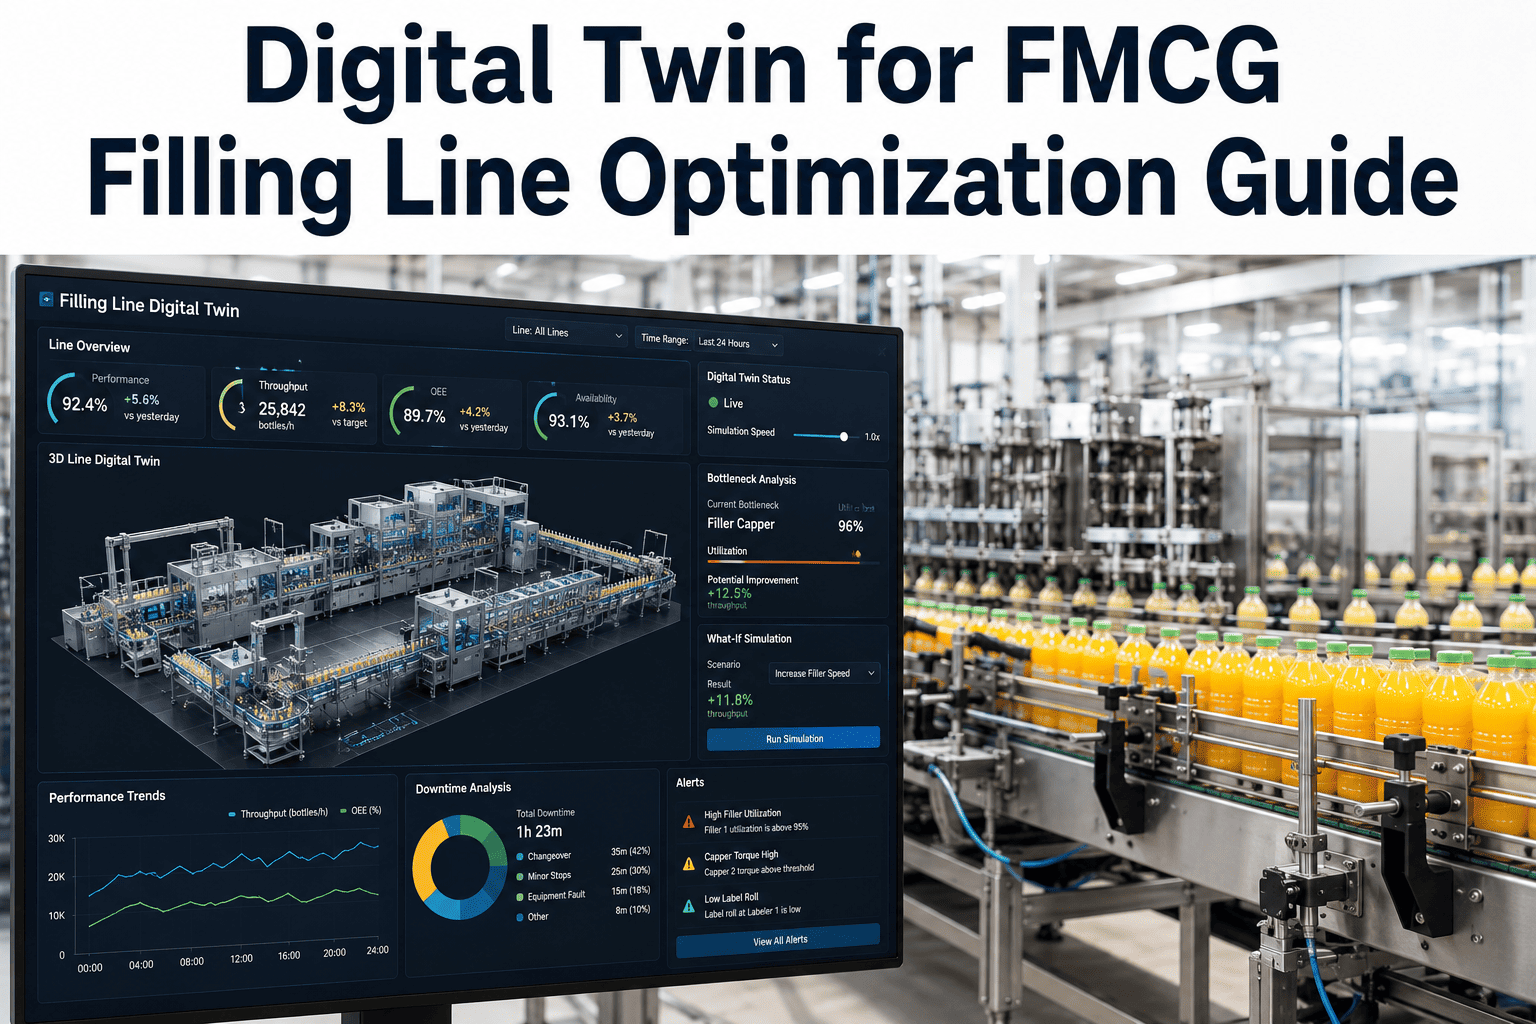
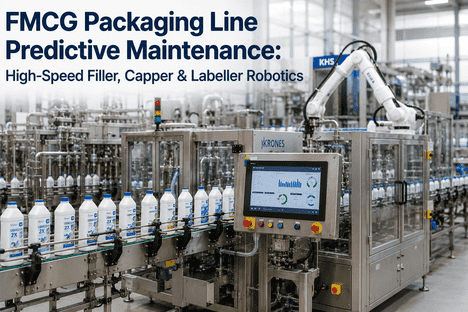
Complete AI line efficiency platform: single-line speed-quality optimisation + multi-line performance analytics + automated changeover time tracking with SMED analysis + predictive maintenance integration for high-speed machine health + energy-per-unit optimisation. AI-detected efficiency loss patterns auto-generate root cause analysis tags and corrective action recommendations. Digital twin simulation models forecast the impact of speed changes, format changes, and line configuration changes before implementation. Real-time OEE dashboards with automated loss classification eliminate manual data collection effort entirely. This model delivers maximum operational and financial benefit — transforming high-speed line efficiency from a reactive troubleshooting activity to a predictive, data-driven optimisation discipline.
Total OEE improvement: 15–22%
Changeover reduction: 35–45%
ROI: $15–$30 per $1 invested
Book a Demo
What AI Line Efficiency Optimisation Integration Includes: Sensors, PLCs, MES, OEE
Deploying AI-driven line efficiency optimisation across high-speed FMCG lines requires more than model training — it demands production line telemetry integration (PLC, SCADA, sensors), data normalisation across OEM machine types, AI model calibration per line and SKU, MES/MOM system connectivity (Siemens, Rockwell, Wonderware, Ignition), and OEE data integration. iFactory's deployment package includes all required components, pre-configured for high-speed FMCG packaging environments. Talk to an Expert to scope the specific deployment model that fits your line configuration and efficiency targets.
Line speed and quality data ingestion
Real-time data pipeline
PLC, SCADA, vision, checkweigher
Must ingest existing line control and inspection data without additional sensors — pre-built PLC connectors reduce integration from weeks to days
AI speed-quality optimisation model
Trained + deployed
Per-line and per-SKU calibration
Generic models fail on line-specific dynamics — trained models deliver 90%+ accuracy on your line's machine configuration, product formats, and ambient operating conditions
Changeover time and waste tracking
Automated data capture
SMED analysis, start-up waste
Manual changeover tracking is inconsistent and incomplete — automated capture from line events provides accurate, granular data for SMED-based reduction programmes
Micro-stoppage and line-balancing analytics
Real-time detection and root cause
Sub-30 second event classification
Micro-stoppages below OEE recording thresholds cause 45–90 min/shift hidden loss — automated detection makes them visible and actionable for the first time
MES/MOM and OEE system connectivity
Bi-directional data sync
Siemens, Rockwell, Wonderware, Ignition
Optimisation results must flow into existing MES dashboards and OEE reporting — standard connectors for major MES platforms ensure data consistency
Implementation and change management support
6–8 week hands-on
FMCG-experienced engineers
AI line optimisation changes operator workflows and decision processes — dedicated change management support ensures adoption and sustained efficiency gains
FAQ: High-Speed FMCG Line Efficiency Optimisation
Deploy AI Line Efficiency Optimisation That Maximises Your High-Speed FMCG Production
12–18% OEE improvement. 35% fewer speed-related quality deviations. 27-minute average changeover reduction. 5–8% OEE gain from line balancing alone. Real-time speed-quality optimisation with per-SKU calibration. Deployed across filling, labelling, capping, and packaging lines — with 6–8 week implementation support included and no additional hardware required.
OEE Improvement
Speed-Quality Optimisation
Changeover Reduction
Micro-Stoppage Elimination
No Additional Hardware
3–4 Weeks Live