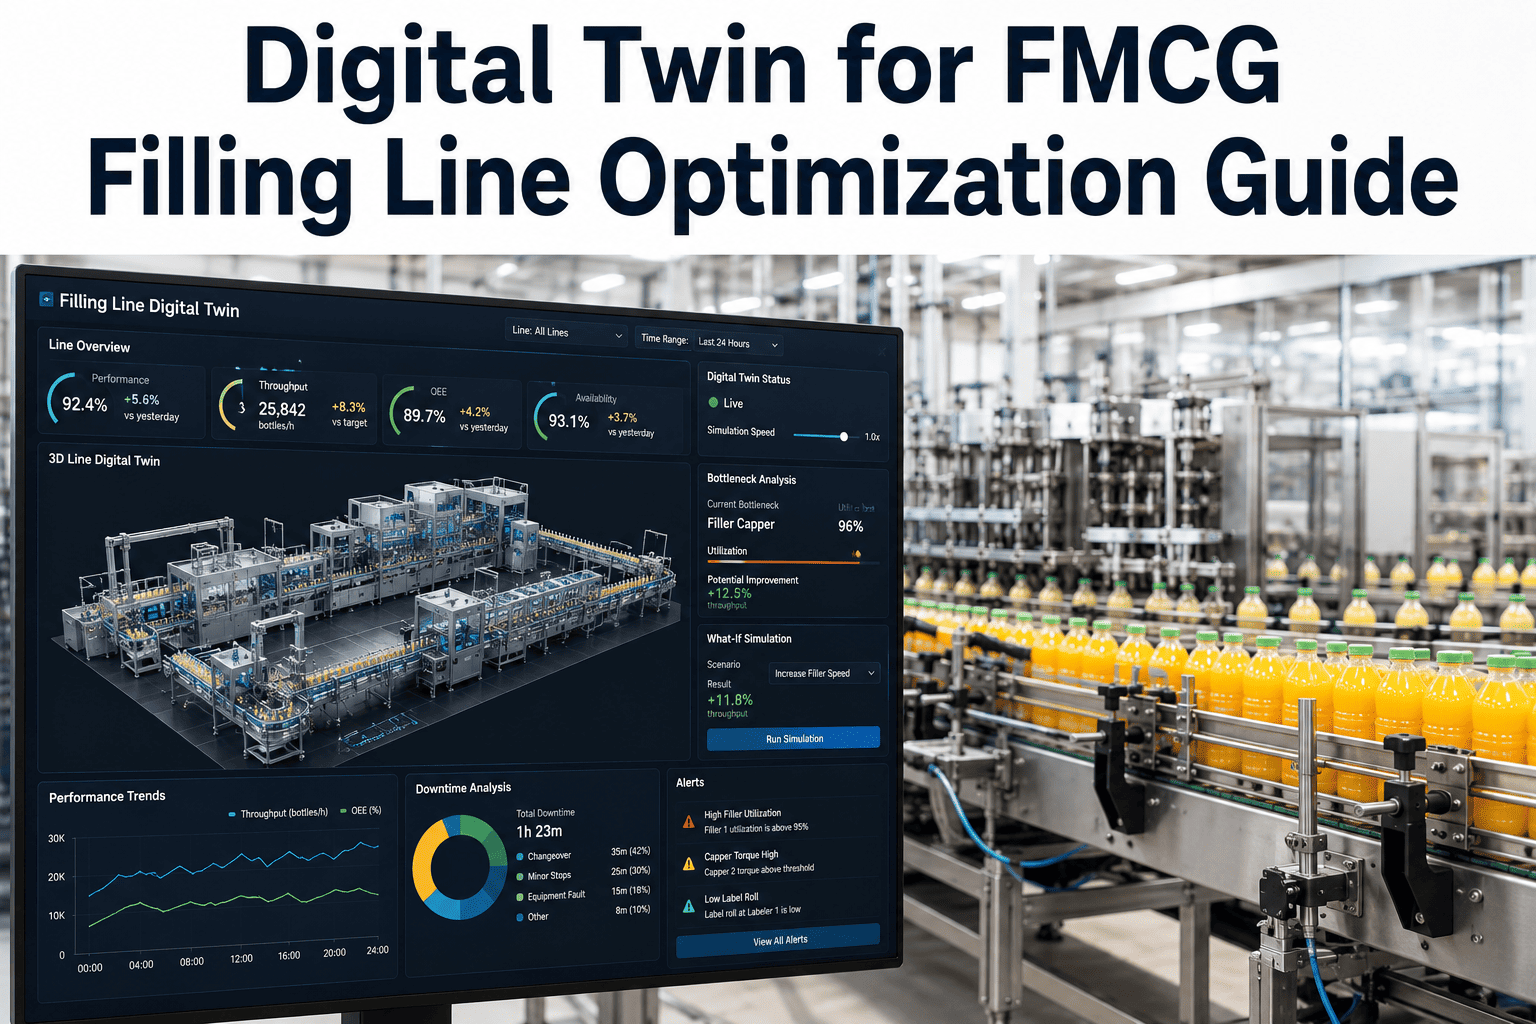
A filling line that loses ninety seconds to a micro-stoppage every twenty minutes doesn't look broken to anyone watching it run, it looks like normal operation, because each individual stoppage is too short and too routine to trigger any alarm or investigation. Add those ninety-second gaps up across a full shift, though, and they frequently account for a larger share of lost output than the rare, dramatic breakdown that actually gets a maintenance ticket filed. Filling lines are especially prone to this pattern because servo-driven nozzles, capping heads, and conveyors all interact at high speed with tight tolerances, and finding the actual root cause among dozens of interacting components is exactly the kind of problem a simulation-connected twin is built to solve.
The Losses That Never Trigger An Alarm Are Usually The Biggest Ones
Micro-stoppages, servo interaction issues, and thermal drift on filling lines rarely show up as a single dramatic failure. A digital twin connected to real production data surfaces these patterns and their root causes in days instead of months of manual investigation.
Three Interacting Systems Make Root-Cause Analysis Genuinely Difficult
A modern filling line combines servo-driven fill heads, precision capping mechanisms, and synchronized conveyor timing, all operating within tolerances tight enough that a small drift in any one component can cascade into a stoppage that appears, on the surface, to originate somewhere else entirely. A capper that seems to jam intermittently might actually be reacting to a slight timing drift upstream at the filler, which itself might be responding to thermal expansion in a component that's been running warm for hours. Chasing these cascading interactions by watching the line and reviewing maintenance logs manually is slow and often lands on the wrong component, because the visible symptom and the actual root cause are frequently at opposite ends of the line.
How A Connected Digital Twin Actually Isolates The Root Cause
Correlate Timing Across Every Station
Live data from filler, capper, and conveyor stations is aligned on a single timeline, revealing which component's drift consistently precedes a stoppage elsewhere.
Simulate The Suspected Root Cause
The suspected component's behavior is reproduced in the virtual model to confirm it actually produces the downstream symptom before any physical intervention.
Test The Fix Virtually First
A proposed adjustment, whether a timing change or a mechanical tolerance fix, is validated in simulation before it's applied to the running line.
Confirm With Live Data After Deployment
Post-fix production data is compared against the simulated prediction to confirm the root cause was correctly identified and resolved.
Stop Guessing Which Component Is Actually Causing The Stoppage
iFactory correlates real production data across every station on your filling line and confirms root causes in simulation before any physical fix is attempted.
The Recurring Culprits Behind Filling Line Micro-Stoppages
Servo Timing Drift Under Sustained Load
Servo motors can gradually shift their timing response as they run continuously under load, a drift too small to notice in a single cycle but large enough to cause intermittent misalignment over a shift.
Thermal Expansion In Fill Head Components
Components that run warm over hours of continuous operation can expand just enough to alter fill accuracy or nozzle alignment, producing stoppages that correlate with time-of-shift rather than any single event.
Container Variability At The Infeed
Minor dimensional variation in incoming containers, within supplier tolerance but at the edge of it, can interact poorly with fixed capping or labeling mechanisms tuned to a narrower range.
Conveyor Synchronization Lag
A conveyor running slightly out of sync with upstream and downstream equipment creates timing gaps that compound into stoppages as the shift progresses and small lags accumulate.
What Micro-Stoppage Reduction Typically Recovers On A Filling Line
| Metric | Before Root-Cause Fix | After Root-Cause Fix |
|---|---|---|
| Micro-stoppage frequency | Multiple per shift, unresolved | Substantially reduced |
| Root cause identification time | Weeks of manual investigation | Days with correlated data |
| OEE performance component | Suppressed by unresolved drift | Recovers measurably |
| Maintenance approach | Reactive, symptom-focused | Targeted at confirmed cause |
A Realistic First Step For A Filling Line Optimization Project
The fastest path to value isn't building a full plant-wide model on day one, it's connecting live data across a single filling line's stations first and letting the correlation analysis surface the highest-impact stoppage pattern to investigate. Most plants find that a small number of recurring root causes account for the majority of micro-stoppage losses, which means the first month of a project often delivers a disproportionate share of the total available recovery, simply by identifying and fixing the two or three components responsible for the bulk of the problem. Expanding the connected model to additional lines afterward becomes considerably faster, since the data correlation and simulation approach established on the first line transfers directly rather than starting over.
Questions FMCG Teams Ask About Filling Line Digital Twin Optimization
Find Your Filling Line's Real Root Causes, Not Just Its Symptoms
See how iFactory correlates data across every station on your line and confirms the actual source of your recurring micro-stoppages before any physical change is made.