Finance teams rarely reject a digital twin proposal because they doubt it works, they reject it because the business case reads like an engineering pitch instead of a financial one. Vague language about "reduced risk" and "better visibility" doesn't survive a capital review the way a specific number does: four weeks of commissioning time saved at a known daily labor cost, or a documented downtime incident avoided worth a calculable dollar figure. The plants that get digital twin investments approved quickly are the ones that translate simulation capability into the same currency finance already uses, and that translation is usually the missing piece, not the technology itself.
The Digital Twin Business Case That Actually Survives A Finance Review
Commissioning weeks saved, downtime avoided, and OEE gained all translate into specific, defensible dollar figures. Here's how to build that case with real numbers instead of engineering enthusiasm.
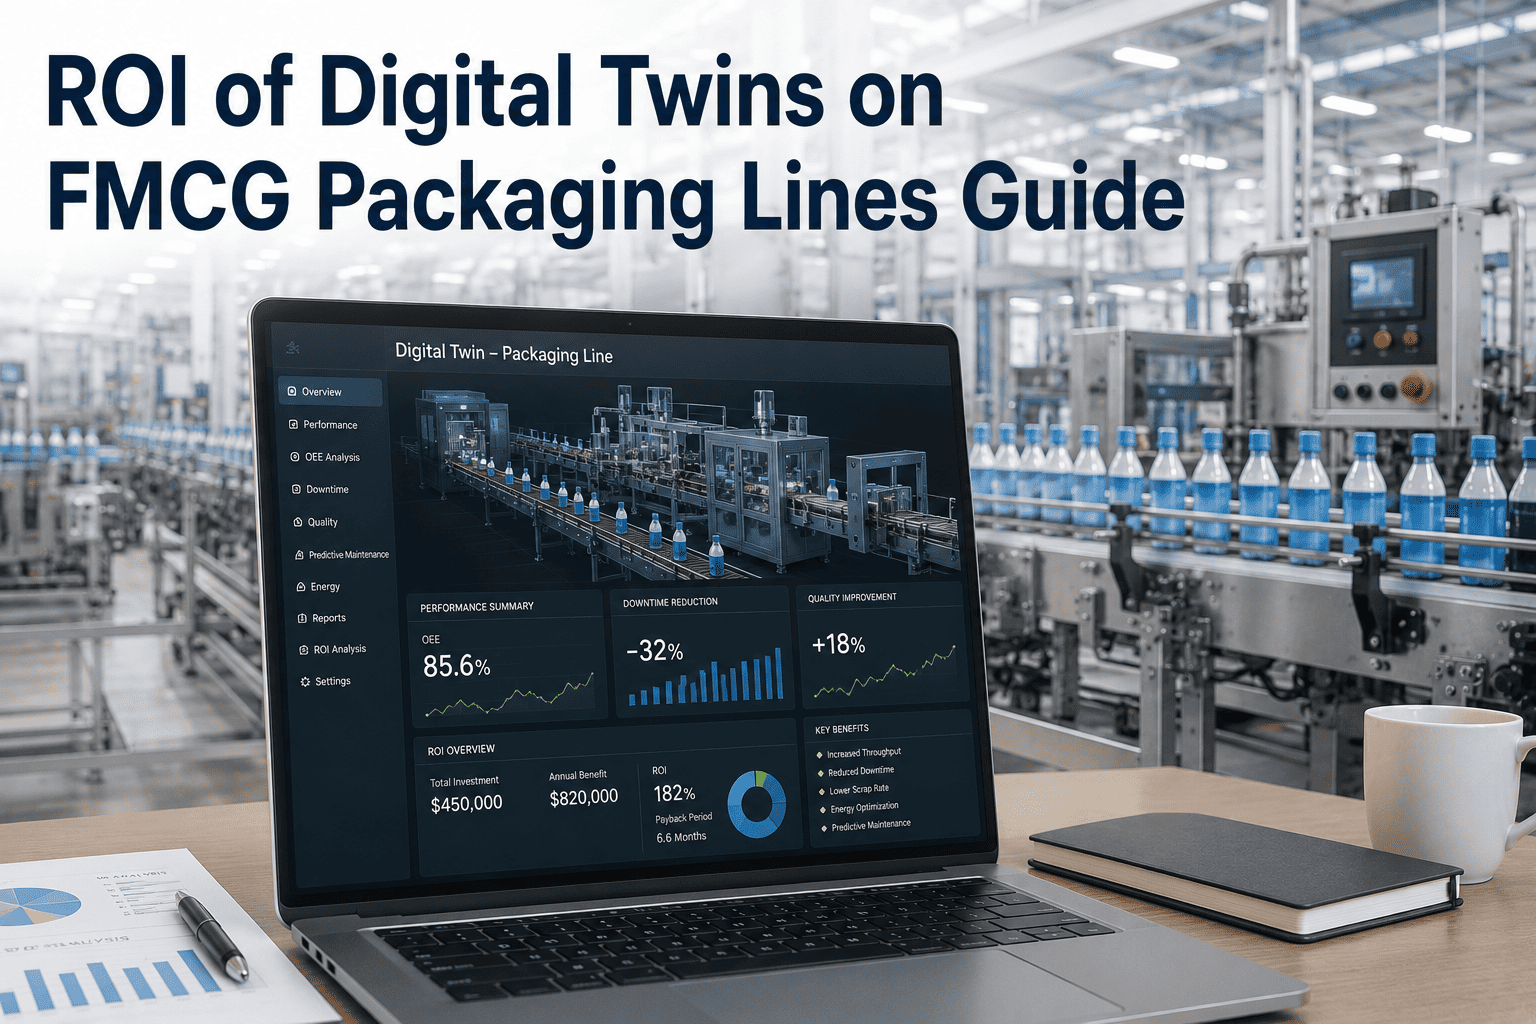
Where Digital Twin ROI On A Packaging Line Actually Comes From
Commissioning Time Saved
Every week cut from a line startup avoids the labor cost of specialized crews on site plus the opportunity cost of delayed production ramp-up.
Downtime Avoided
Integration errors and changeover mistakes caught virtually never become live production stoppages, each of which carries a direct, calculable cost.
OEE And Capacity Gains
Idle-time reduction and validated capacity changes compound into measurable output gains across the equipment's remaining operating life.
A Worked Example: What Commissioning Savings Actually Look Like In Numbers
Consider a mid-size FMCG packaging line installation where a commissioning crew of roughly eight specialists, combining mechanical, electrical, and controls expertise, is on site during startup. At a blended fully-loaded labor rate in the range of $85 to $120 per person per hour, an eight-hour day for that crew runs somewhere between roughly $5,400 and $7,700 in direct labor cost alone, before counting the opportunity cost of delayed production output. If virtual commissioning cuts four weeks from a startup timeline, and each week includes several days where that full crew would otherwise be troubleshooting live integration issues, the direct labor savings alone commonly reach the tens of thousands of dollars range on a single project, before adding the value of the production output that starts flowing weeks earlier than it otherwise would have.
This is a simplified version of the calculation, but it illustrates the structure finance teams want to see: a specific crew size, a specific rate, a specific time saved, multiplied into a specific number, rather than a general claim that virtual commissioning "helps."
Build Your Own Numbers Instead Of Using Ours
iFactory works with your team to build a plant-specific ROI model using your actual crew costs, line complexity, and commissioning history, so the business case reflects your numbers, not an industry average.
Why Avoided Downtime Is Often The Larger Number, Even Though It's Harder To See
Commissioning savings are relatively easy to calculate because the timeline compression is directly observable, but downtime avoidance is frequently the larger financial contributor over a longer horizon, precisely because it's invisible when it works. An hour of unplanned downtime on a high-speed FMCG packaging line, once lost production value, labor cost during the stoppage, and potential product waste are factored in, commonly runs into the thousands of dollars, and a line with a history of even a few unplanned stoppages a month accumulates a downtime cost that dwarfs a one-time commissioning saving. Virtual line-change testing that catches a single spatial conflict or timing mismatch before it becomes a live incident is, in effect, avoiding one of these downtime events entirely, and building that avoided cost into the ROI model, even as a conservative estimate based on historical downtime frequency, usually strengthens the business case considerably.
The Inputs You Need To Build A Credible ROI Model For Your Plant
Your Blended Commissioning Crew Cost
Combine hourly rates across the mechanical, electrical, and controls staff typically on site during a startup or major line change.
Historical Downtime Frequency And Cost
Pull recent downtime records tied to commissioning or changeover events specifically, along with your standard cost-per-hour-of-downtime figure.
Current OEE And Idle-Time Baseline
Establish your current OEE score and idle-hour patterns as the baseline against which projected improvement gets measured.
Platform And Implementation Cost
Get a specific cost figure for the digital twin platform and implementation effort to compare directly against the projected savings above.
Typical Savings Ranges Reported Across FMCG Digital Twin Deployments
| Value Category | Typical Range | Primary Driver |
|---|---|---|
| Commissioning time saved | 4-6 weeks per major project | Errors caught virtually, not live |
| Downtime avoidance | Varies by incident frequency | Fewer live integration failures |
| OEE improvement | 2-5 percentage points | Idle reduction, faster changeovers |
| Typical payback period | Under 12 months | Combined effect of the above |
Questions Finance And Plant Leaders Ask About Digital Twin ROI
Get A Plant-Specific ROI Model Before You Present To Finance
iFactory builds your business case using your actual commissioning costs, downtime history, and OEE baseline, so the numbers you present are yours, not an industry benchmark.