A forecast that is wrong randomly is a manageable, ordinary planning challenge. A forecast that is wrong in the same direction, on the same SKUs, month after month, is a completely different problem — it is systematic bias, and it quietly compounds into overstocked warehouses on some products and chronic stockouts on others, all while the forecast error metric on a dashboard looks unremarkable. Catching that pattern requires watching a specific signal most demand planning teams never look at directly, which is exactly what iFactory's forecasting work is built to surface.
DEMAND FORECASTING
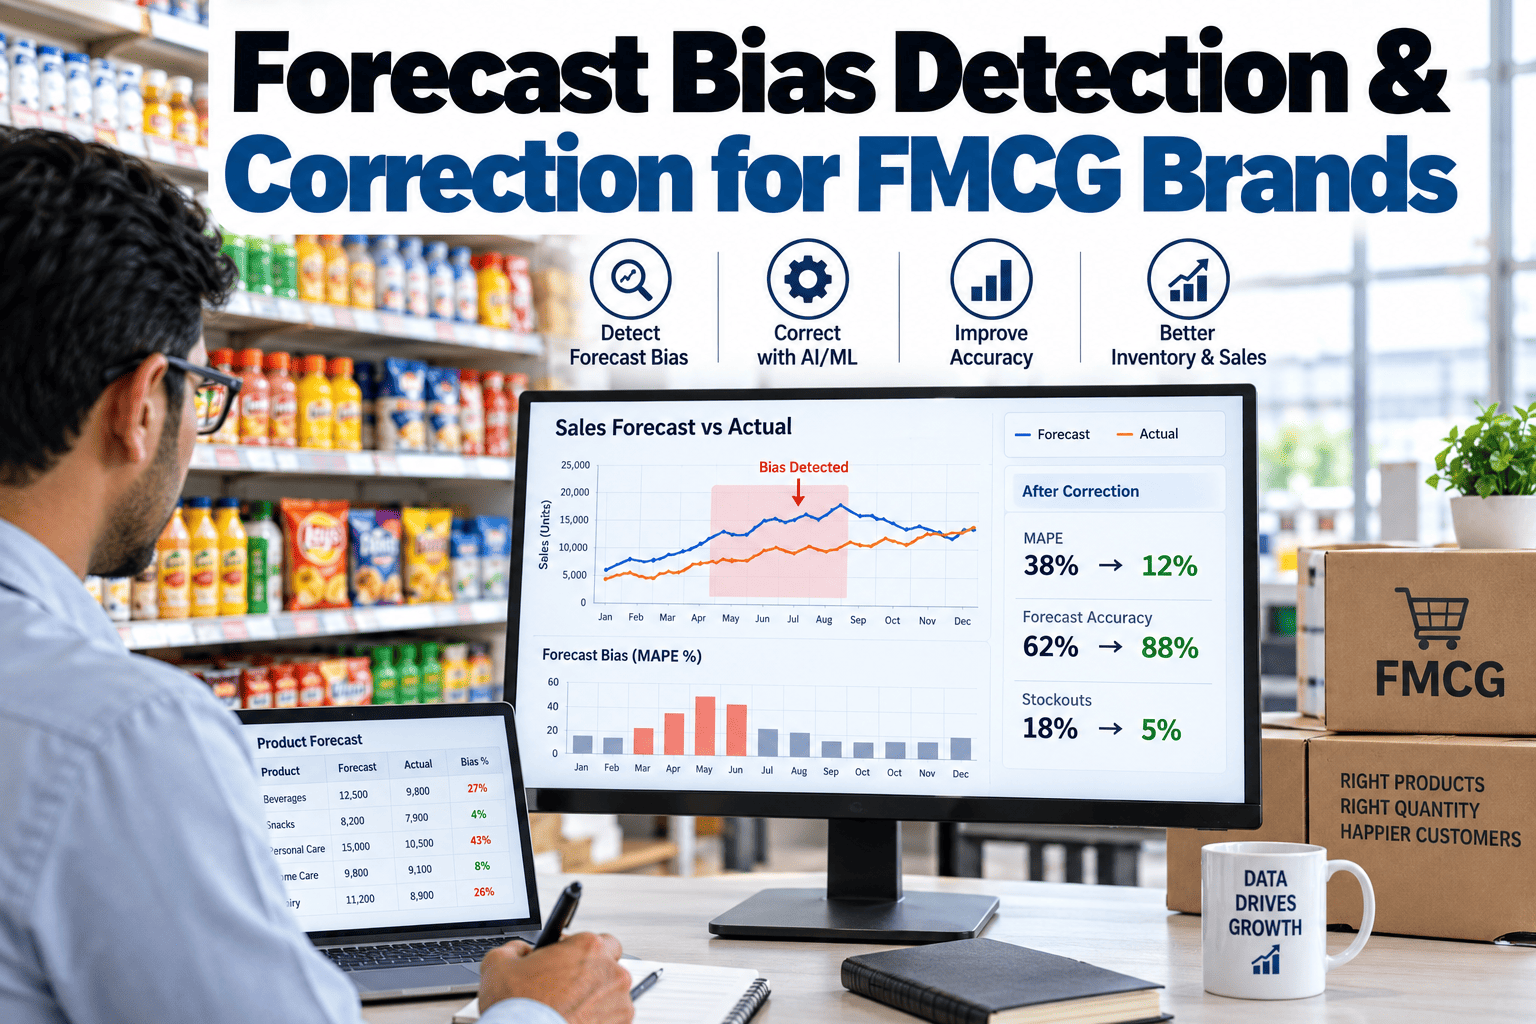
Forecast Bias Detection & Correction for FMCG Brands
Tracking signal, bias by SKU-location, and a correction cadence that stops systematic over- and under-forecasting before it becomes a chronic inventory imbalance.
Why Forecast Error Alone Hides the Real Problem
Most demand planning teams track forecast error — the average size of the miss, regardless of direction — as their primary accuracy metric. That metric can look perfectly acceptable even while a serious problem is developing, because it treats an equal number of over-forecasts and under-forecasts as offsetting each other into a healthy average. Bias is a different measurement entirely: it tracks the direction of the miss over time, and a forecast that is consistently biased in one direction on a specific SKU can carry an unremarkable error score while quietly driving that item toward chronic overstock or chronic stockout.
Tracking Signal — The Metric That Actually Catches Bias
Tracking signal is calculated as the running sum of forecast errors divided by the mean absolute deviation, and unlike a simple error percentage, it reveals when errors are consistently landing in the same direction rather than canceling each other out. A tracking signal drifting steadily away from zero, in either direction, is the earliest reliable warning that a systematic bias has developed on a given SKU or location.
HEALTHY RANGE
Tracking signal oscillating between roughly -4 and +4 indicates forecast errors are essentially random, not systematically biased in either direction.
WARNING ZONE
A tracking signal consistently beyond ±4 for several consecutive periods signals a developing bias that warrants investigation before it compounds further.
ACTION REQUIRED
A tracking signal beyond ±6, sustained over multiple periods, indicates a significant systematic bias that is very likely already affecting inventory levels.
The Four Common Bias Patterns in FMCG Forecasting
Bias does not show up uniformly across a portfolio — it tends to cluster around specific, recognizable patterns tied to how a forecasting model handles particular kinds of demand signals. Recognizing which pattern is active on a given SKU points directly toward the right correction.
Promotional Over-Forecast Bias
Models trained on historical promotional lift consistently overestimate future promotion volume as baseline demand shifts, leading to chronic overstock after promotional periods end.
New Product Under-Forecast Bias
Newly launched SKUs with limited sales history are systematically under-forecast because the model lacks enough data to project true demand, driving early stockouts.
Seasonal Transition Bias
Forecasts lag behind rapid seasonal demand shifts, consistently under-forecasting the ramp-up and over-forecasting the decline of seasonal products.
Mature SKU Decline Bias
Forecasts for aging SKUs anchored to historical averages consistently overestimate demand as a product enters a genuine, sustained decline phase.
Find the Bias Hiding in Your Own Forecast Accuracy Numbers
iFactory reviews your forecast history using tracking signal analysis by SKU-location to identify systematic bias your current accuracy metrics may be masking.
Bias Pattern to Correction Method
Each bias pattern responds to a different correction approach, and applying the wrong fix — such as a blanket forecast adjustment across the whole portfolio — often corrects some SKUs while making others worse. The table below maps each pattern to its typical correction method.
| Bias Pattern | Typical Correction Method | Review Cadence |
|---|
| Promotional over-forecast | Separate baseline and promotional lift modeling | Post-promotion review |
| New product under-forecast | Analogous-product reference modeling until sufficient history exists | Weekly during launch window |
| Seasonal transition bias | Shortened lookback window during transition periods | Bi-weekly during transition |
| Mature SKU decline bias | Trend-weighted forecasting favoring recent periods | Monthly |
The Correction Cadence — Making Bias Review a Habit, Not a One-Time Fix
A bias correction applied once and never revisited tends to drift back over time as demand patterns evolve. Building a recurring review cadence into the planning calendar is what keeps bias correction effective on an ongoing basis rather than becoming another one-time project.
WEEKLY
Tracking signal reviewed for new product launches and any SKU flagged in a previous cycle, catching emerging bias early in its development.
MONTHLY
Full portfolio tracking signal review across all SKU-location combinations, identifying any new patterns crossing the warning threshold.
QUARTERLY
Correction methods themselves are reassessed against recent performance, adjusting the approach for patterns that have evolved since the last review.
A Demand Planning Director on What Tracking Signal Revealed
"
Our overall forecast accuracy metric had been sitting in a range we considered acceptable for over a year, so bias was not something we were actively looking for — the dashboard simply didn't suggest a problem existed. When we ran a tracking signal analysis by SKU-location for the first time, it surfaced roughly fifteen percent of our SKUs with a tracking signal well outside the healthy range, almost all in one consistent direction. Digging into it, nearly all of them were newer products still being forecast using a model tuned for our mature portfolio, which consistently under-forecast them during their first six months on shelf. That is a completely different problem than "our forecast has some error," and it required a completely different fix — we needed a separate modeling approach for new launches, not a global accuracy improvement effort. Once we made that specific change, stockouts on new product launches dropped noticeably within the next two quarters, and our aggregate accuracy number barely moved, because it had never actually reflected the problem in the first place.
— Demand Planning Director, National FMCG Brand · Manages Forecasting Across 400+ SKUs
Frequently Asked Questions
How is tracking signal different from the forecast accuracy metrics we already track?
Standard forecast accuracy metrics like mean absolute percentage error measure the size of forecast misses without regard to direction, which means a series of over-forecasts and under-forecasts can average out to a seemingly healthy number even while a real, systematic bias exists on a specific SKU. Tracking signal specifically measures the cumulative direction of error over time, which is what makes it capable of surfacing a bias that a standard accuracy metric would miss entirely. The two metrics answer different questions and are most useful when tracked together rather than as substitutes for each other.
How much historical data is needed to calculate a reliable tracking signal?
A meaningful tracking signal calculation generally needs at least eight to twelve periods of forecast and actual sales history for a given SKU-location combination, since fewer data points make the signal too volatile to distinguish genuine bias from normal short-term variation. This is precisely why new product launches present a particular challenge — there is often not enough history yet to calculate a reliable tracking signal in the traditional sense, which is why the correction approach for new products typically relies on analogous-product modeling rather than tracking signal alone during the earliest launch weeks.
Should bias correction be applied uniformly across an entire product portfolio?
No — this is one of the more common mistakes teams make once they discover a bias problem, applying a single blanket adjustment across the whole portfolio rather than identifying which specific SKUs and bias patterns are actually driving the issue. A uniform correction risks fixing SKUs that were not actually biased while overcorrecting ones that were, since different bias patterns, as outlined above, respond to different correction methods. Targeted, SKU-level correction based on the specific pattern identified is consistently more effective than a portfolio-wide adjustment.
How long does it take to see improvement after correcting a bias pattern?
The timeline depends on the specific bias pattern and correction method applied — promotional bias corrections often show measurable improvement within the next one or two promotional cycles, while corrections to mature SKU decline bias may take a full quarter or more of trend data to confirm the fix is working as intended. New product forecasting corrections typically show their effect fastest, since the correction directly addresses the specific launch window where the bias was most acute, often within the first few weeks of applying an analogous-product reference model.
Can iFactory run a bias detection analysis on our existing forecast history?
Yes — this analysis can typically be run against your existing forecast and actual sales history without requiring a new forecasting system to be in place first, making it a useful first step for any FMCG brand wanting to understand whether systematic bias exists in their current process before committing to a larger forecasting overhaul. The analysis identifies specific SKU-location combinations with tracking signals outside the healthy range and maps them to the likely bias pattern driving the issue. To run a bias detection analysis on your own forecast data,
book a demo with our team.
Stop the Bias Your Accuracy Metric Isn't Catching
Forecast error alone hides systematic bias that quietly drives overstock and stockouts across your portfolio. iFactory's tracking signal analysis and correction cadence catch it early and fix it at the SKU level.