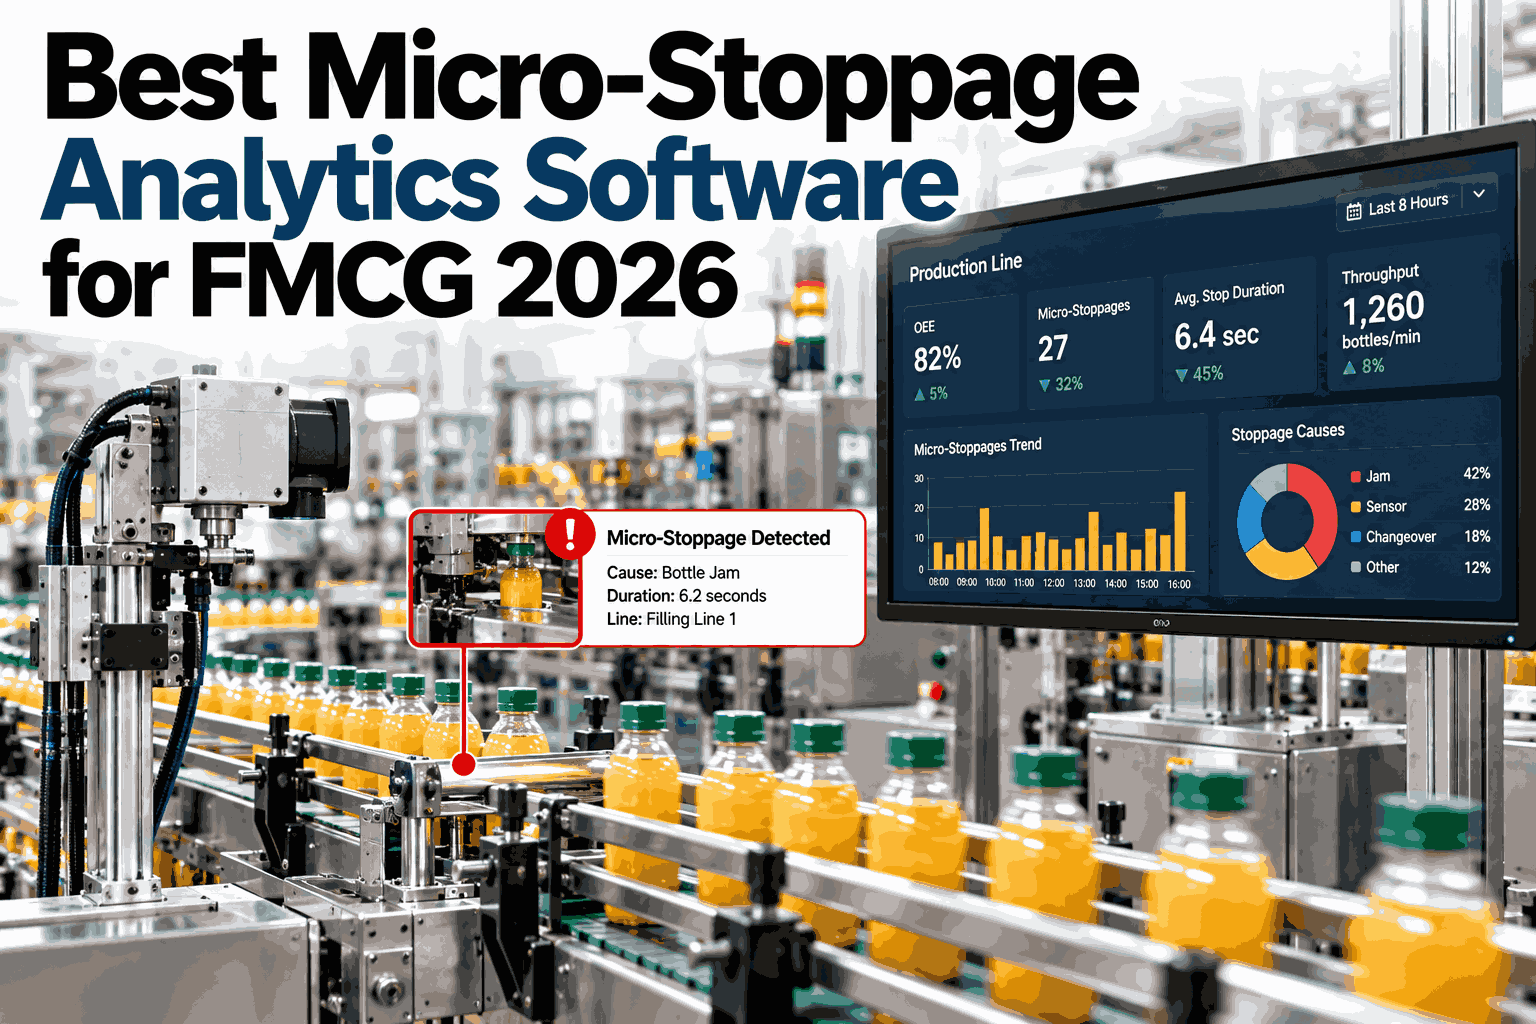
Ask a plant manager how their line performed last shift and the shift report will mention any major breakdown, any significant quality hold, anything big enough to write down. What it almost never mentions is the accumulation of five-second stops, the slight speed reduction nobody flagged, and the minor defects trimmed and reworked before they ever reached a formal quality hold. None of that shows up as a single event, and all of it compounds into lost capacity that never gets addressed because nobody can see it clearly. Plants ready to expose this gap can Book a Demo to see how iFactory surfaces losses the shift report was never built to capture.
Why the Shift Report Misses Most of the Real Loss
A shift report is built to capture events worth writing down by hand, which means it naturally favors the dramatic over the frequent. A two-hour breakdown gets logged in detail. Forty separate ten-second stops scattered across the same shift, adding up to roughly the same total lost time, get logged as nothing at all, because no single one of them felt significant enough to note, and manually tracking forty tiny events per shift simply isn't realistic for an operator focused on running the line. The loss is just as real either way — it's only the visibility that differs.
Four Layers of Loss Beneath the Visible Surface
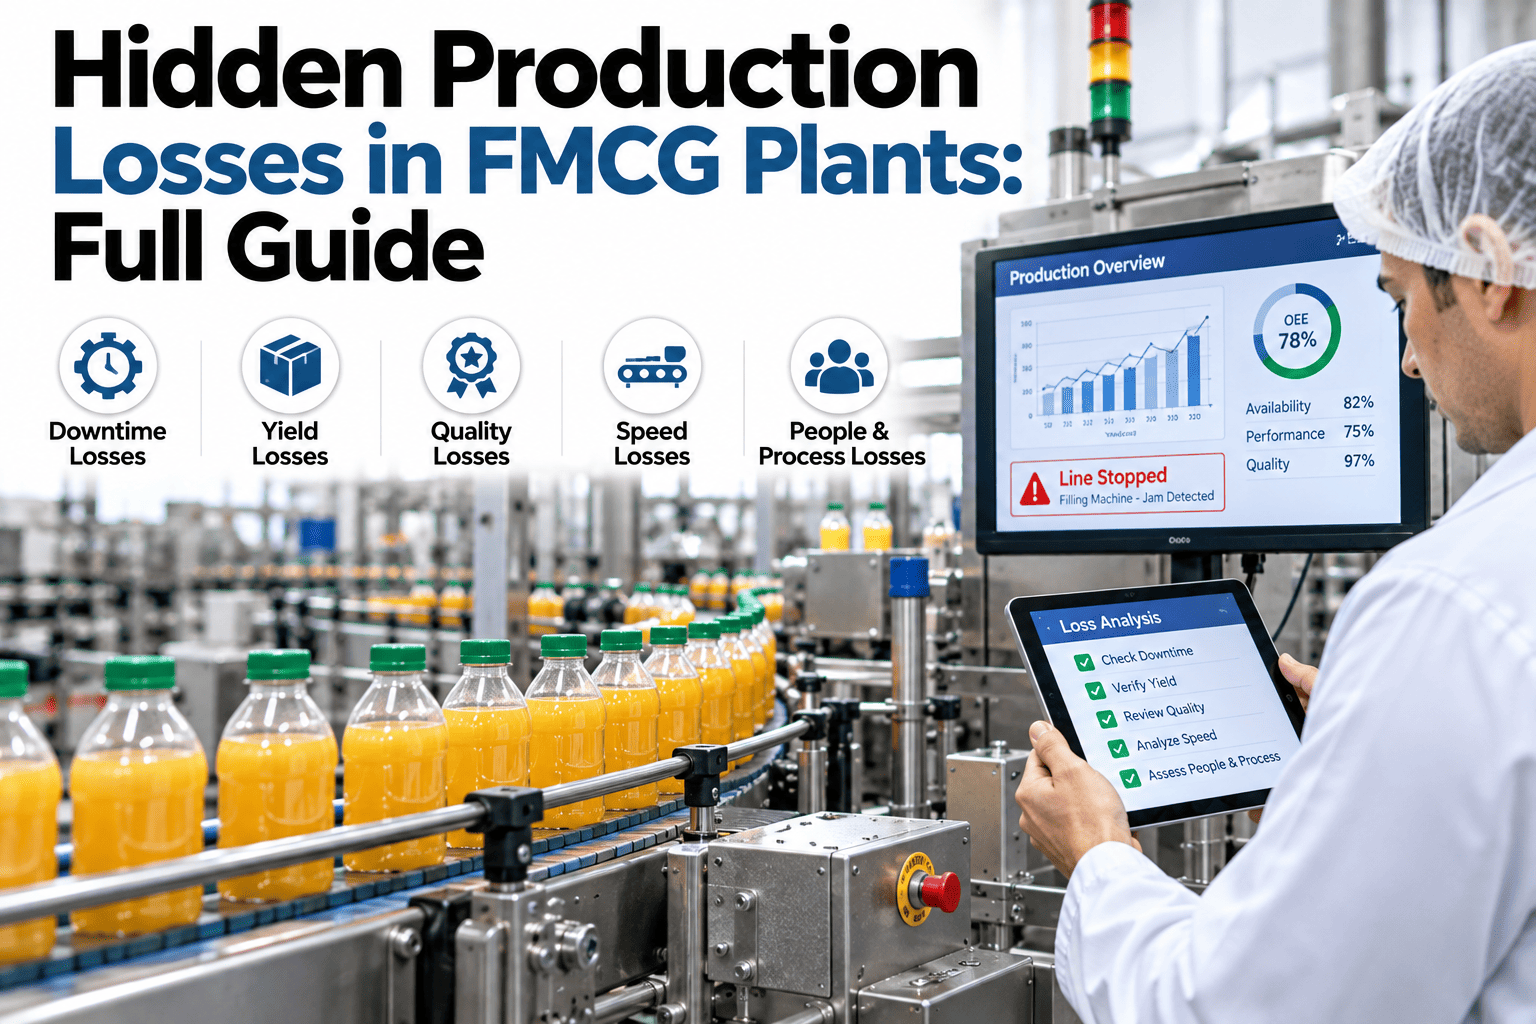
Hidden production loss in an FMCG plant isn't a single category — it stacks in layers, each one less visible than the one above it, and each one requiring a different kind of data capture to expose. Understanding these as distinct layers, rather than one vague bucket called "inefficiency," is what lets a plant actually target improvement effort at the layer contributing the most loss.
Why Hidden Losses Compound Instead of Staying Constant
A hidden loss that isn't measured doesn't just stay flat — it tends to get worse over time, because nothing is correcting it. A micro-stoppage pattern caused by a sensor drifting out of calibration will keep occurring, and likely worsen, until someone notices it, and without visibility into the pattern, nobody has a reason to investigate. The same applies to gradual changeover drift — a changeover that has quietly grown thirty seconds longer than it used to be will keep growing unless something flags the trend, since no single instance looks alarming enough on its own to prompt a review.
This compounding effect is part of why hidden losses often represent a larger total opportunity than the visible losses a plant already tracks and actively manages. The visible losses get attention precisely because they're visible, which means they tend to get addressed. The hidden ones persist and grow specifically because nobody is looking.
Visible vs. Hidden Loss: A Direct Comparison
Laying visible and hidden loss categories side by side clarifies why a plant's official downtime and quality metrics can look reasonably healthy while true realized capacity still lags well behind what the equipment is actually capable of producing.
| Characteristic | Visible Loss | Hidden Loss |
|---|---|---|
| Typical event size | Large, individually significant | Small, individually insignificant |
| Detection method | Manually logged by operators or supervisors | Requires automated, continuous data capture |
| Trend behavior | Tends to get addressed once flagged | Tends to persist and worsen unnoticed |
| Cumulative impact | Bounded by event frequency and severity | Can exceed visible loss in total volume over time |
Where to Start When Exposing Hidden Loss for the First Time
Attempting to instrument every possible hidden loss category across an entire plant simultaneously is rarely the fastest path to value. Starting with the single line or bottleneck asset where visible metrics already look reasonably good but actual throughput consistently underperforms expectations is usually the clearest sign that hidden loss is concentrated there, making it the highest-value starting point for deeper measurement.
Identify the Capacity Gap
Compare a line's theoretical rated output against its actual realized output over a representative period to quantify the size of the unexplained gap.
Instrument Micro-Stoppages First
Sub-minute stop capture typically reveals the single largest hidden loss category on most high-speed FMCG lines, making it a strong first investment.
Add Speed Loss Tracking
Once stoppages are visible, layer in speed loss detection to catch the output lost to running below rated speed without ever stopping.
Frequently Asked Questions: Hidden Production Losses in FMCG Plants
How much capacity do hidden losses typically represent compared to visible, logged losses?
The exact proportion varies significantly by line and plant, but it's common for the combined hidden loss categories — micro-stoppages, speed loss, minor defects, and drift — to represent a share of total lost capacity comparable to or exceeding the visible losses a plant already tracks, simply because hidden losses accumulate continuously while going largely unaddressed. Measuring a specific line's actual gap is the only reliable way to know the true proportion for that line. Teams can Book a Demo to quantify this gap for a specific line.
Can operators be trained to log micro-stoppages manually instead of adding automated capture?
Manual logging of high-frequency short events is rarely sustainable at scale, since an operator focused on running the line has neither the time nor the practical means to accurately record dozens of sub-minute events per shift without it becoming a significant distraction from the job itself, and any attempt tends to produce incomplete or inaccurate records that undermine the whole purpose of the exercise. Automated capture from existing line sensors or PLC data is almost always the more reliable path for this specific loss category.
How do we prioritize which hidden loss category to tackle first across a multi-line plant?
Prioritizing by the size of each line's capacity gap — the difference between theoretical and realized output — combined with the line's overall importance to total plant throughput gives a defensible starting point, since the goal is recovering the largest amount of usable capacity with the effort available rather than instrumenting every line and loss type simultaneously.
Do minor defects caught and reworked on the line really count as a meaningful loss if the product still ships correctly?
Yes — even when a minor defect is caught and corrected before it becomes a formal quality hold, the time, material, and labor consumed by that correction is a genuine loss that simply never gets recorded as one, and on high-speed FMCG lines this in-line rework can consume a surprising amount of otherwise productive capacity when it happens frequently enough across a shift.
Once hidden losses are made visible, how long does it typically take to see measurable capacity improvement?
Visibility alone doesn't recover capacity — it has to be paired with a structured improvement process that acts on the newly visible data, but plants that pair measurement with focused root-cause work on the largest hidden loss category typically see measurable gains within the first few months, since these categories are often driven by a small number of fixable root causes once they're finally visible enough to investigate. Contact iFactory Support for guidance on structuring the improvement process once losses are exposed.