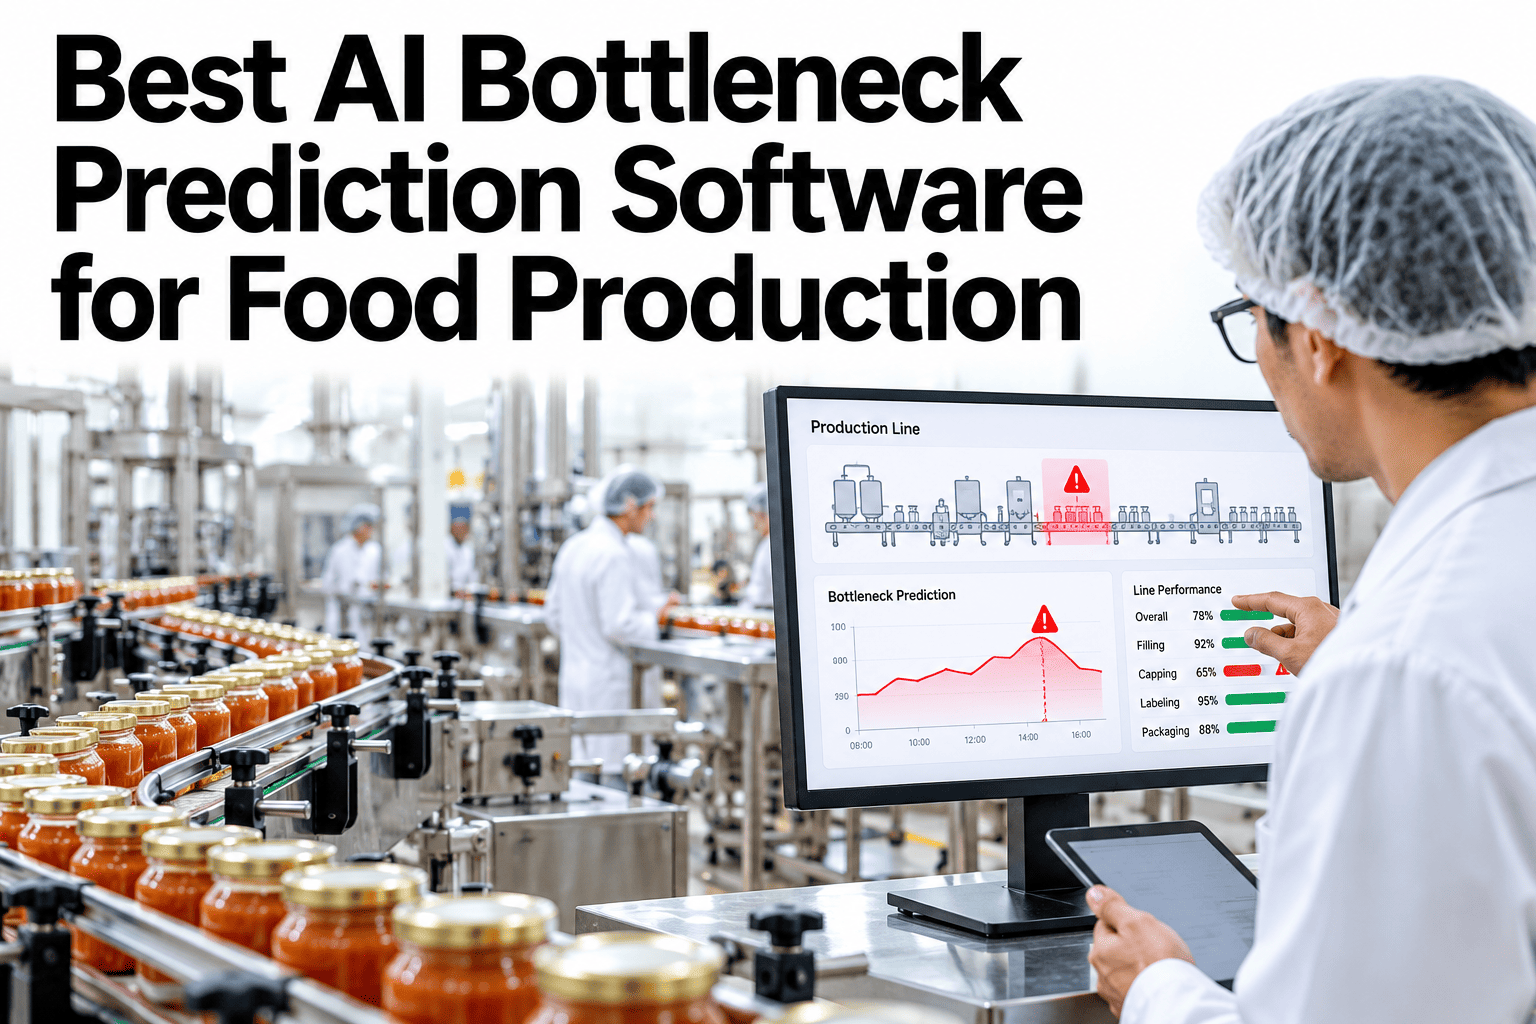
Most plants find out which machine is the constraint after it has already cost them a shift. The signs were there earlier: a filler running a touch slow, an upstream mixer feeding in bursts, a short-staffed packing crew on a high-volume SKU. AI bottleneck prediction reads those patterns before the shift starts and forecasts which machine is likely to constrain the line by SKU and staffing. Planners can see a bottleneck forecast for next shift built from their own line history and judge how often it would have been right.
Know Which Machine Will Constrain the Next Shift Before It Starts
iFactory AI reads upstream sensor patterns, SKU mix and staffing to forecast the next constraint, so planners can act before output drops.
From Signals to a Shift Forecast
The model reads recent line behavior and the plan for the shift, then names the machine most likely to limit output.
Conceptual flow. Real models use many more signals.
Signals That Often Foretell a Constraint
Models learn which patterns come before trouble on your line.
Upstream patterns
Rising cycle times, rate drift and small stops that precede starvation
Product mix
SKUs that load one machine harder than others
Staffing
Crew size and skill on stations that depend on people
Reactive Constraint Spotting vs Predicted Constraints
The value of prediction is time, because time is what lets a planner act.
How a Prediction Is Built and Checked
A forecast is only worth acting on if it has been tested against what actually happened.
Test the Forecast on Last Month of Your Line
Share a month of line data and shift plans. We will replay it and show how often the forecast named the real constraint.
What a Shift Forecast Tells Planners
The forecast is a decision aid, with a clear action attached to each case.
| Forecast Says | Meaning | Planner Action |
|---|---|---|
| Filler likely constraint | Filling rate will limit output | Protect filler uptime and feed |
| Packer likely constraint | Packing labor or speed will limit | Add crew or change SKU order |
| Mixer likely constraint | Batch supply will limit | Start batches earlier |
| No clear constraint | Line is balanced for this mix | Run as planned |
How Much to Trust Each Forecast
Every prediction carries a confidence level so planners know when to act.
Honest Limits of Prediction
No forecast is perfect. Use it with these limits in mind.
Needs history
A few months of line data are usually needed before forecasts are useful
New products are harder
Unfamiliar SKUs have little history to learn from
Equipment changes shift patterns
Retraining is needed after major changes
Not a replacement for judgment
Planners still decide what to do with the forecast
Data Sources and What Each Contributes
Prediction improves with variety, not just volume.
| Source | What It Adds | Typical Use in the Model |
|---|---|---|
| Machine states and rates | Recent behavior of each machine | Trend and drift signals |
| Production plan | SKUs and quantities for the shift | Load on each machine |
| Staffing roster | Crew size and skills on shift | Capacity of manual stations |
| Maintenance records | Recent repairs and condition | Reliability risk |
From Pilot to Daily Use
Trust grows in steps, and so should the use of the forecast.
Where Forecasts Help Most
Some decisions gain more from foresight than others.
Illustrative value by decision. Your own planners can rank the real ones.
Forecast Briefing vs Morning Scramble
The difference is when the problem is discovered.
Questions to Ask Any Prediction Vendor
Plain questions expose how solid a tool really is.
How was accuracy measured?
Ask for a replay on your own data, not a demonstration set
Can you explain a forecast?
You need the reason, not only the name of the machine
What happens when we change products?
Ask how the model is updated and how confidence changes
What Experienced Planners Look For in a Prediction Tool
Frequently Asked Questions
How much history does the model need?
Usually a few months of line data with known constraints, depending on how varied your products are. More history helps most when it includes both quiet weeks and difficult ones, because the model needs examples of different product mixes and conditions to learn from. Data quality matters as much as quantity, so check that stop reasons, SKU codes and staffing records are consistent before relying on the first forecasts. Check whether your history is enough to start with our team.
Can it predict constraints for a new SKU?
With less certainty. It can use similar products as a guide, and confidence is lower until the new SKU has run for a while. Planners can speed up learning by labeling a new SKU with a similar existing product, and confidence rises as real runs of the new SKU accumulate. Until history builds up, planners can treat forecasts for new SKUs as hints and keep closer watch on the line during early runs.
How is this different from OEE reporting?
OEE looks back at what happened. Prediction looks ahead at what is likely to limit the next shift. OEE tells you how much was lost, while prediction tells you where the next loss is likely to occur, and the two work well when reviewed together. Many teams review the forecast and the previous shift's OEE together at shift start, which links what happened with what may happen next. See both views side by side on one line in a short walkthrough.
What if the forecast is wrong?
It will be sometimes. Wrong forecasts are logged and used to improve the model, and low-confidence cases are marked so planners are not misled. Reviewing missed forecasts in a short weekly session often reveals missing inputs, such as a staffing change that was not recorded, and fixing the input improves the next forecast. Keep a simple log of forecast, actual constraint and the action taken, since it shows whether acting on the forecast helped and builds trust over time.
Who uses the forecast?
Planners at shift start, supervisors during the shift and managers for weekly planning. Starting with planners keeps the first rollout simple, and supervisors and managers can be added once the forecast has proved itself on a few weeks of shifts. Managers benefit from a weekly summary of forecast accuracy, which shows where the model is reliable and where it still needs improvement. Plan which roles should see it first on a call.
Start Each Shift Knowing Where the Line Will Strain
Bring a month of line data and your shift plans. We will replay it and show how prediction would have helped.