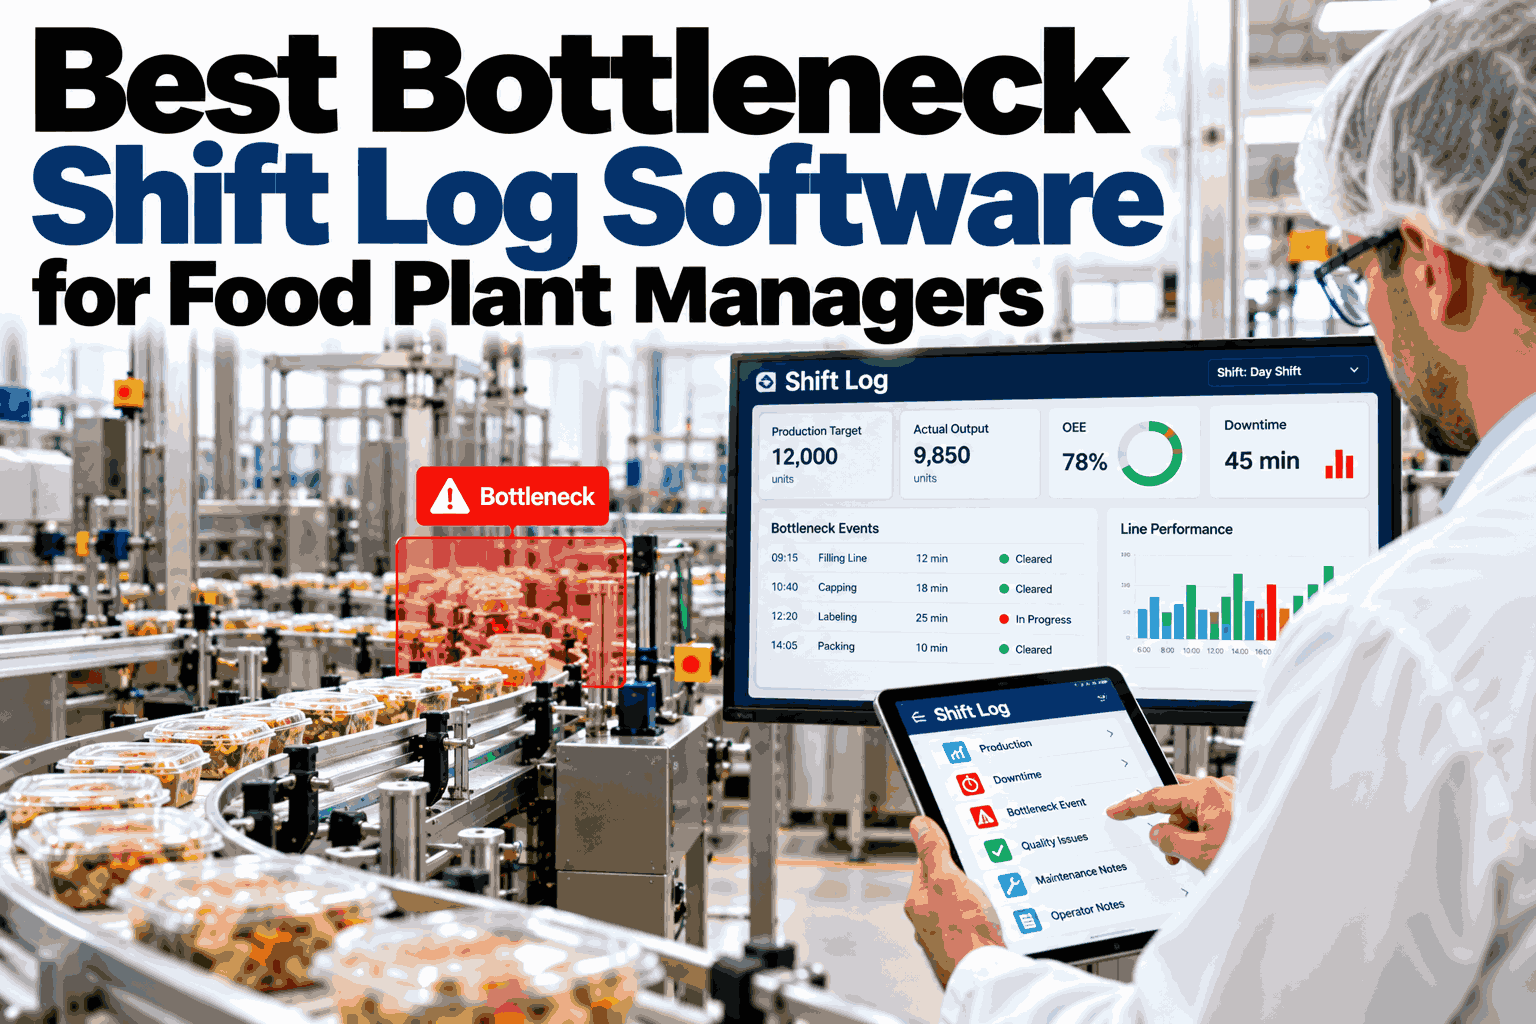
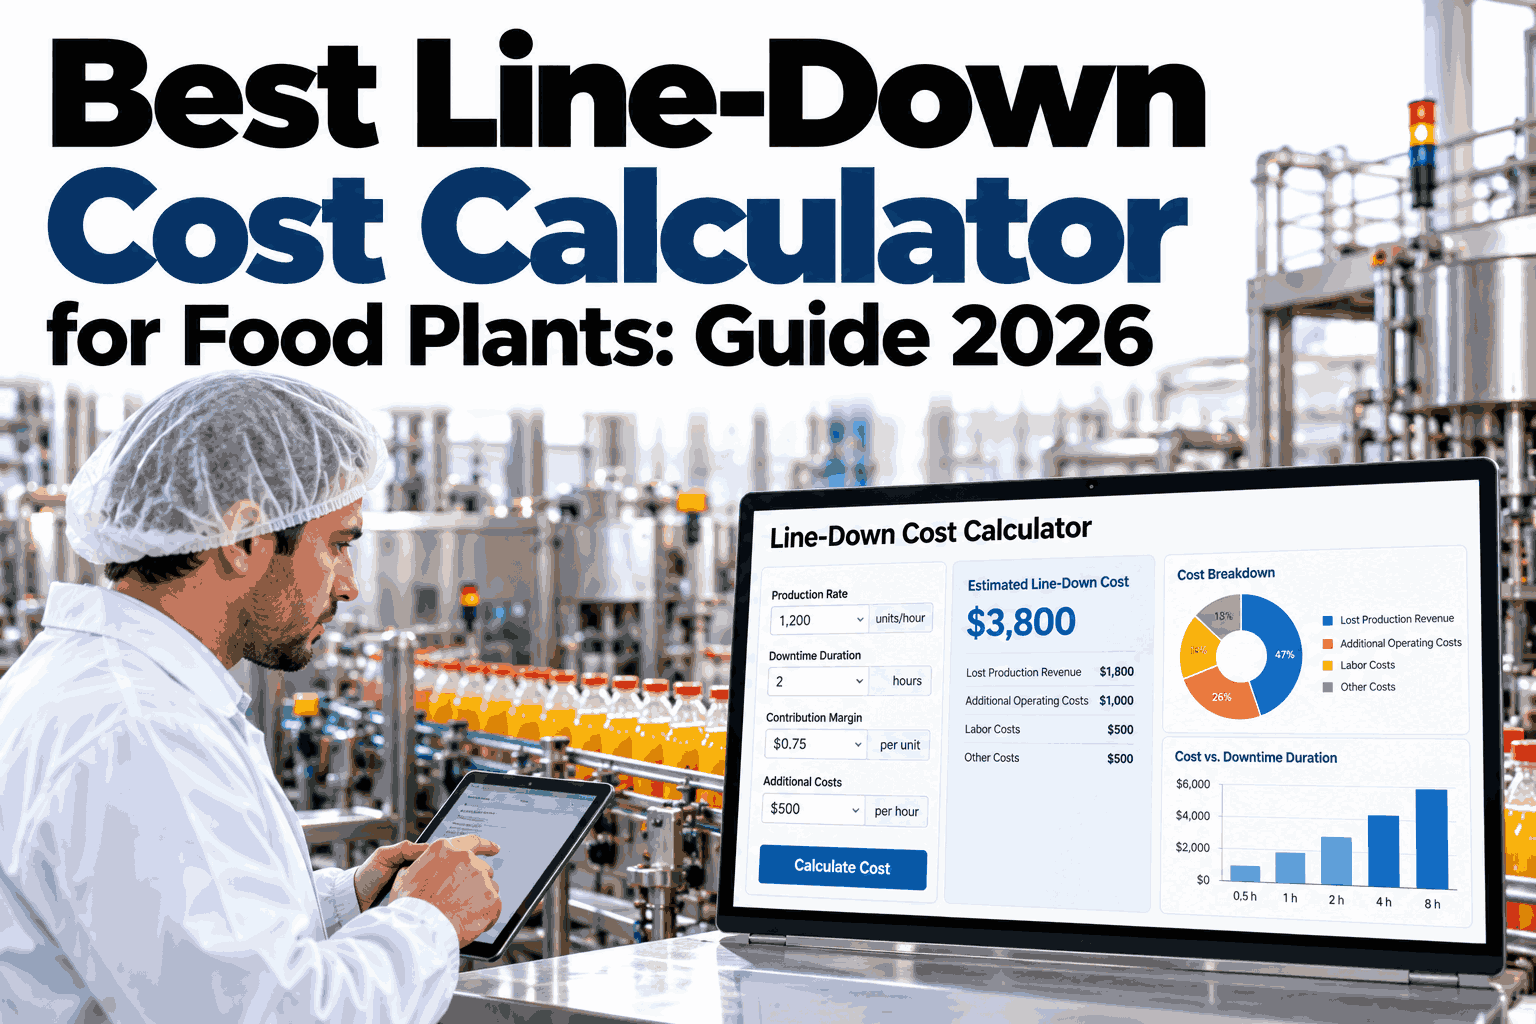
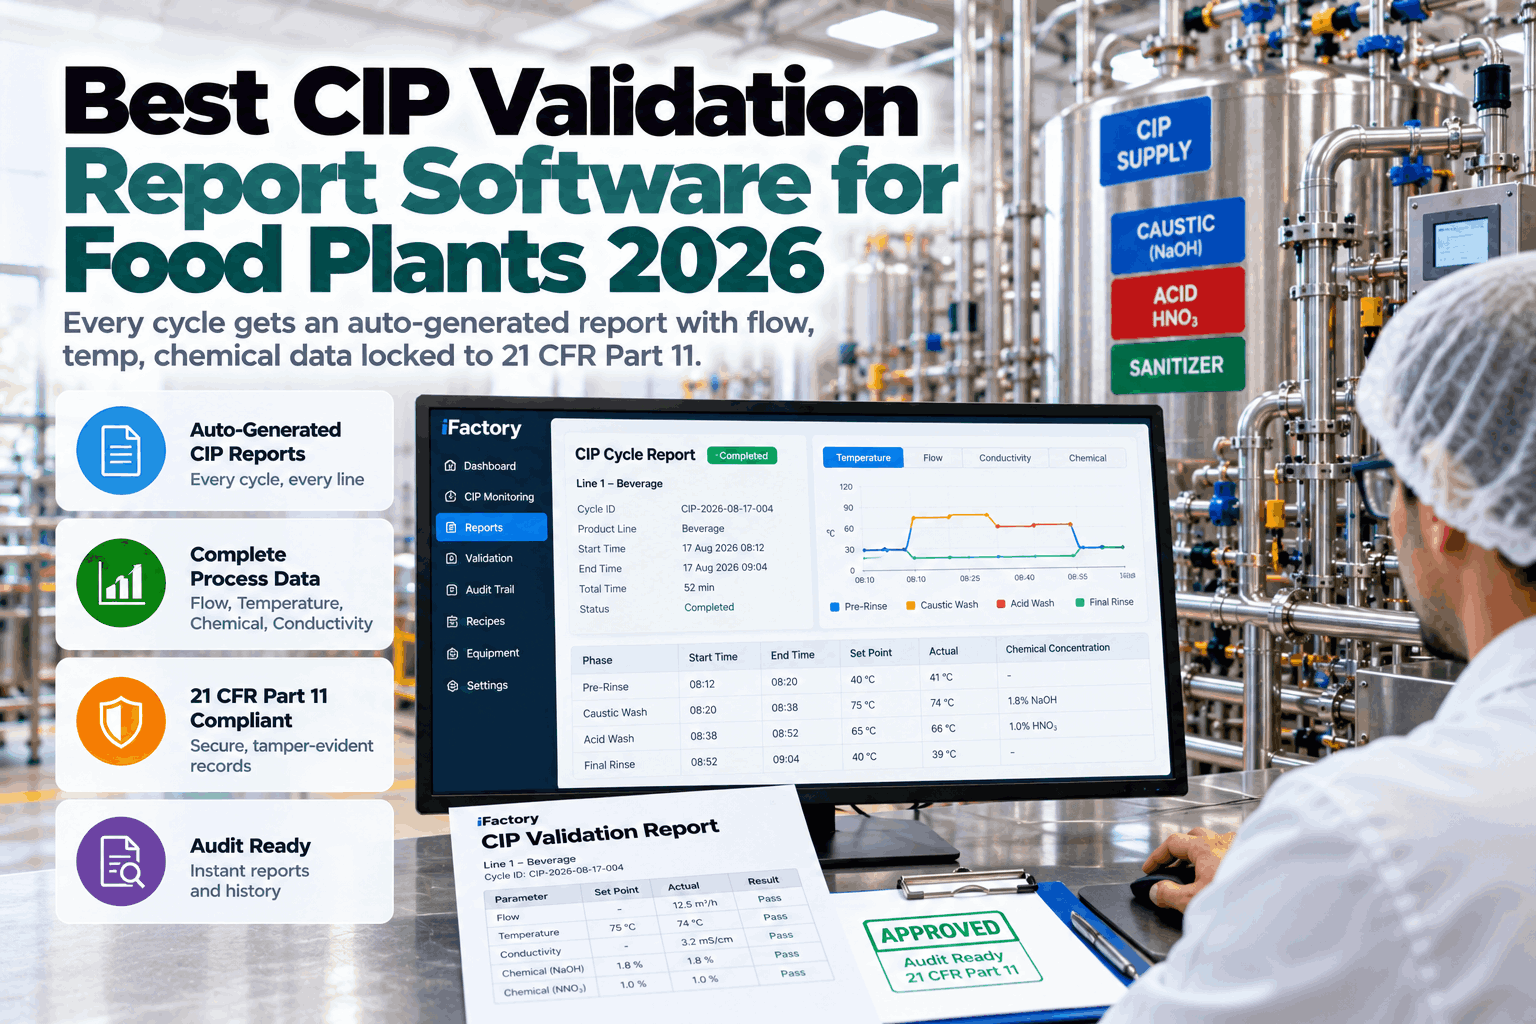
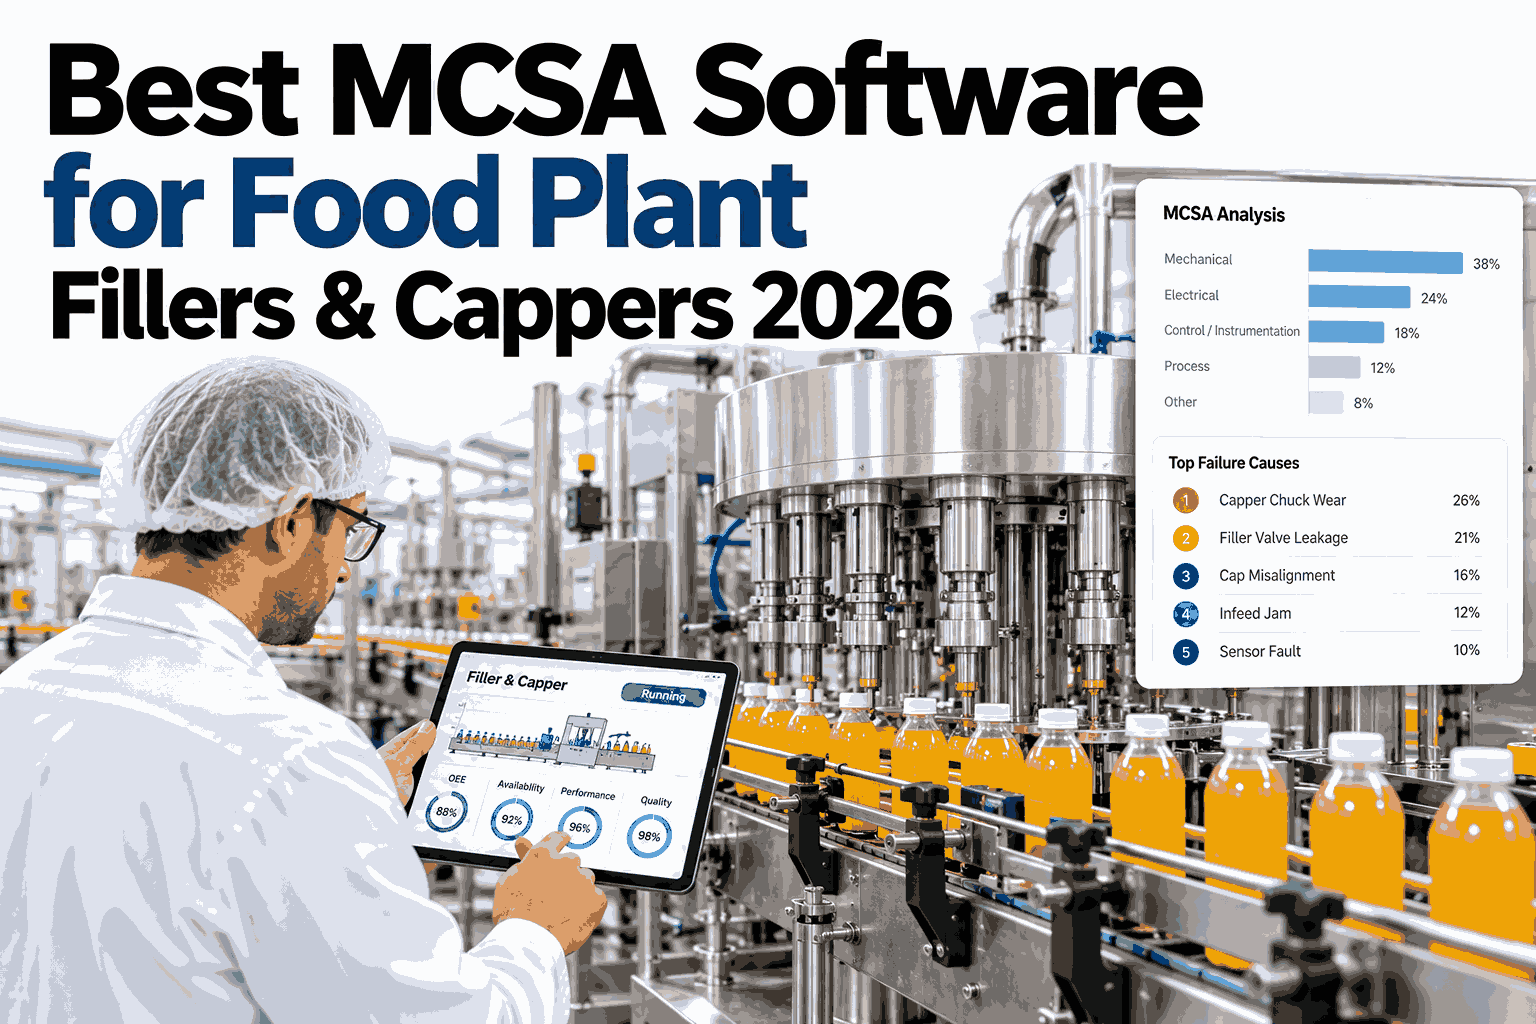
Food plant managers know that the primary line constraint rarely stays in one place for long, shifting from oven capacity to packaging speed to labor availability as SKUs and conditions change. Traditional shift logs capture static downtime events, but they completely miss the dynamic movement of the bottleneck that dictates true plant capacity. Logging the shifting constraint rather than just the stoppage reveals the hidden patterns dragging down weekly throughput, and you can set up dynamic constraint logging with our team to track these shifts automatically.
2026 Shift Log Guide
Best Bottleneck Shift Log Software for Food Plant Managers
How capturing the true shifting constraint every shift reveals the hidden capacity patterns that static downtime logs completely miss.
3xBottleneck Shifts per Run
85%Static Logs Miss Root Cause
22%Recoverable Capacity Gap
The static log problem
Why Traditional Shift Logs Miss Moving Constraints
Standard shift logs treat downtime as isolated events. They fail to connect the dots when the constraint migrates from one process step to another within the same shift.
01
Isolated Event Capture
Writing down that a wrapper was down for twelve minutes tells you nothing about the oven speed reduction that caused the upstream starvation in the first place.
02
No Context Tagging
Paper logs lack the data tags for SKU, ambient humidity, or specific crew shifts, making it impossible to find the correlation between operating conditions and constraint movement.
03
Subjective Reporting
Operators log what they see at their station. If the bottleneck shifts downstream, the upstream operator reports high efficiency while the line overall is constrained, hiding the truth.
Why bottlenecks shift
The Variables That Move Your Constraint Daily
Bottlenecks are not fixed points in a food plant. They migrate based on a handful of operational variables that change from run to run.
SKU Product Density
Running a high-density product pushes thermal capacity to the limit, making the oven the bottleneck. Switching to a low-density product shifts the constraint downstream to the packaging line, which now receives product faster than it can seal.
Ambient Conditions
Hot summer days reduce cooling tunnel efficiency, shifting the constraint from the filler to the cooler. Winter chill increases oven heat loss, moving the constraint back to the baking step. Logs must capture these weather correlations.
Crew Experience Mix
A senior crew on the manual pack station keeps pace with automation, but a junior crew creates a labor constraint. The bottleneck shifts based entirely on who is standing at the outfeed table during that shift.
Equipment Wear State
As a knife dulls or a bearing wears, that specific machine slowly becomes the constraint. Without trended shift logs, managers never see the gradual migration of the bottleneck until the machine fully fails.
Stop Logging Downtime and Start Logging the Constraint
Deploy dynamic bottleneck shift logs on your lines and give management the true capacity visibility they need to plan around moving constraints.
The moving constraint
Visualizing a Shifting Bottleneck Over a Single Shift
A true shift log maps the active constraint as it migrates across process steps. Below is a typical pattern showing how the bottleneck moves throughout a single production run.
06:00 to 09:00
Mixer Starvation
Ingredient delivery delays constrain the mixer. The rest of the line runs starved, but the log must capture the mixer as the active bottleneck.
09:00 to 13:00
Oven Capacity Limit
Ingredients arrive, but the oven cannot bake fast enough to feed the wrapper. The bottleneck shifts downstream. Packaging runs starved while the oven dictates pace.
13:00 to 15:00
Wrapper Jam Constraint
Product cools enough to package, but a film changeover creates wrapper jams. The bottleneck jumps to end-of-line packaging while the oven and cooler buffer up.
If your shift log only records wrapper jams at two in the afternoon, you miss the mixer and oven constraints that dominated the rest of the day. Map your daily constraint shifts with iFactory AI.
Software features
Must-Have Features for Bottleneck Shift Logging
The best constraint logging software does not rely on operator text entries. It uses automated system data to diagnose and timestamp the moving bottleneck.
| Software Feature |
Traditional Log Capability |
Dynamic Shift Log Capability |
| Constraint Identification |
Operator types reason code manually |
Auto-detects slowest step via machine speeds |
| Context Tagging |
Limited to line name and shift |
Tags SKU, crew, humidity, and batch |
| Migration Tracking |
Logs only static downtime events |
Timestamps the exact moment constraint shifts |
| Historical Pattern Mining |
Manual spreadsheet pivot tables |
Auto-highlights recurring seasonal constraints |
| Operator Input |
Writes entire log entry |
Only confirms auto-detected constraint |
Automated constraint detection removes the reporting burden from operators while ensuring the data is accurate enough to reveal long-term capacity trends. Review the automated detection logic on our support portal.
The iFactory advantage
How iFactory AI Tracks the Moving Constraint
iFactory AI continuously calculates the theoretical maximum speed of every step in your process and timestamps the step that is furthest from its potential, logging the true bottleneck without operator intervention.
Detection Method
Automated
Compares actual station throughput against theoretical maximums to find the active constraint every minute.
Context Richness
5 Data Tags
Automatically appends SKU, crew, ambient conditions, and machine wear state to every bottleneck timestamp.
Migration Alerts
Real-Time
Alerts supervisors the moment the constraint shifts to a new process step, enabling immediate resource rebalancing.
Trend Analytics
Seasonal
Rolls up shift constraint data to show how bottlenecks migrate by season, helping plan capital expenditures effectively.
Frequently asked questions
Bottleneck Shift Log Questions
Does the system require operators to enter bottleneck data?
No. iFactory AI automatically detects the constraint by analyzing machine speeds and buffer levels. Operators only occasionally confirm the auto-detected constraint if manual intervention is required, drastically reducing reporting burden.
See the automated detection logic in a live demo.
How does the software handle multiple simultaneous constraints?
If multiple lines are running, the system tracks the primary constraint per line. If a single line splits into parallel paths, it identifies the slowest parallel branch as the dominant bottleneck for that product flow.
Ask support about parallel line tracking for your plant layout.
Can we correlate bottleneck shifts with specific SKUs?
Yes, every logged constraint event is automatically tagged with the exact SKU running at the time. Managers can filter historical bottleneck data by SKU to see which products consistently shift the constraint to the oven versus the packaging station.
Discuss SKU constraint profiling with our specialists.
What integration is needed to enable context tagging?
The system pulls SKU data from your ERP or MES order schedule, crew data from your time and attendance system, and weather data from local APIs. iFactory AI handles the integration:
Check our integration list for your current systems.
How long before we see seasonal bottleneck patterns?
You can begin identifying constraint trends within four to six weeks of continuous logging. However, true seasonal pattern recognition requires running the dynamic log through a full year of SKU and ambient condition changes.
Plan a data collection timeline with our team.
Log the constraint, not the downtime
Deploy Dynamic Bottleneck Shift Logging in Your Plant
Book a session with iFactory AI to map your line steps, define constraint detection logic, and give management the true capacity visibility they need to outsmart shifting bottlenecks.