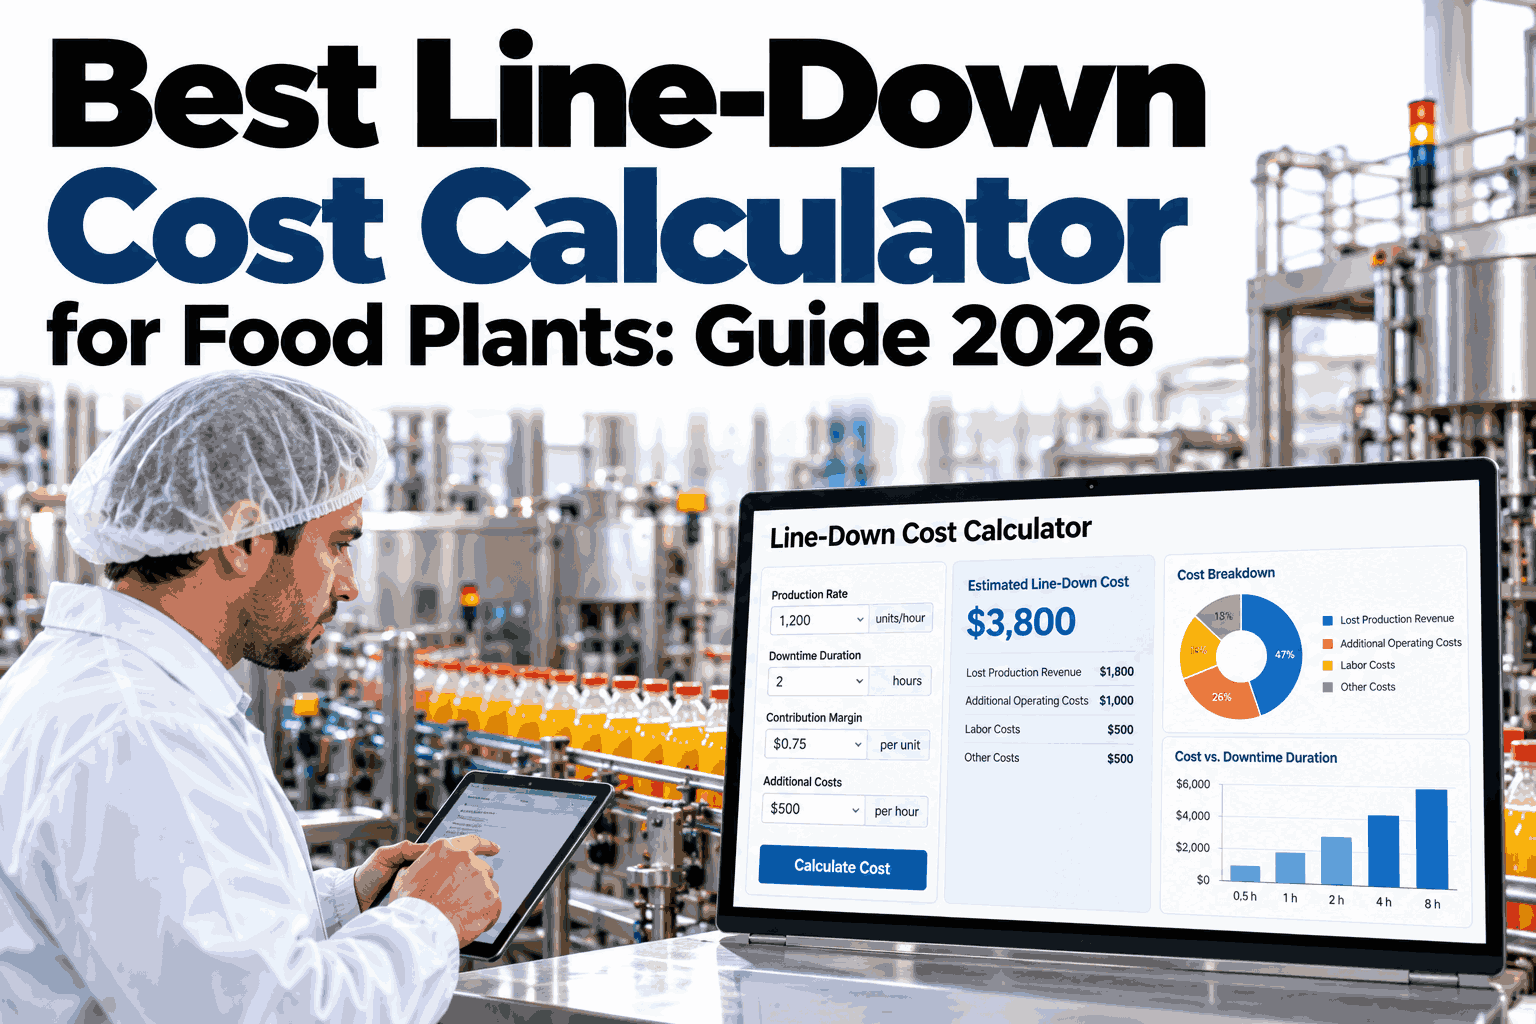
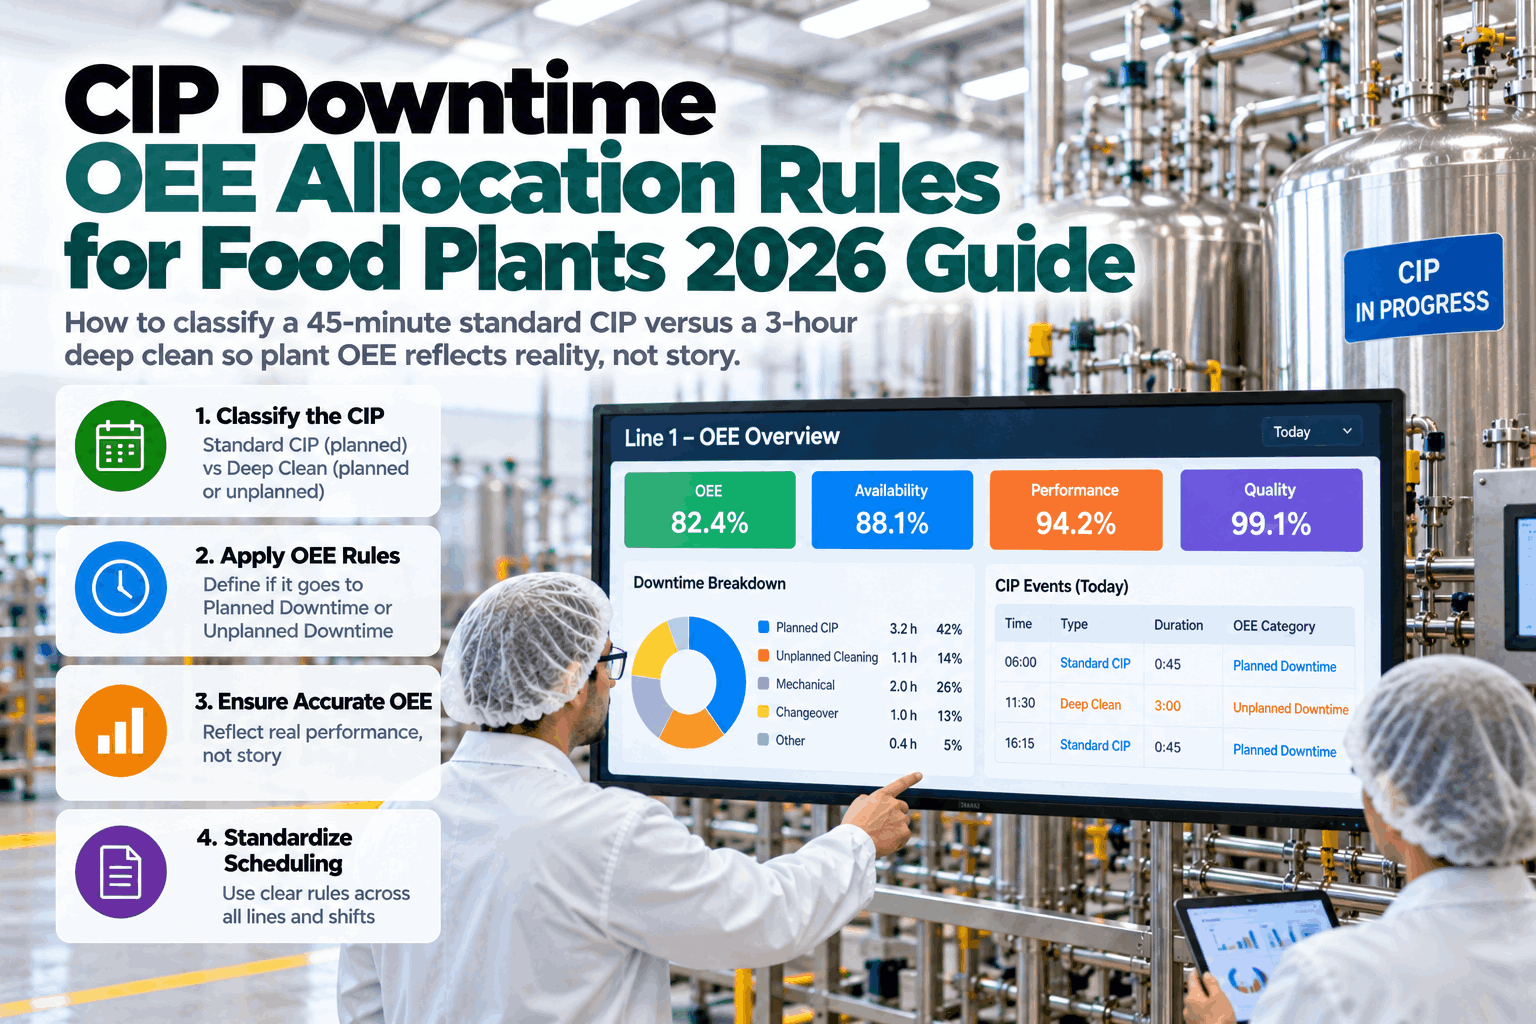
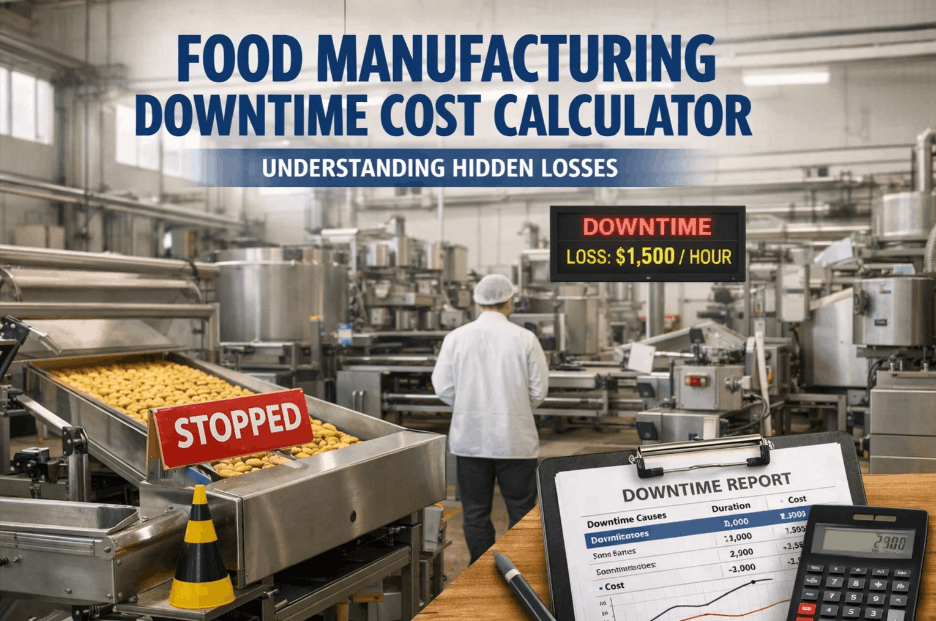
Ask a plant manager what an hour of downtime costs and most will quote a labor rate times headcount, nothing more. That number is real, but it is usually a small slice of the true figure once wasted ingredient, lost margin on unmade product, energy burned at idle, a repeated CIP cycle and a pushed delivery schedule are added back in. A proper line-down cost calculator puts all six pieces in one place instead of one, and teams building their first version often compare their draft formula against a working model before rolling it out plant-wide.
Downtime cost modeling for food plants
Your Line-Down Cost Is Probably Twice What You Think It Is
iFactory AI tracks stoppage time against real production, material and labor data, so the dollar figure attached to every downtime event reflects what it actually cost, not a rough estimate.
6
cost components belong in a defensible downtime number, most plants track only two of them
True cost of one stopped hour, example dairy line
Margin
Material
Labor
Energy
CIP
Sched.
Illustrative total: roughly $1,240 per hour stopped
The six pieces
What a Defensible Downtime Number Actually Includes
Most downtime estimates stop at labor because it is the easiest number to pull. A figure that will survive a budget review needs all six categories below, even if some are small for a given stoppage.
1
Lost margin
Product that would have been made and sold in that window, at contribution margin, not revenue.
2
Wasted material
Ingredient already in process that spoils, is dumped, or falls out of spec mid-run.
3
Labor
Crew paid to stand by, plus any overtime needed later to recover the lost run.
4
Energy
Utilities, refrigeration and steam still running while the line itself sits idle.
5
CIP re-runs
An extra clean-in-place cycle triggered by a stoppage mid-batch, with its own water, chemical and time cost.
6
Schedule push
The ripple into the next shift, the next SKU changeover and any expedited freight that follows.
Leaving any of these out does not make the cost disappear, it only moves the number further from what finance will eventually have to explain.
The formula
A Simple Equation You Can Build in a Spreadsheet Today
None of the six components need complex modeling. Each one is a rate multiplied by the stoppage duration, then summed into a single hourly figure for the line.
Line-down cost per hour = lost margin + wasted material + labor + energy + CIP re-run cost + schedule impact cost
Lost marginUnits per hour x contribution margin per unit
Wasted materialIngredient value at the point of stoppage, not purchase price alone
LaborIdle crew wage cost plus any overtime used to recover output
EnergyUtility draw during idle minus any load genuinely shut down
CIP re-runWater, chemical and labor cost of an unplanned extra wash cycle
Schedule impactEstimated cost of the next changeover, shift or shipment being delayed
Once each rate is known for a line, the calculator becomes a multiplication exercise every time a stoppage is logged, rather than a fresh estimate each time.
Build This Calculator Against Your Own Line Data
Bring your contribution margin, material cost and shift labor rate, and see the full six-part figure for a recent stoppage on your plant.
Worked example
A 45 Minute Stoppage, Priced Out Piece by Piece
Here is how the six components stack up for a mid-size dairy bottling line that stopped for 45 minutes during a seal failure, with the running total shown at each step.
Lost margin
$480
Running total: $480
+ Wasted material
$210
Running total: $690
+ Labor
$95
Running total: $785
+ Energy at idle
$40
Running total: $825
+ CIP re-run
$160
Running total: $985
+ Schedule push
$150
Final cost: $1,135
A labor-only estimate of this same event would have landed near $95, less than a tenth of the full figure once the other five categories are counted.
Why one number is not enough
The Same Stoppage Does Not Always Cost the Same Amount
A ten minute stoppage during a night shift changeover and the same ten minutes mid-batch on a high-margin SKU can produce very different totals, which is why a single flat downtime rate misleads more often than it helps.
Mid-batch, peak SKU
Material at riskHigh
Margin lost per hourHigh
CIP re-run likelihoodHigh
Shift changeover window
Material at riskLow
Margin lost per hourLow
CIP re-run likelihoodLow
A usable calculator carries a rate for each line and shift pattern, not one average figure applied to every stoppage regardless of timing.
Common pitfalls
Four Mistakes That Quietly Undercount the Real Cost
Most downtime figures are wrong in the same few predictable ways. Checking a calculator against this list before trusting its output catches most of the gap.
Mistake: using purchase price for wasted material
Fix: value it at the point of loss, including processing already done
Mistake: counting only the stopped minutes
Fix: add ramp-down and ramp-up time either side of the stoppage
Mistake: ignoring CIP re-runs entirely
Fix: log every unplanned wash cycle against the stoppage that caused it
Mistake: treating every hour as equal cost
Fix: apply a different rate for peak production versus changeover windows
Check Your Current Calculator Against These Four Gaps
Share how your plant currently estimates downtime cost and see which of the common gaps above are quietly shrinking your number.
Keeping score
A Monthly Tracker Worth Keeping Next to the Line
A calculator only earns its keep if someone logs against it consistently. A short monthly tracker, filled in after every stoppage, is usually enough to start spotting patterns.
Stoppage date, duration and the line affected
Which of the six cost categories applied that time
Whether the stoppage happened mid-batch or during a changeover
Total cost logged against the stated rate per category
Getting it running
Three Steps to a Plant-Wide Downtime Cost View
A spreadsheet calculator is a fine starting point, but most plants eventually want the number attached automatically to every stoppage the moment it happens.
Step 1
Set your rates
Agree the six category rates per line with finance and production together.
Step 2
Log consistently
Capture every stoppage, however short, using the same tracker fields.
Step 3
Automate the math
Connect stoppage data to production and cost systems so totals calculate themselves.
Frequently asked questions
Questions Plant Teams Ask About Downtime Cost Calculators
Is contribution margin the right number to use, or should we use revenue?
Contribution margin is the more defensible choice, since revenue overstates the loss by including costs that were never actually incurred during the stoppage. Finance teams generally prefer the margin figure for this reason.
Confirm the right rate for your product mix with our team.
How do we value wasted material that is only partly processed?
Value it at the cost already invested, including ingredient, labor and energy spent up to the point of loss, not the raw ingredient price alone. This is one of the most commonly underestimated categories.
Ask support for help setting this rate correctly.
Does every stoppage trigger a CIP re-run?
No, it depends on the product, the stage of the batch and your own hygiene protocol, so this cost should be logged per event rather than assumed every time. Mid-batch stoppages on dairy and beverage lines trigger it most often.
Walk through your protocol with our specialists.
Can this calculator work across multiple plants with different products?
Yes, as long as each line carries its own set of rates, since margin, material cost and CIP frequency vary by product and by site. A shared formula with site-specific rates keeps comparisons fair.
Discuss a multi-site setup with our team.
How often should we update the category rates?
A quarterly review is usually enough unless ingredient prices or labor rates move sharply, in which case the affected category should be updated as soon as the change is confirmed. Stale rates quietly understate the true cost over time.
Set a review cadence that fits your plant.
Stop underpricing every stopped minute
Get the Full Six-Part Cost of Your Last Downtime Event
Book a session with iFactory AI and see what a real stoppage on your line cost once margin, material, labor, energy, CIP and schedule impact are all counted.