When a critical machine dies mid shift, the repair invoice is the smallest part of what the plant actually pays. Rush parts, overnight freight, overtime crews, a lost batch, spoiled product, and the sanitation work to restart all land in different budgets, so the true cost of an emergency never appears as one number anyone can defend. That gap is why predictive maintenance proposals get stuck: nobody can show what a reactive repair really costs. This guide gives you a simple cost model that combines every piece into one fully loaded figure for your own plant. When you want to run it against real work order history, you can build the model together with a reliability specialist.
ARTICLE · EMERGENCY REPAIR COST MODEL · FOOD PLANTS
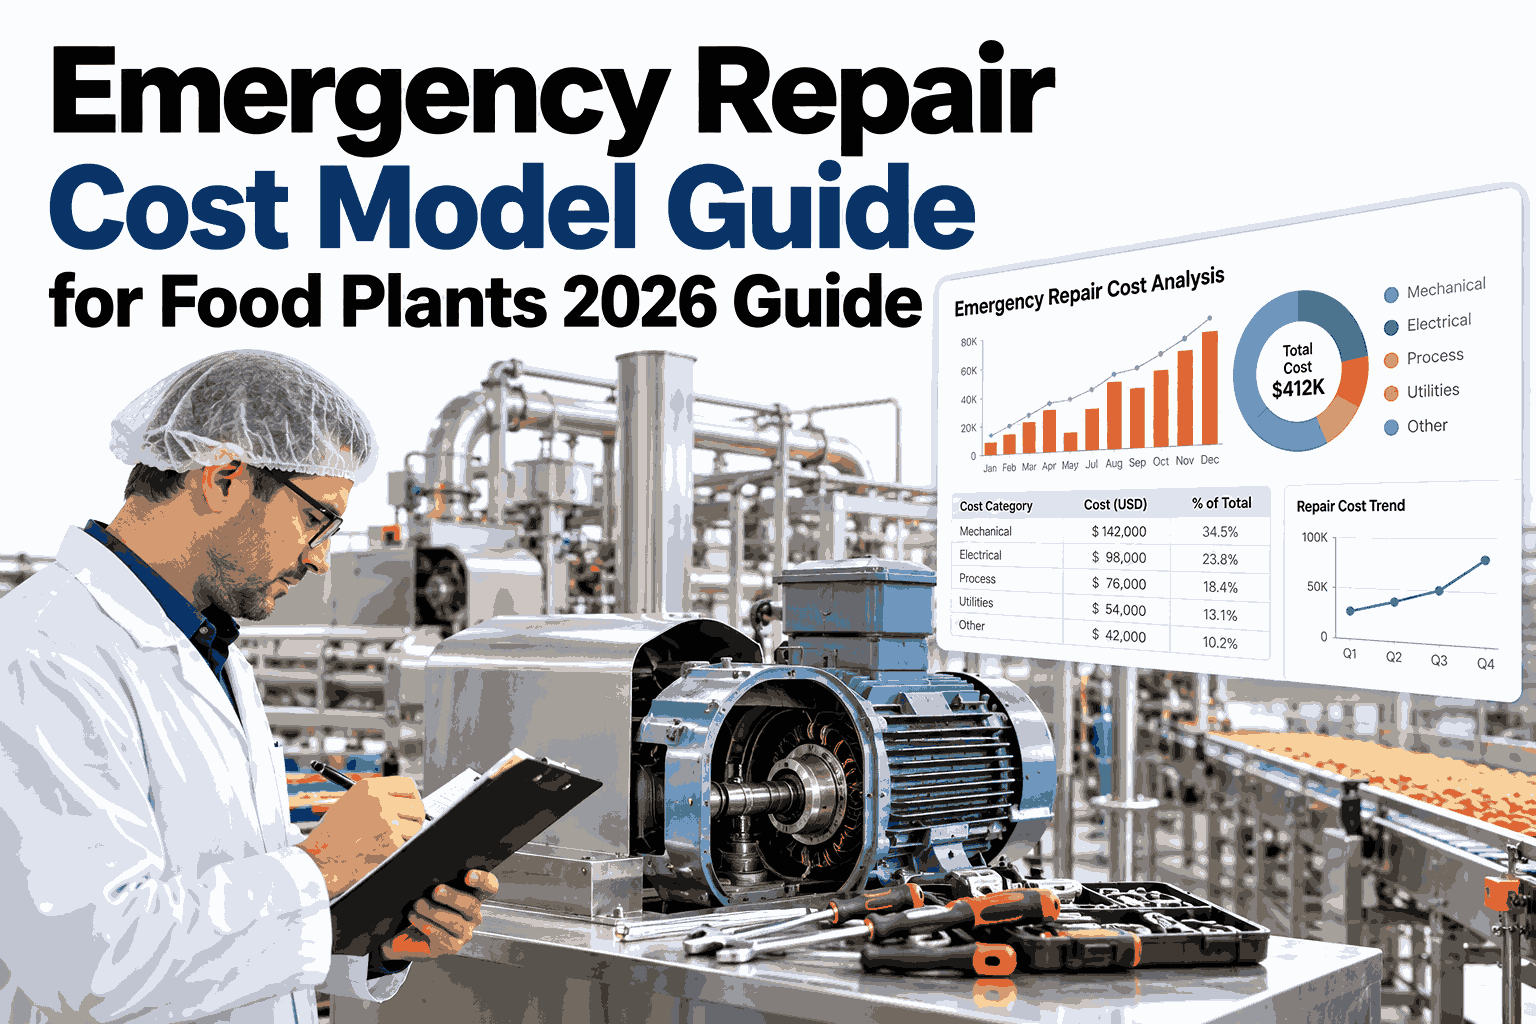
Emergency Repair Cost Model Guide for Food Plants in 2026
Combine parts markup, freight, overtime, batch loss, and spoilage into a single defensible number for your next budget conversation.
THE HIDDEN COST ICEBERG
What the Repair Invoice Leaves Out
Visible: parts and repair labor
Rush freight and expedited parts
Overtime and contractor call out
Lost batch and spoiled product
Sanitation, restart, and missed orders
THE MODEL
One Formula for the Fully Loaded Cost
Add every component, then compare the total with the planned version of the same repair.
Parts and markup
+
Freight
+
Overtime labor
+
Contractors
+
Batch loss
+
Spoilage
+
Downtime
=
Fully loaded cost
PLANNED VS EMERGENCY
The Same Repair, Two Very Different Bills
Illustrative relative cost for one pump repair. Replace the proportions with your own data.
Emergency
Parts
Freight
Overtime
Batch loss
Many plants find emergency work costs several times the planned equivalent. Treat any multiplier as a hypothesis until your own records confirm it.
THE WORKSHEET
Where to Find Each Input
| Input | Where It Lives | Common Mistake |
|---|
| Parts and markup | Purchase orders and CMMS | Counting list price, not the rush price paid |
| Freight | Accounts payable | Missing expedite fees filed under logistics |
| Overtime labor | Payroll and shift records | Ignoring premium rates and call outs |
| Contractor cost | Vendor invoices | Leaving out travel and minimum charges |
| Batch loss | Production and quality logs | Using cost instead of product value |
| Spoilage | Waste and disposal records | Forgetting hold and rework labor |
| Downtime | MES, OEE, or shift reports | Pricing minutes below contribution margin |
THE BIG TWO
How to Price Batch Loss and Downtime
Batch loss
Product value in process multiplied by the share that cannot be saved.
Value at risk × loss share
Downtime
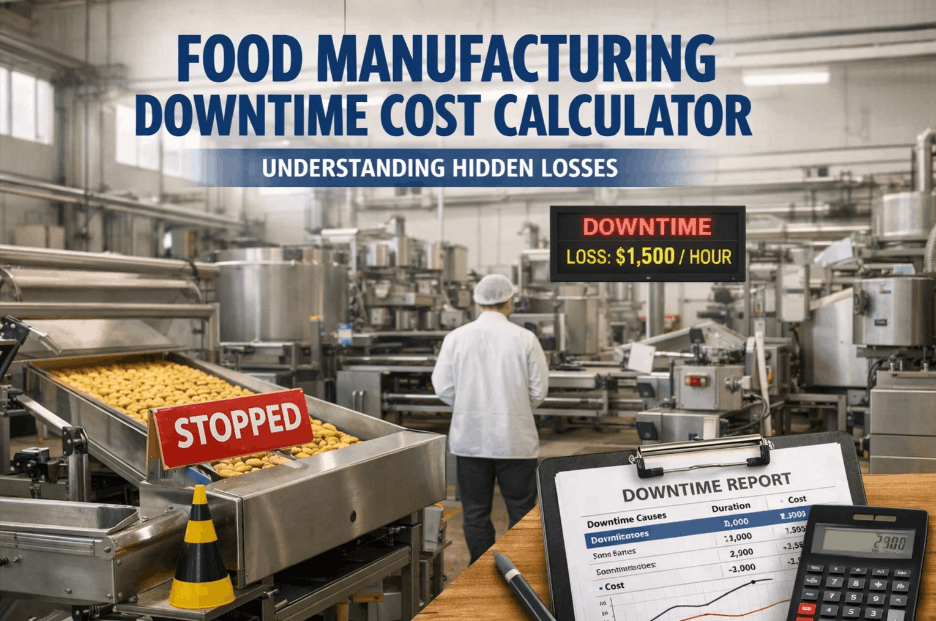
Lost minutes multiplied by contribution margin per line minute, plus restart time.
Minutes × margin per minute
PUTTING THE NUMBER TO WORK
Three Decisions the Model Supports
Justify PdM
Compare avoided emergencies against the cost of monitoring.
Stock the right spares
Weigh carrying cost against rush buy cost per critical part.
Set contractor terms
Negotiate response retainers using real call out history.
BUILD IT THIS WEEK
Four Steps to Your First Number
1
Pick the last five emergency repairs.
2
Pull each input from the worksheet sources.
3
Add them to a fully loaded cost per event.
4
Compare with the planned cost of each repair.
FREQUENTLY ASKED QUESTIONS
What Food Plant Teams Ask About Repair Cost Models
Why is the fully loaded cost so much higher than the invoice?
The invoice shows only parts and labor, while the plant also pays for rush freight, overtime, lost product, and the restart. These costs sit in different budgets, so they rarely get added together. The model brings them into one number.
Walk through a real example with our team.
How many events do we need for a credible number?
Five to ten recent emergency repairs on critical assets is usually enough to show a pattern. Use actual records rather than estimates wherever possible. Finance teams trust the result more when each input traces to a source.
Pick the right events in a working session.
How should we treat near misses and partial stoppages?
Count them separately with their own smaller cost, since the line may have slowed rather than stopped. Including them shows how often small failures add up. Keep the categories clear so full stoppages are not diluted.
Ask support how events are categorized.
Can the model be updated automatically?
Yes, when maintenance, production, and purchasing data are connected, each new event can be costed as it closes. That keeps the figure current for budget reviews. It also shows which assets drive the most emergency spend.
See live event costing in a demo.
How does this connect to predictive maintenance savings?
Each emergency avoided saves the gap between its fully loaded cost and the cost of the planned repair that replaces it. Multiply by avoided events to estimate annual value. This is the number most approvals depend on.
Estimate your savings with a specialist.
MAKE THE COST OF REACTIVE WORK VISIBLE
Put One Defensible Number on Every Emergency
See how iFactory ties failures, parts, labor, and production loss into a live cost model for your food plant.