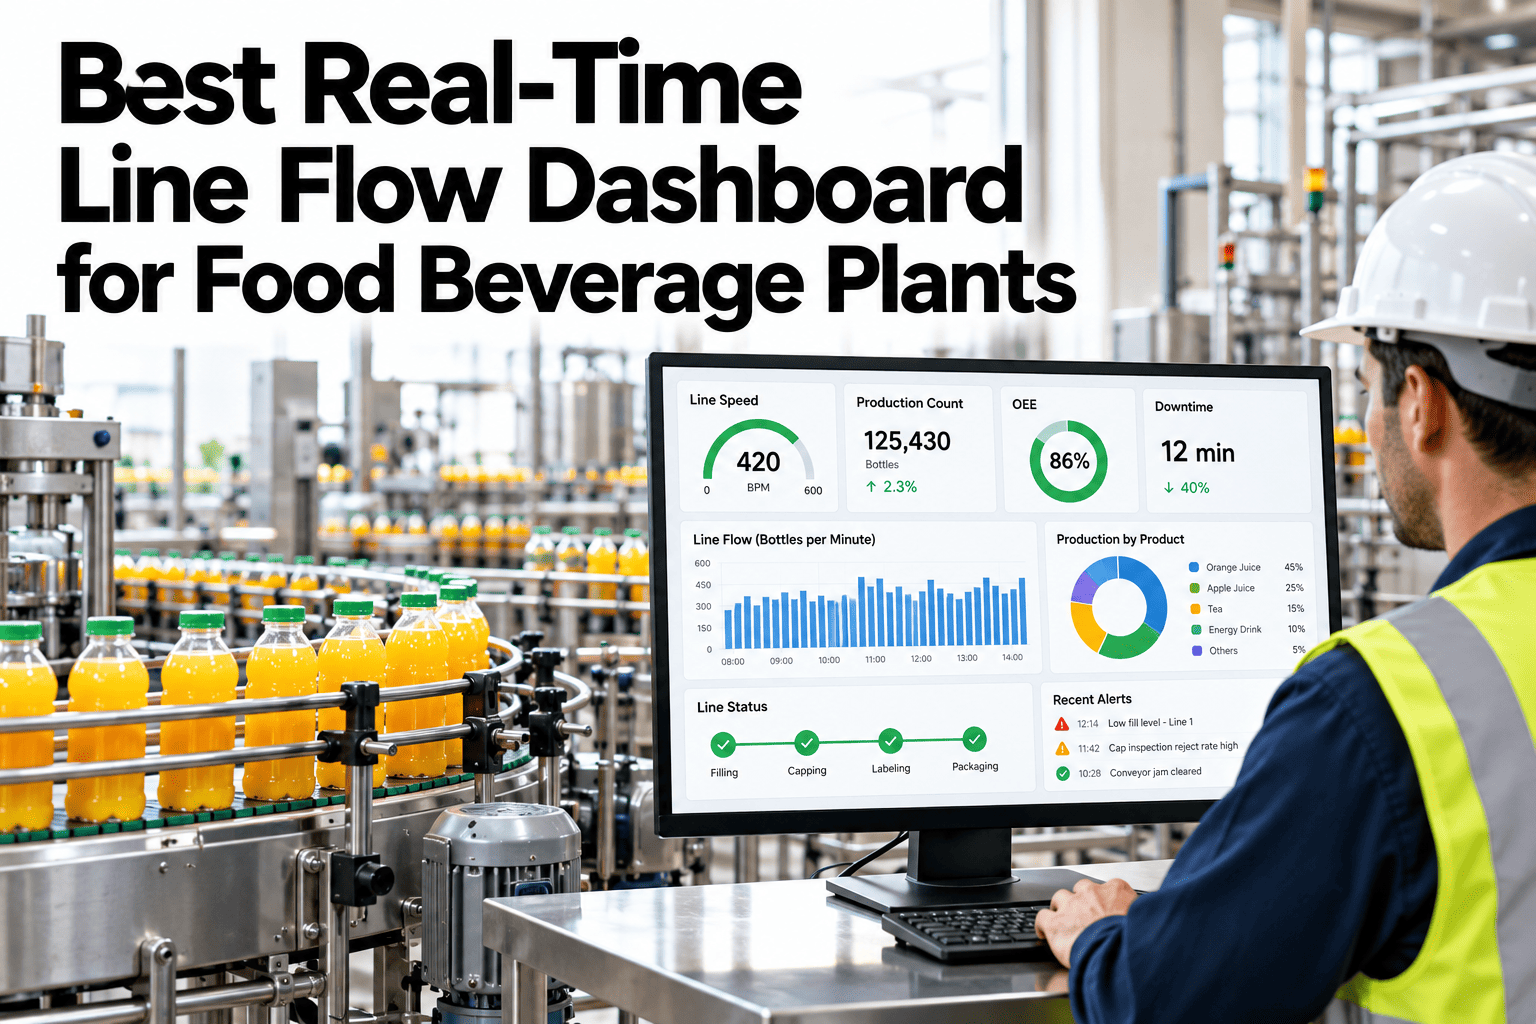
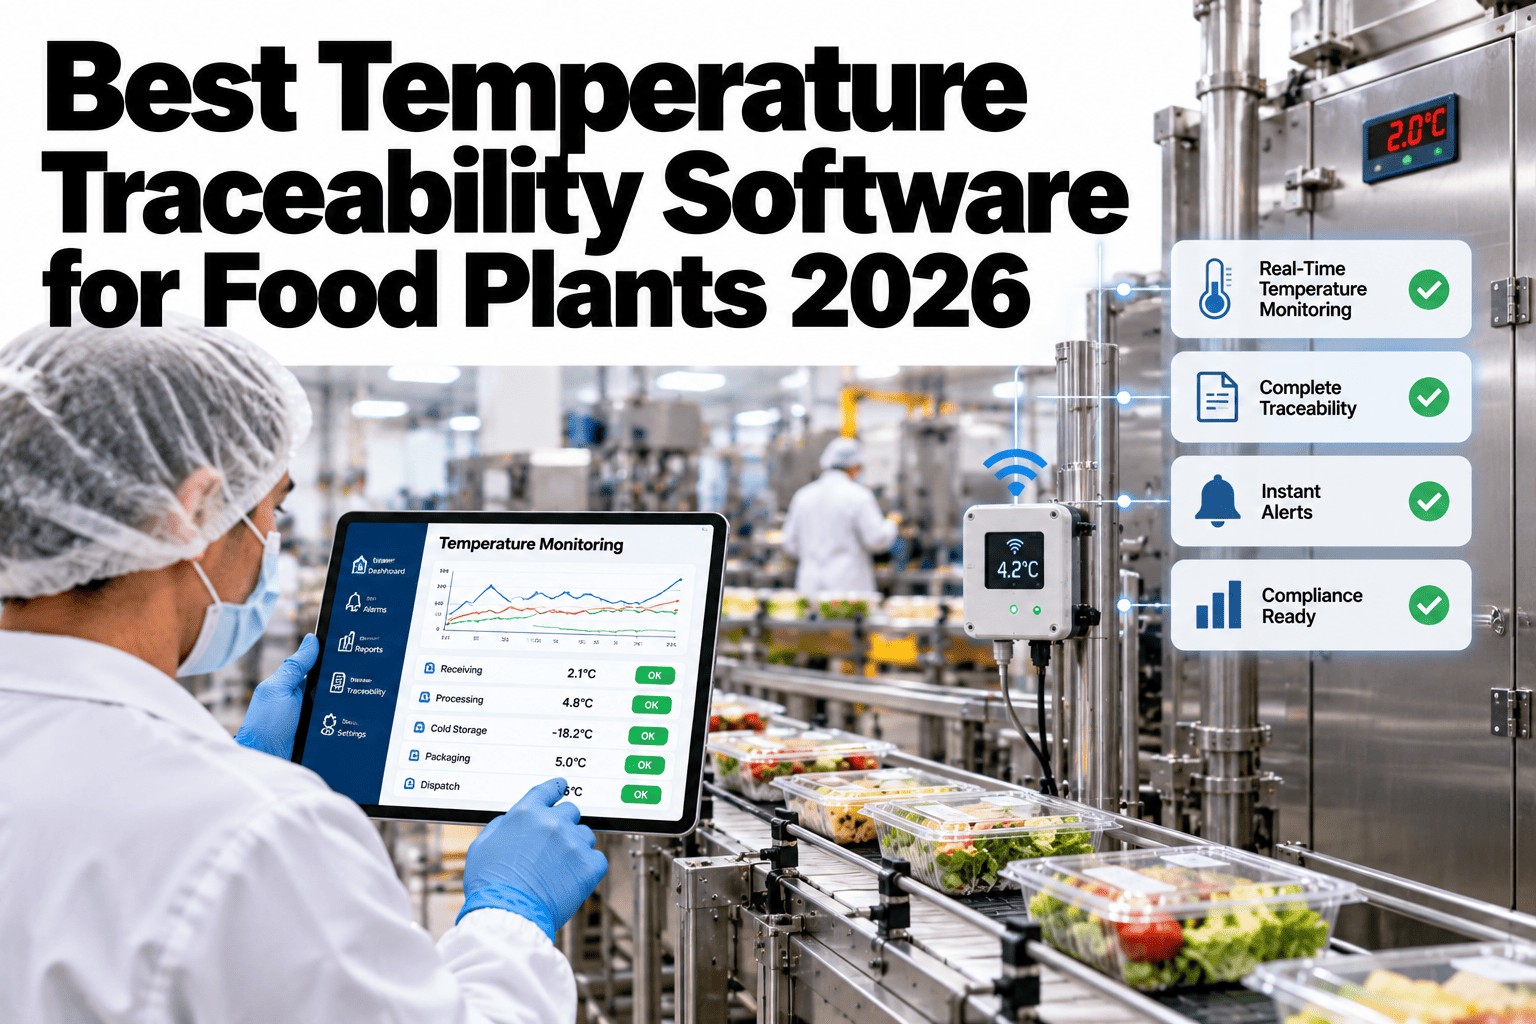
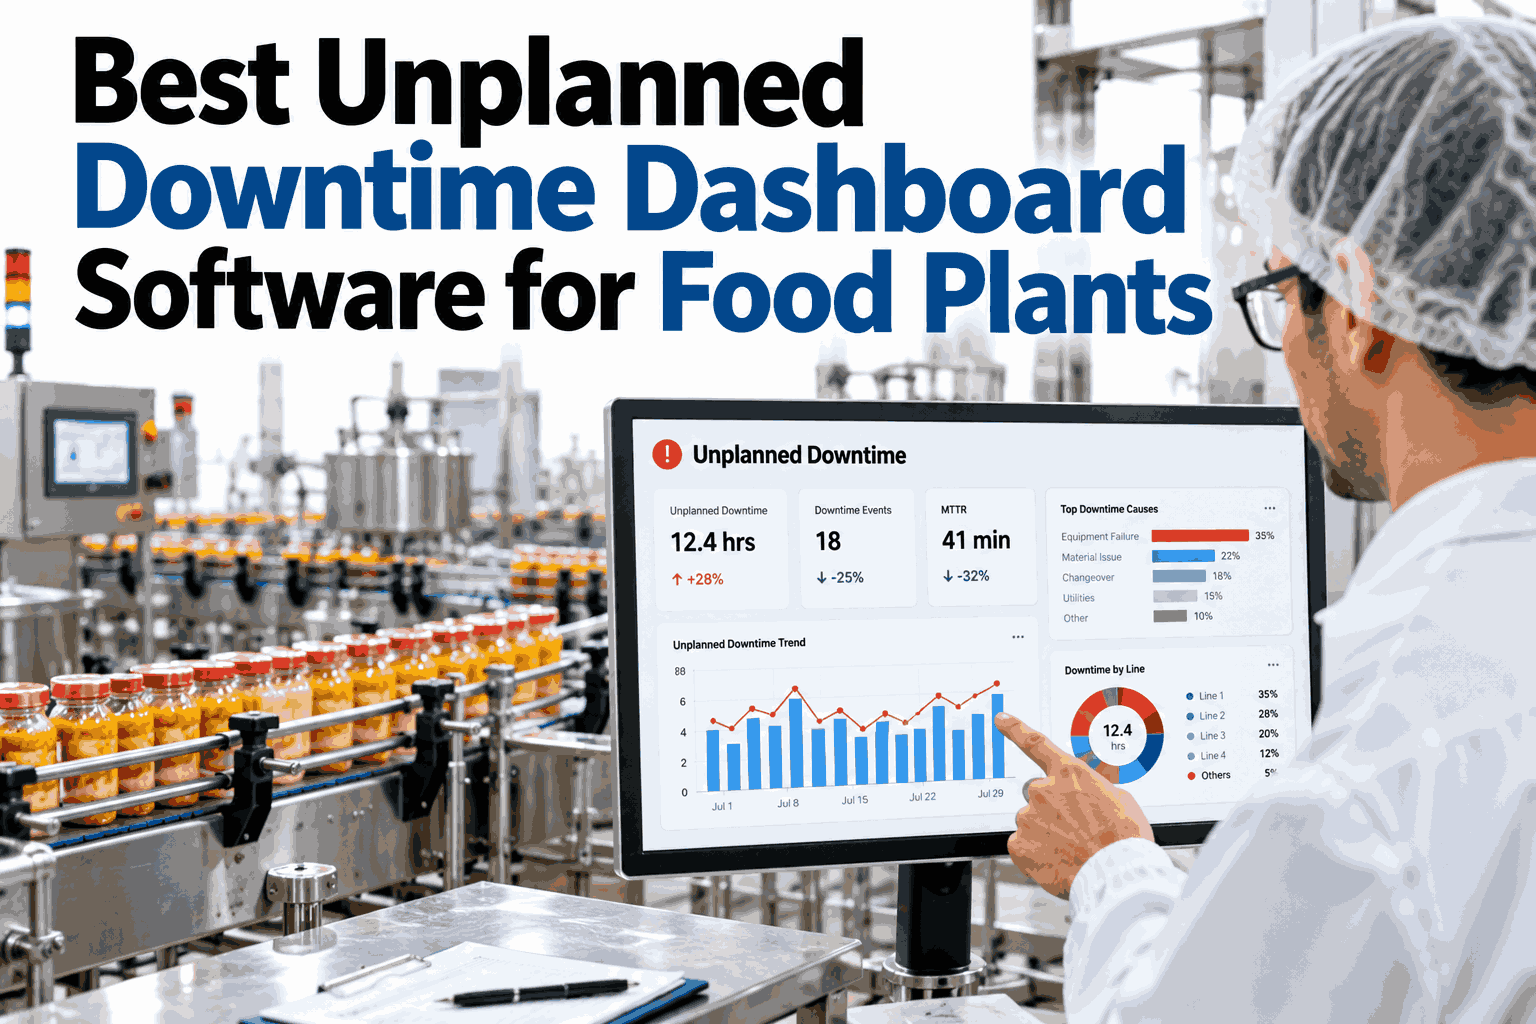
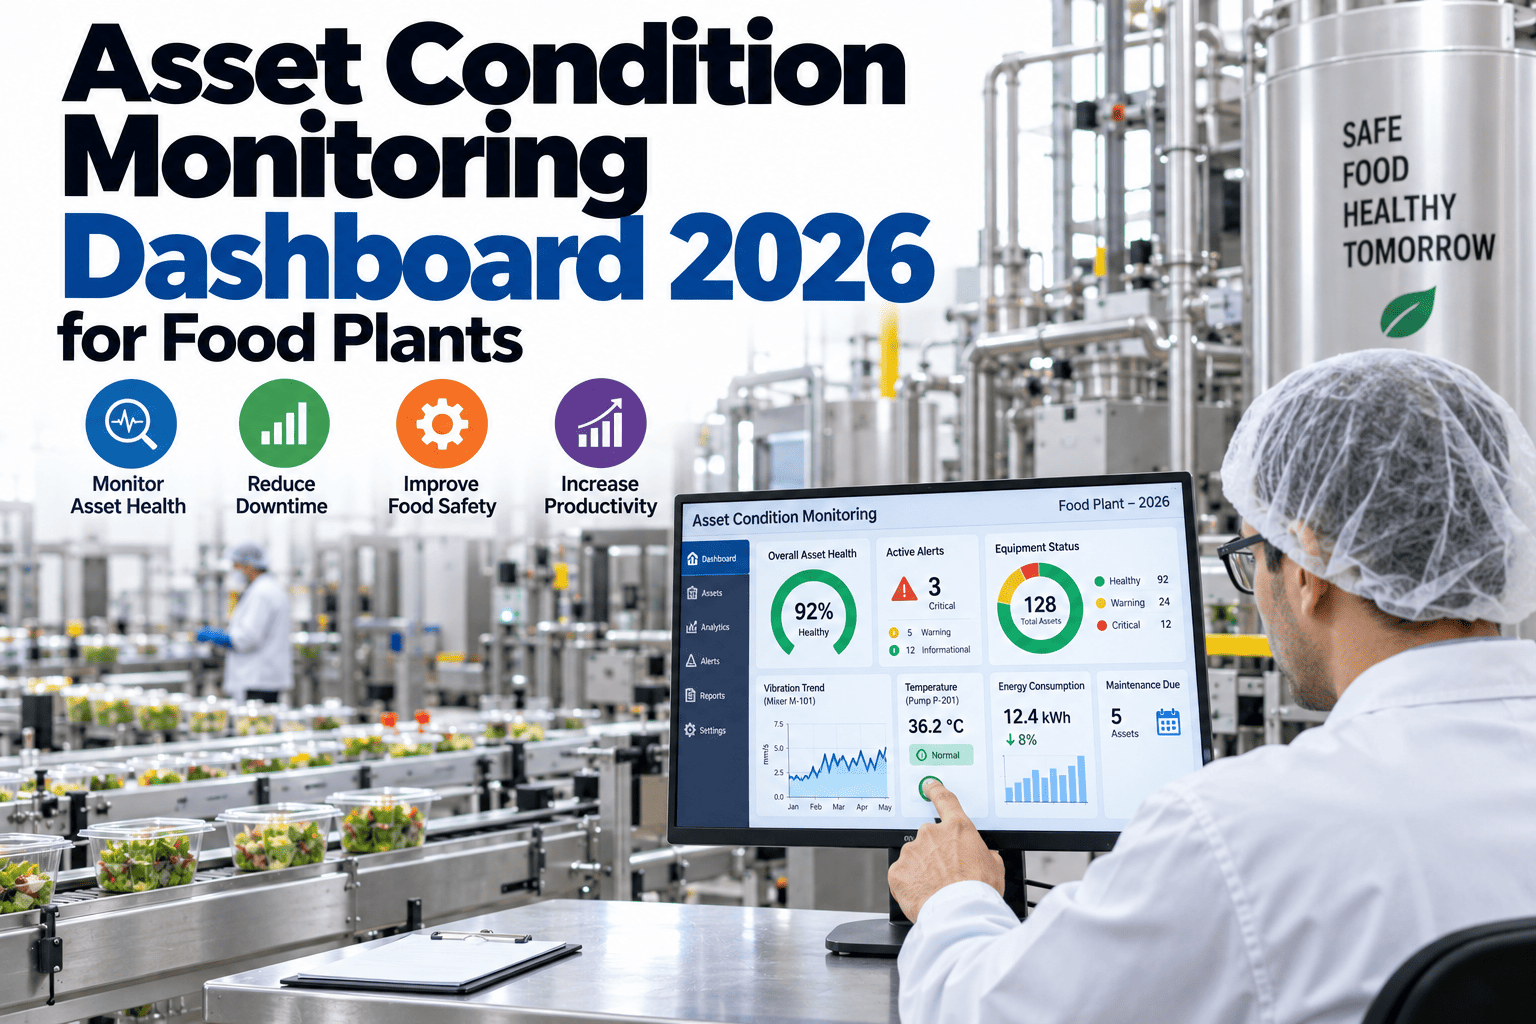
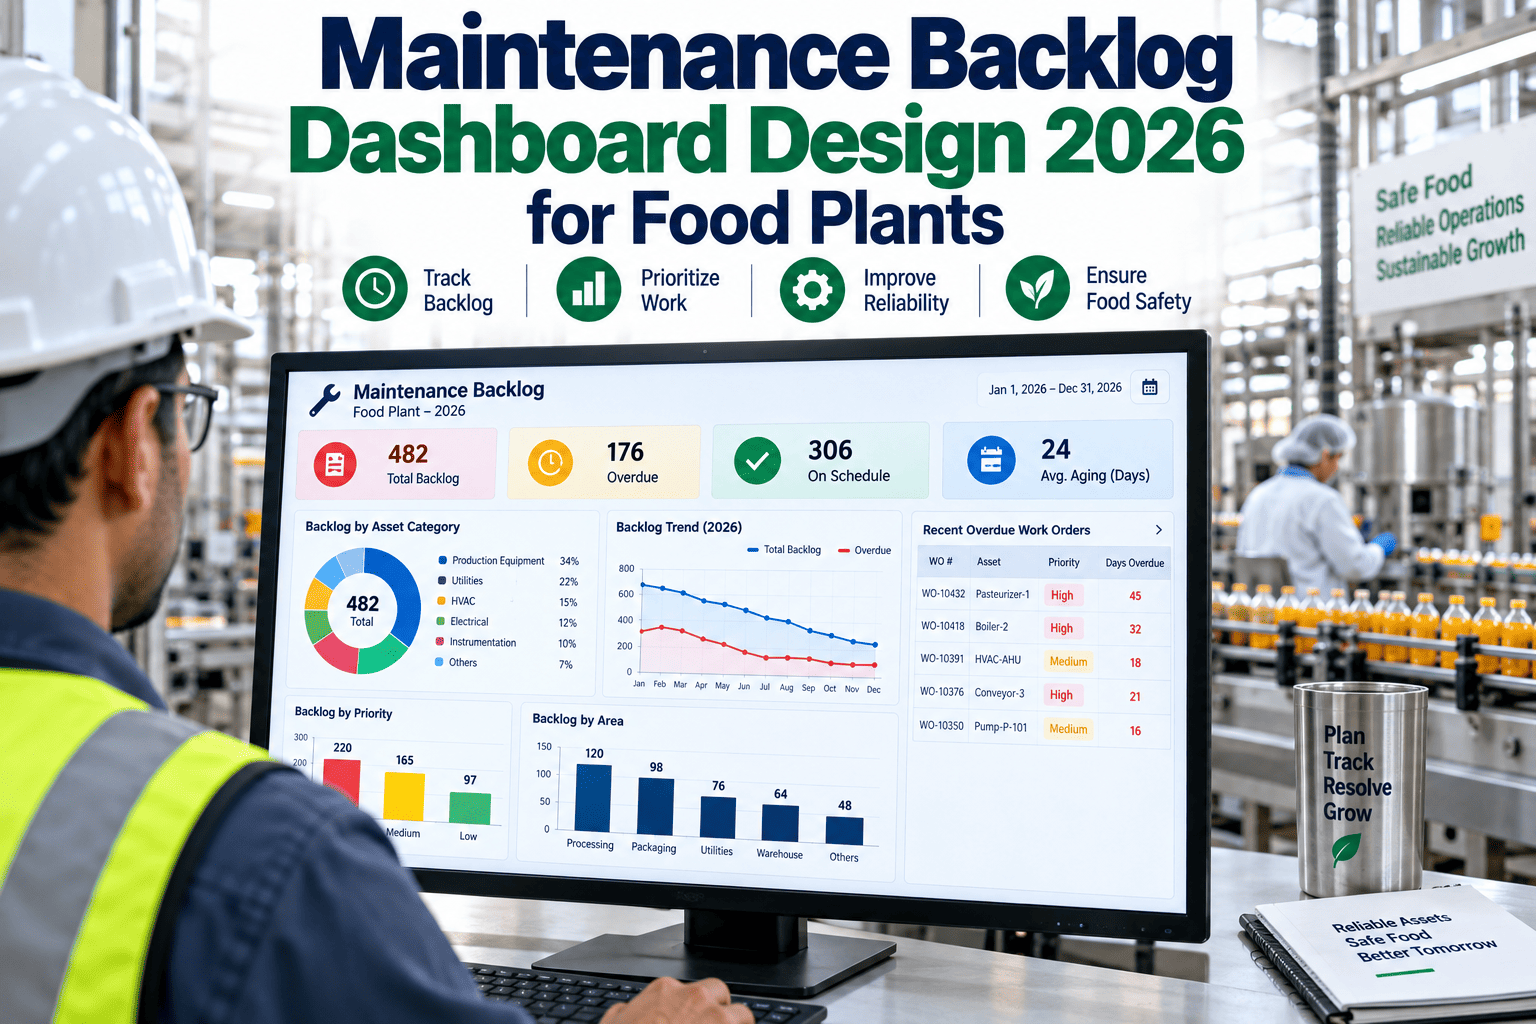
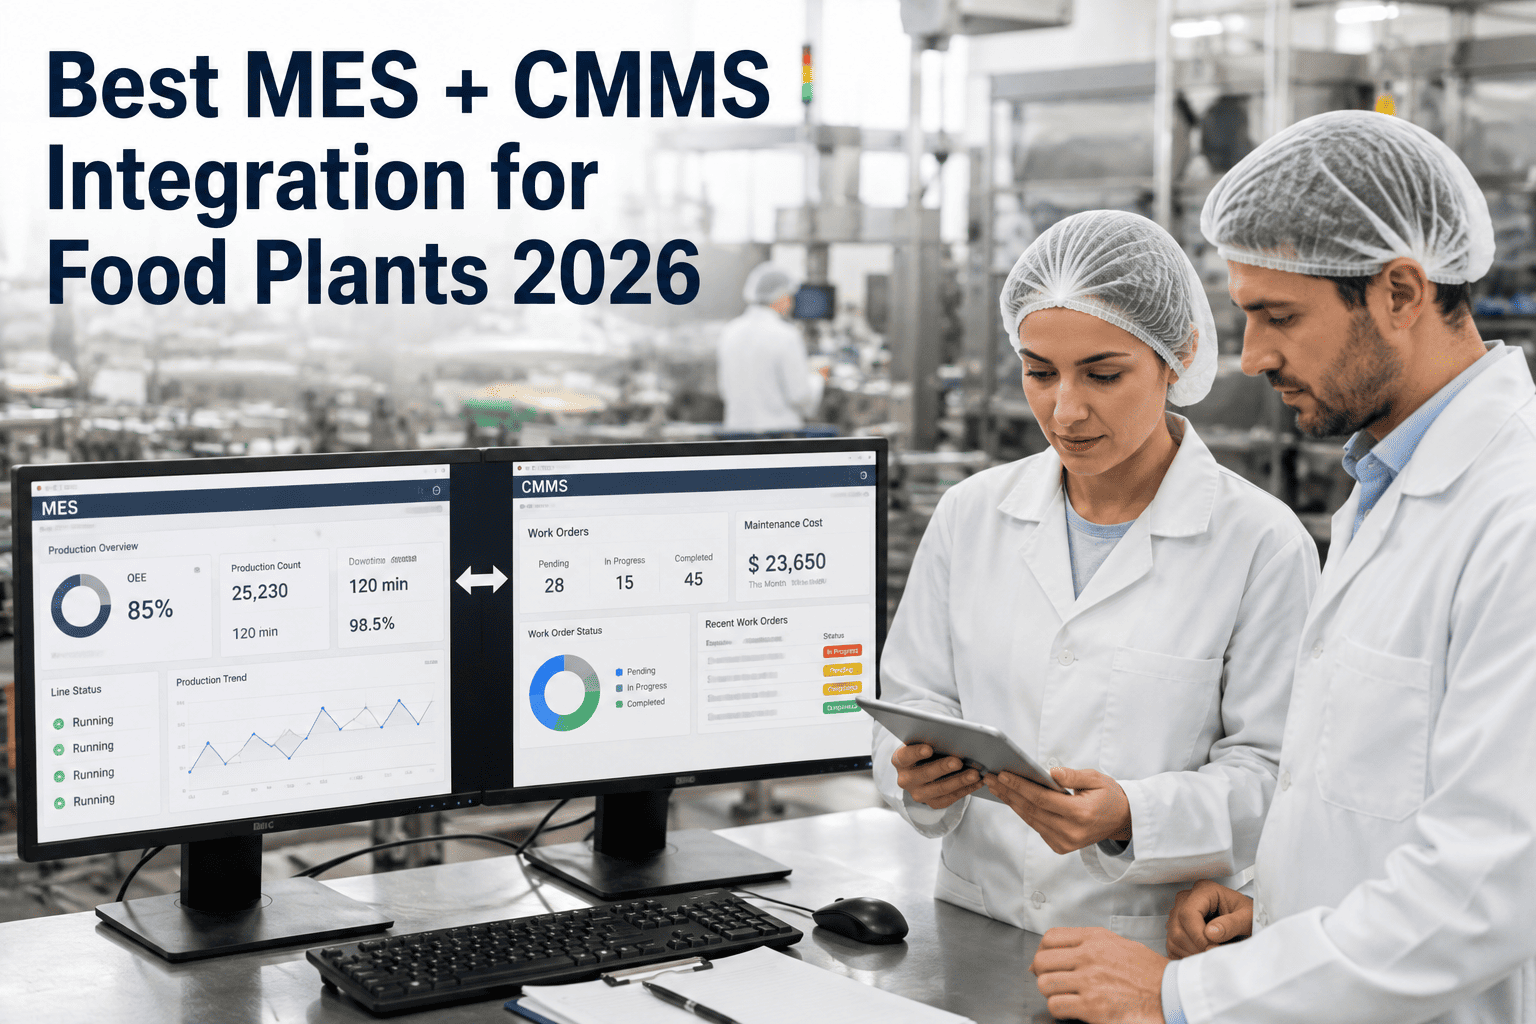
The word "dashboard" gets used loosely in maintenance software marketing, and most food plants have at least one — usually a single screen showing whatever their CMMS vendor decided to surface by default, disconnected from the equipment health data sitting in a separate PdM tool and the downtime numbers living in yet another system entirely. A genuinely useful maintenance dashboard for 2026 has to unify backlog, equipment health, downtime, and PM performance in one place, which is the design standard iFactory builds toward for every food plant deployment.
MAINTENANCE VISIBILITY — 2026
Best Maintenance Dashboard for Food Plants in 2026
A unified view of backlog, equipment health, downtime, and PM performance pulled from your CMMS, ERP, and PLC systems — no more piecing the real story together from five separate screens.
Why Most Maintenance "Dashboards" Aren't Actually Dashboards
A true dashboard is meant to give a complete operational picture at a glance. Most maintenance teams instead have a CMMS report showing backlog, a separate PdM tool showing vibration and temperature trends, a downtime log living in the ERP or a spreadsheet, and a PM compliance number calculated manually once a month. None of these individually is wrong, but none of them alone tells the full story, and stitching them together mentally every time a decision needs to be made is exactly the friction a unified dashboard is meant to eliminate.
The Four Panels Every 2026-Ready Maintenance Dashboard Needs
A maintenance dashboard built for how food plants actually operate needs to bring together four specific categories of data, each pulled live from its native system rather than manually reconciled after the fact.
PANEL 1
Backlog Overview
Total open work orders by age and priority, pulled live from the CMMS, so backlog growth or shrinkage is visible without running a separate report.
PANEL 2
Equipment Health Scores
Condition-based indicators from PdM sensors — vibration, temperature, current draw — rolled up into a simple health score per asset.
PANEL 3
Downtime Attribution
Unplanned downtime hours broken down by cause and line, drawn directly from PLC and MES event logs rather than manually reconstructed after the fact.
PANEL 4
PM Performance
Preventive maintenance compliance rate and schedule adherence, calculated automatically from completed versus scheduled PM work orders.
Data Sources Behind Each Panel
Building a genuinely unified dashboard requires connecting to the specific systems where each data type already lives, rather than asking teams to re-enter data manually into a new tool. The table below maps each panel to its typical source system.
| Dashboard Panel | Primary Source System | Typical Refresh Rate |
|---|
| Backlog overview | CMMS work order data | Real-time or near real-time |
| Equipment health scores | PdM sensors, condition monitoring platform | Continuous |
| Downtime attribution | PLC/MES event logs | Real-time |
| PM performance | CMMS scheduled vs completed PM records | Daily |
See a Unified Dashboard Built From Your Own Systems
iFactory connects to your existing CMMS, ERP, and PLC data to build a single maintenance dashboard covering backlog, equipment health, downtime, and PM performance.
What to Evaluate When Comparing Dashboard Options
Not every maintenance dashboard tool on the market in 2026 handles integration and usability the same way. The criteria below are worth checking specifically before committing to a platform for your facility.
1
Native Integration vs Manual Export
Confirm the dashboard connects live to your CMMS, ERP, and PLC systems rather than requiring periodic manual data exports that quickly become stale.
2
Drill-Down Depth
Check whether a summary metric can be clicked into for the underlying work orders or sensor readings, or if it's a dead-end number with no further detail.
3
Role-Based Views
Verify the dashboard can present different views for a technician, a maintenance manager, and a plant director, rather than one generic view for everyone.
4
Historical Trending
Ensure the platform retains and displays historical trends for backlog, downtime, and health scores, not just a current snapshot.
A Maintenance Manager on Ending the Five-Tab Routine
"
My morning routine before our unified dashboard went live involved opening five different browser tabs and a spreadsheet before I could give an honest answer to the simple question of "how is maintenance doing right now." Backlog lived in the CMMS, our vibration monitoring tool had its own separate login, downtime numbers came from a report someone in operations emailed weekly, and PM compliance was a number I calculated by hand at the end of each month. None of those individual tools were bad at their specific job — the problem was entirely that nothing connected them. Once we had all four of those data sources feeding into one screen, the first thing that changed wasn't even a maintenance metric, it was time. I got back probably thirty minutes every morning that used to go into just assembling a status picture before I could actually think about what to do with it. The second thing that changed was catching a correlation we had genuinely never noticed before, between rising vibration readings on a specific asset class and backlog aging on related work orders, which led directly to a process change in how we prioritize that category of repair.
— Maintenance Manager, Food Processing Plant · Manages Maintenance Across 3 Production Lines
Common Pitfalls When Building a Unified Dashboard
Teams that build a maintenance dashboard for the first time tend to run into the same handful of avoidable mistakes, most of which trace back to treating the dashboard as a display layer rather than a genuine data integration project.
PITFALL 1
Building on Unreconciled Data
Connecting to source systems without first checking whether definitions match produces a dashboard that looks precise but displays conflicting numbers.
PITFALL 2
Designing for Every Metric at Once
Cramming every available metric onto a single screen produces a dashboard nobody can read at a glance, defeating the purpose of unification.
PITFALL 3
Skipping the Pilot Review
Rolling the dashboard out facility-wide before validating panel accuracy against known events risks eroding trust in the tool early on.
PITFALL 4
No Owner for Ongoing Accuracy
A dashboard with no assigned owner to catch data drift as source systems change tends to quietly lose accuracy over time.
Each of these pitfalls is avoidable with the same discipline applied to any serious data project — validate before you build, design around the decisions the dashboard needs to support, and assign clear ongoing ownership once it's live.
Frequently Asked Questions
How long does it typically take to build a unified maintenance dashboard for an existing plant?
For a plant with reasonably well-organized existing systems — a functioning CMMS, some form of condition monitoring, and accessible PLC or MES data — building and validating a unified dashboard typically takes four to eight weeks. Facilities with more fragmented or poorly documented data sources, or a CMMS with significant data quality issues, may need additional time upfront for data cleanup before the dashboard can present a reliable picture, since a dashboard built on inconsistent underlying data will simply surface that inconsistency more visibly rather than solving it.
Does our facility need to replace its existing CMMS to get a unified dashboard?
No — a properly built unified dashboard is designed to connect to your existing CMMS, ERP, and PLC systems rather than replace them, pulling data from each source system into a single consolidated view. This approach avoids the disruption and cost of a full CMMS migration while still solving the core visibility problem of data being scattered across multiple disconnected screens. Replacing a CMMS may be worthwhile for other reasons, but it is not a prerequisite for building a unified dashboard.
Can the dashboard show different information to a technician versus a plant director?
Yes — role-based views are one of the evaluation criteria worth checking specifically, since a technician typically needs detailed work order and equipment-level information to do their job, while a plant director generally wants a higher-level summary across the whole facility with the ability to drill down only when something looks unusual. A well-designed dashboard platform supports both from the same underlying data, configured differently by role rather than requiring separate tools for each audience.
What happens if one of our source systems, like the CMMS, goes down temporarily?
A well-built dashboard should clearly indicate when a specific data source is unavailable or showing stale data, rather than silently displaying an outdated number as if it were current. Most panels will continue showing the most recently synced data with a timestamp during a source system outage, and the dashboard should resume normal live updates automatically once the affected source system comes back online, without requiring manual reconfiguration.
Can iFactory build a unified dashboard using our current CMMS, ERP, and PLC systems?
Yes — assessing your existing systems and how they can be connected is typically the first step in building a unified maintenance dashboard, identifying what data is already available, where any gaps exist, and how each source system's data should be refreshed and displayed. iFactory's platform is designed to integrate with a wide range of common CMMS, ERP, and PLC systems used in food plants. To see a unified dashboard concept built around your specific systems,
book a demo with our team.
Stop Reconstructing Maintenance Status From Five Different Screens
Backlog, equipment health, downtime, and PM performance belong on one screen, pulled live from the systems you already run. iFactory builds the unified dashboard your maintenance team has been missing.