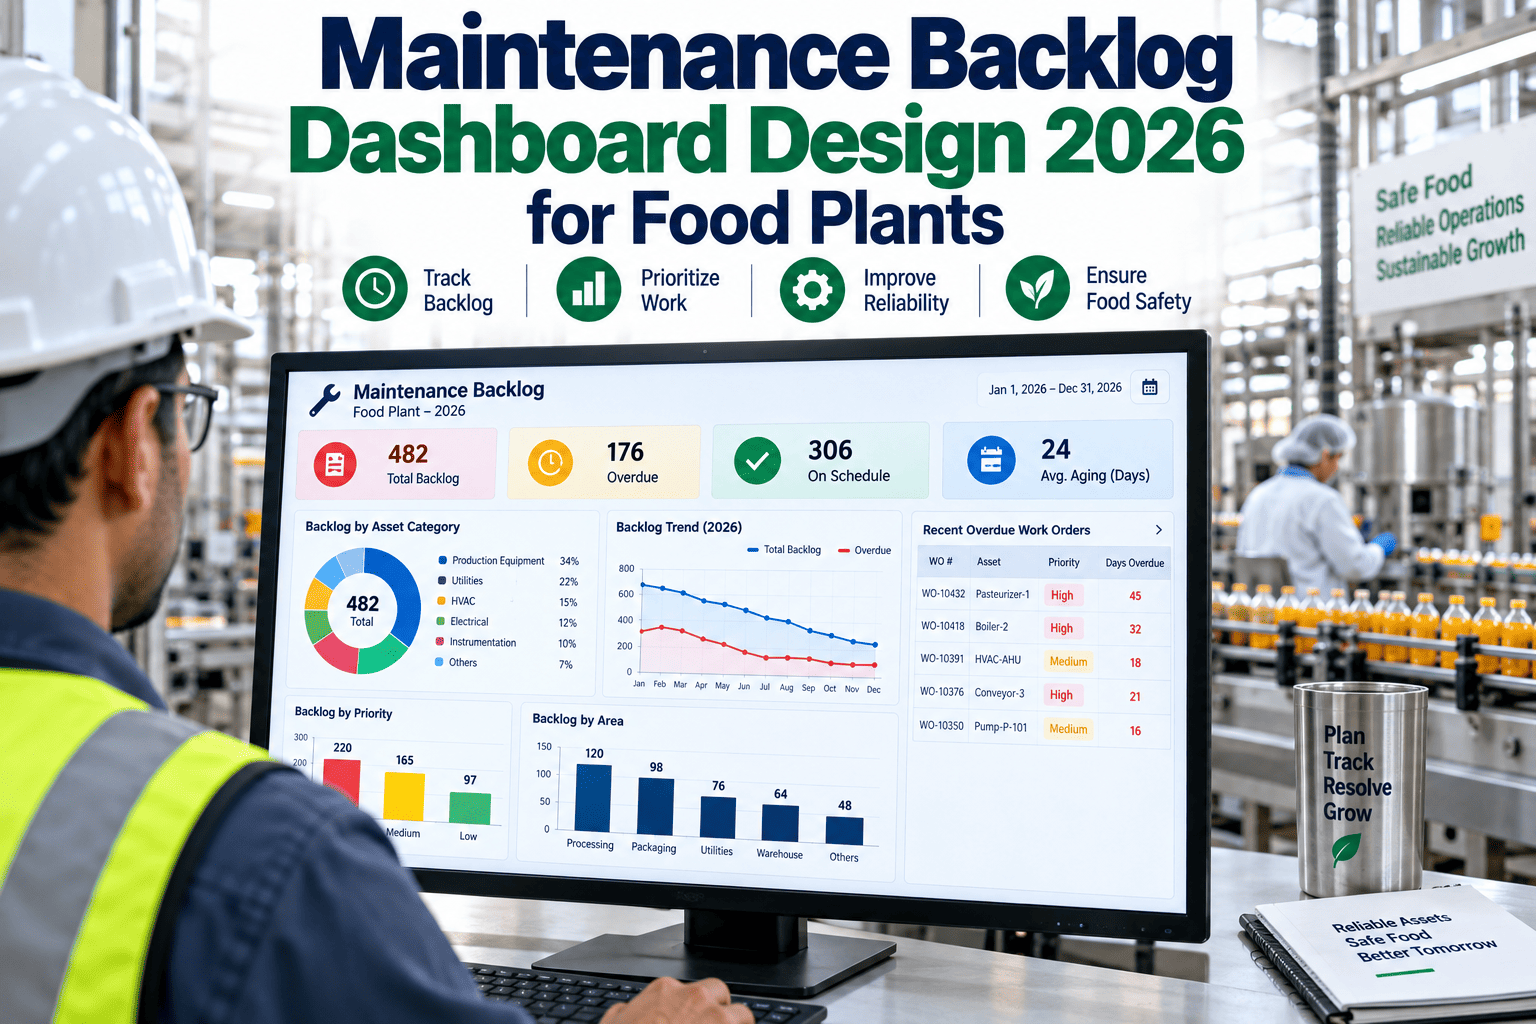
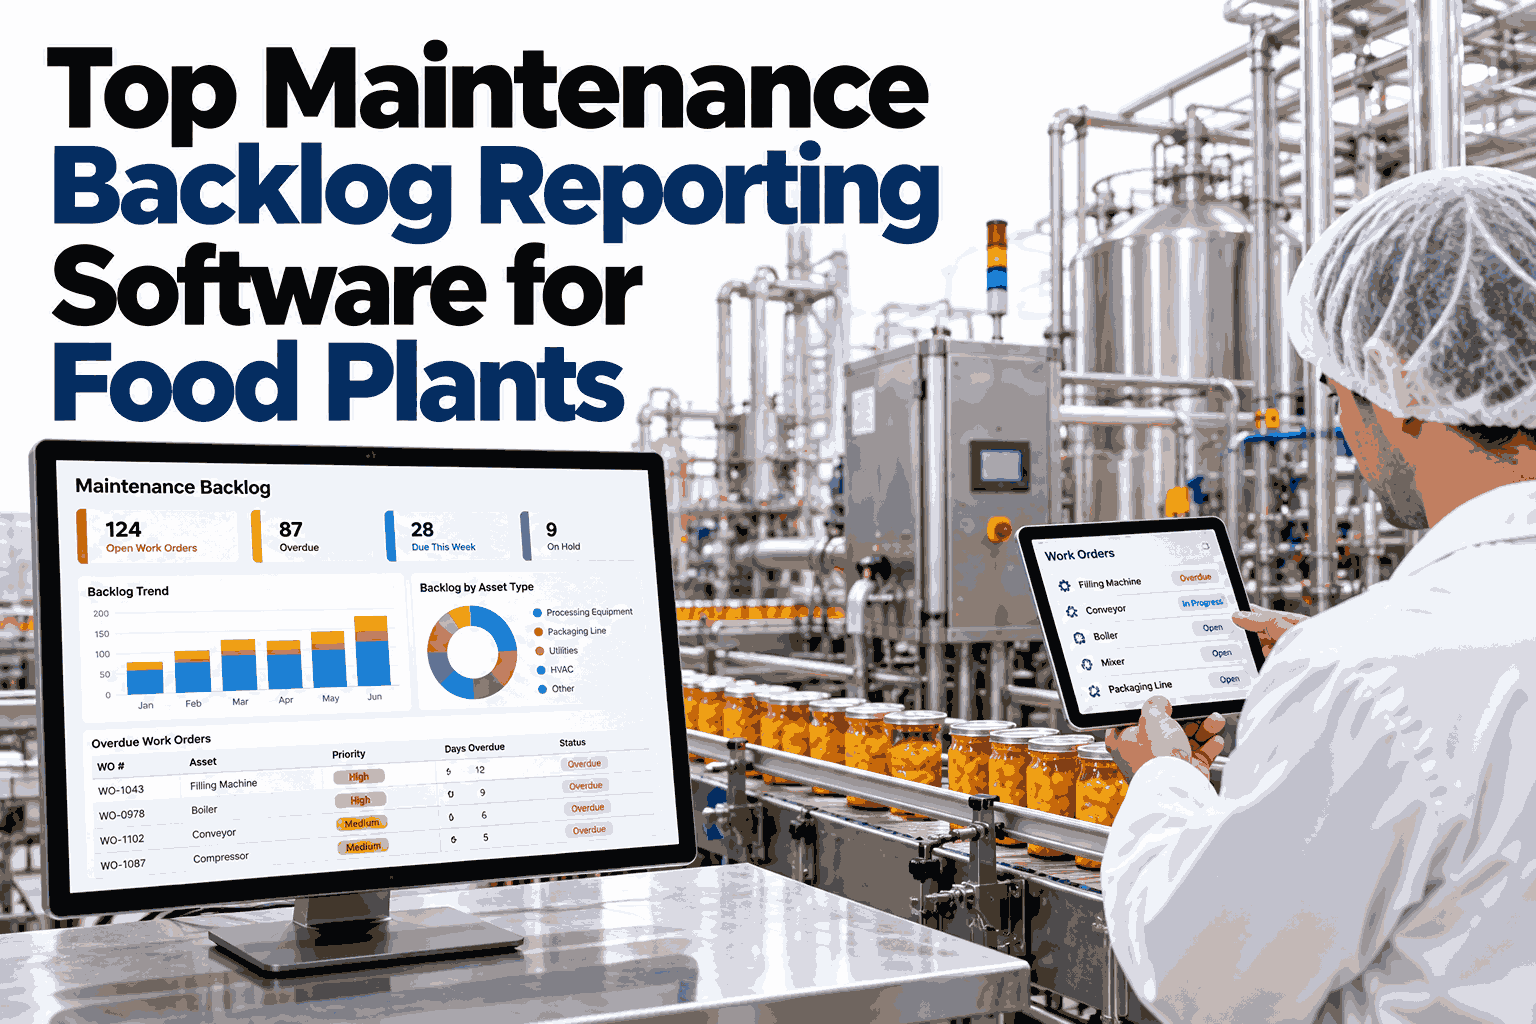
A backlog number by itself — "we have 142 open work orders" — tells a maintenance leader almost nothing useful. Is that 142 mostly fresh requests logged this week, or is a third of it aging past thirty days while a critical asset waits on a part? Without aging, prioritization, resource load, and a burn-down trend all visible together, a backlog count is just a number that sounds either fine or alarming depending on mood rather than data. Designing a dashboard that actually answers the useful question is the focus of this guide, built from the same design principles iFactory applies to backlog visibility for food plant maintenance teams.
BACKLOG DESIGN — 2026
Maintenance Backlog Dashboard Design for Food Plants
Aging, prioritization, resource load, and burn-down trend on one page, with drill-down to the individual work order behind every number — the design standard for 2026.
0-7 days · 54
8-14 days · 38
15-30 days · 28
30+ days · 22
Why a Raw Backlog Count Is a Meaningless Metric on Its Own
Two plants can both report a backlog of 150 open work orders and be in completely different situations — one with a healthy, fast-moving queue where most items close within a week, the other with a stagnant pile where a third of the work has been sitting untouched for over a month while critical equipment quietly degrades. A single count cannot distinguish between these two realities, which is exactly why a backlog dashboard needs to break the number down into the dimensions that actually reveal what's happening underneath it.
The Four Views a Backlog Dashboard Needs
Each of the four views below answers a distinct question a maintenance leader needs answered, and together they replace the flat, uninformative single number most teams currently rely on.
VIEW 1
Aging Breakdown
Work orders bucketed by how long they've been open — 0-7, 8-14, 15-30, and 30+ days — revealing whether the backlog is fresh and flowing or stagnant and aging.
VIEW 2
Prioritization Mix
Backlog split by priority level — critical, high, routine — showing whether resources are actually being directed toward the highest-consequence work first.
VIEW 3
Resource Load
Open work orders mapped against available technician hours, showing whether the backlog size is realistic given current staffing or is structurally unwinnable.
VIEW 4
Burn-Down Trend
Backlog size plotted over time against work orders opened and closed each week, revealing whether the trend is genuinely improving or getting worse.
Reading the Aging Breakdown Correctly
Aging buckets are the single most revealing view on a backlog dashboard, because they expose exactly where work is getting stuck rather than flowing through the system. The table below outlines what each bucket typically signals and the corresponding action worth investigating.
| Aging Bucket | What It Typically Signals | Worth Investigating |
|---|
| 0-7 days | Healthy, recently logged work moving through normal flow | No action needed if this bucket dominates the total |
| 8-14 days | Work still within a reasonable window for most non-urgent priorities | Monitor for items approaching higher-priority thresholds |
| 15-30 days | Work beginning to age beyond typical resolution windows | Review for parts delays, scheduling conflicts, or skill gaps |
| 30+ days | Chronically stuck work, often indicating a structural blocker | Investigate root cause — parts, resourcing, or scope issues |
Build an Aging, Prioritization, and Burn-Down View From Your CMMS
iFactory connects to your existing CMMS work order data to build a backlog dashboard covering aging, priority mix, resource load, and burn-down trend on one page.
Designing Drill-Down Into Individual Work Orders
Every summary number on a backlog dashboard should be a doorway into the individual work orders behind it, not a dead end. A maintenance leader who sees the 30+ day bucket has grown needs to be able to click directly into that list and see exactly which assets, which technicians, and which blockers are involved — without switching back to the CMMS and running a separate filtered report.
✓
Clicking any aging bucket reveals the specific work orders inside it, sorted by age within that bucket.
✓
Each work order shows the asset, assigned technician, priority, and the last logged status update or blocker note.
✓
Filtering by line or department is available without leaving the dashboard to build a new report elsewhere.
✓
The burn-down trend can be filtered to a specific priority level or equipment category to isolate a particular concern.
A Reliability Manager on What the Aging View Actually Fixed
"
Our backlog number had hovered around the same total for close to a year, and the story we told ourselves was that we were just staying steady against a constant stream of new work, which felt like a reasonable explanation at the time. When we finally broke it down by aging bucket instead of just tracking the total, it turned out the steady total was hiding something much less comfortable — our 30-plus day bucket had been quietly growing the entire time, while our fresh, under-a-week bucket had actually been shrinking. The total stayed flat because new work was closing quickly while old work was piling up untouched, and a flat headline number completely masked that split. Once we could see the aging breakdown clearly, it became obvious that a specific parts sourcing bottleneck was the common thread behind most of the aged items, something the flat total had never given us any reason to investigate. Fixing that sourcing issue brought our 30-plus day bucket down by more than half within two quarters, and our total backlog number, which had looked static and unremarkable the whole time, finally started actually moving.
— Reliability Manager, Food Production Facility · Manages Backlog Across 4 Maintenance Teams
Setting Backlog Targets by Equipment Criticality
Not every open work order carries the same consequence if it ages, and a single backlog target applied uniformly across all equipment tends to either over-prioritize low-risk work or under-prioritize critical assets. Segmenting targets by criticality gives the aging and prioritization views above something concrete to be measured against.
CRITICAL ASSETS
Zero Tolerance Beyond 7 Days
Work orders on single points of failure or safety-relevant equipment should rarely, if ever, age past the first aging bucket without an active investigation.
HIGH-VALUE ASSETS
Target Resolution Within 14 Days
Equipment with meaningful downtime cost but some redundancy can tolerate a slightly longer window before aging becomes a genuine concern.
ROUTINE ASSETS
Target Resolution Within 30 Days
Lower-consequence equipment can reasonably sit in backlog longer without meaningfully increasing operational risk to the facility.
Displaying actual performance against these criticality-based targets, rather than a single blanket goal, turns the backlog dashboard from a passive report into an active tool for deciding where the next available technician hour should actually go.
Frequently Asked Questions
What aging thresholds should we use if 7/14/30 days doesn't fit our facility's work order volume?
The specific day thresholds are less important than having consistent, meaningful buckets that reflect your facility's typical resolution timelines — a plant with a fast-moving, high-volume backlog might use tighter buckets like 0-3, 4-7, 8-14, and 15+ days, while a facility with longer typical resolution cycles for complex repairs might extend the buckets accordingly. The key design principle is choosing thresholds that actually separate healthy, in-progress work from work that has genuinely become stuck, based on what "stuck" realistically means for your specific operation.
How should resource load be calculated and displayed against the backlog?
Resource load is typically calculated by comparing the total estimated hours of open work orders against the available technician hours for the relevant period, often broken down by skill category since a backlog full of electrical work is not resolvable by mechanical technicians regardless of overall headcount. Displaying this alongside the backlog total helps distinguish between a backlog that is large but achievable given current staffing versus one that is structurally larger than the team could ever realistically clear without either additional resources or a change in scope.
What does a healthy burn-down trend actually look like on this kind of dashboard?
A healthy burn-down trend shows work orders closed per period consistently at or above work orders opened per period, resulting in a backlog total that holds steady or gradually declines over time rather than climbing. A trend where opened consistently outpaces closed, even if the current backlog total looks manageable, is an early warning sign that the backlog will grow over the coming months unless something changes in resourcing or work intake, which is exactly the kind of forward-looking signal a burn-down view is designed to surface before the total number itself becomes alarming.
Can this backlog dashboard design work with any CMMS, or does it require a specific system?
The design principles described here — aging, prioritization, resource load, and burn-down — can generally be built from the work order data most CMMS platforms already capture, since these fields (creation date, priority level, assigned technician, status, close date) are standard across the large majority of maintenance management systems used in food plants. The specific implementation may vary based on how a particular CMMS structures its data, but the underlying design approach is not tied to any one vendor's platform.
Can iFactory build this backlog dashboard design using our existing CMMS?
Yes — building an aging, prioritization, resource load, and burn-down view from your existing CMMS work order data is a common starting project, typically beginning with an assessment of what fields your current system already captures and how consistently that data has been logged historically. iFactory's platform connects to your CMMS to pull this data into a unified dashboard with drill-down to individual work orders. To see this design built from a sample of your own backlog data,
book a demo with our team.
Turn Your Backlog Number Into an Actual Answer
A flat backlog total can hide a growing crisis or reflect genuine health — you can't tell which without aging, prioritization, resource load, and burn-down trend on one page. iFactory builds this view from the CMMS you already run.