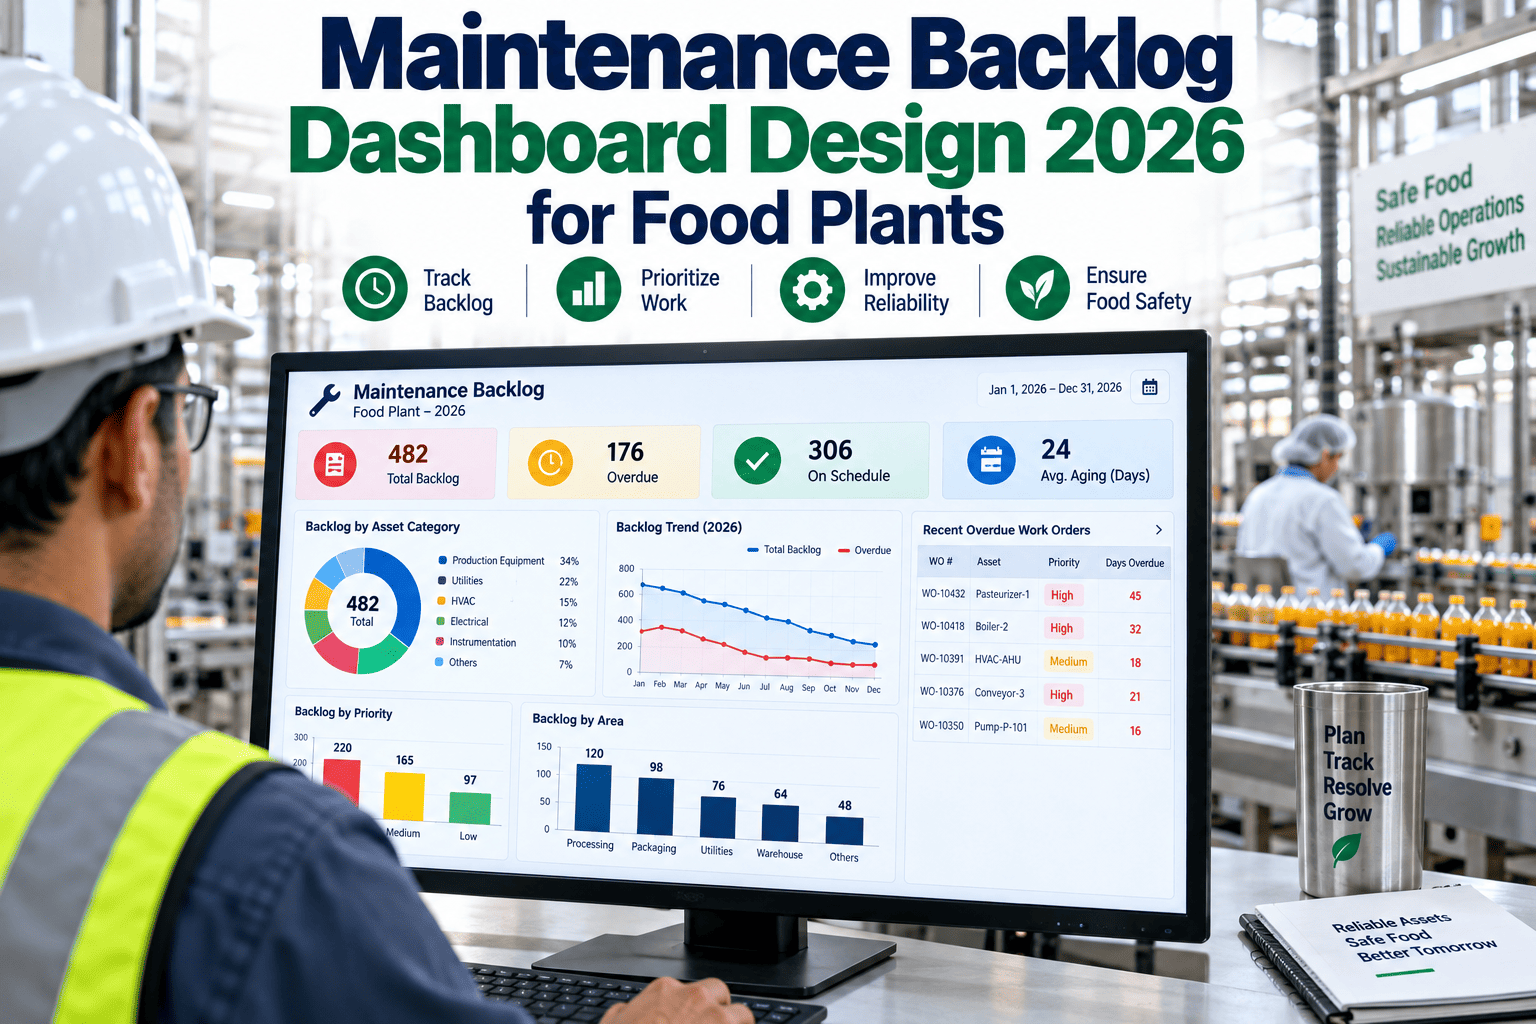
Every food plant has a maintenance backlog, but few can say what is actually in it. Old work orders pile up behind urgent ones, nobody closes the stale ones, and the same few assets quietly absorb most of the overdue work until one of them fails. A backlog is not a to-do list to be ashamed of. It is a map of where the next breakdown is likely to come from, if you can read it by age, asset, and risk. This article explains how to build that view and what to demand from backlog reporting software in 2026, and you can see a living backlog report on your own work orders before you commit.
ARTICLE · BACKLOG AGING REPORTS · FOOD PLANTS
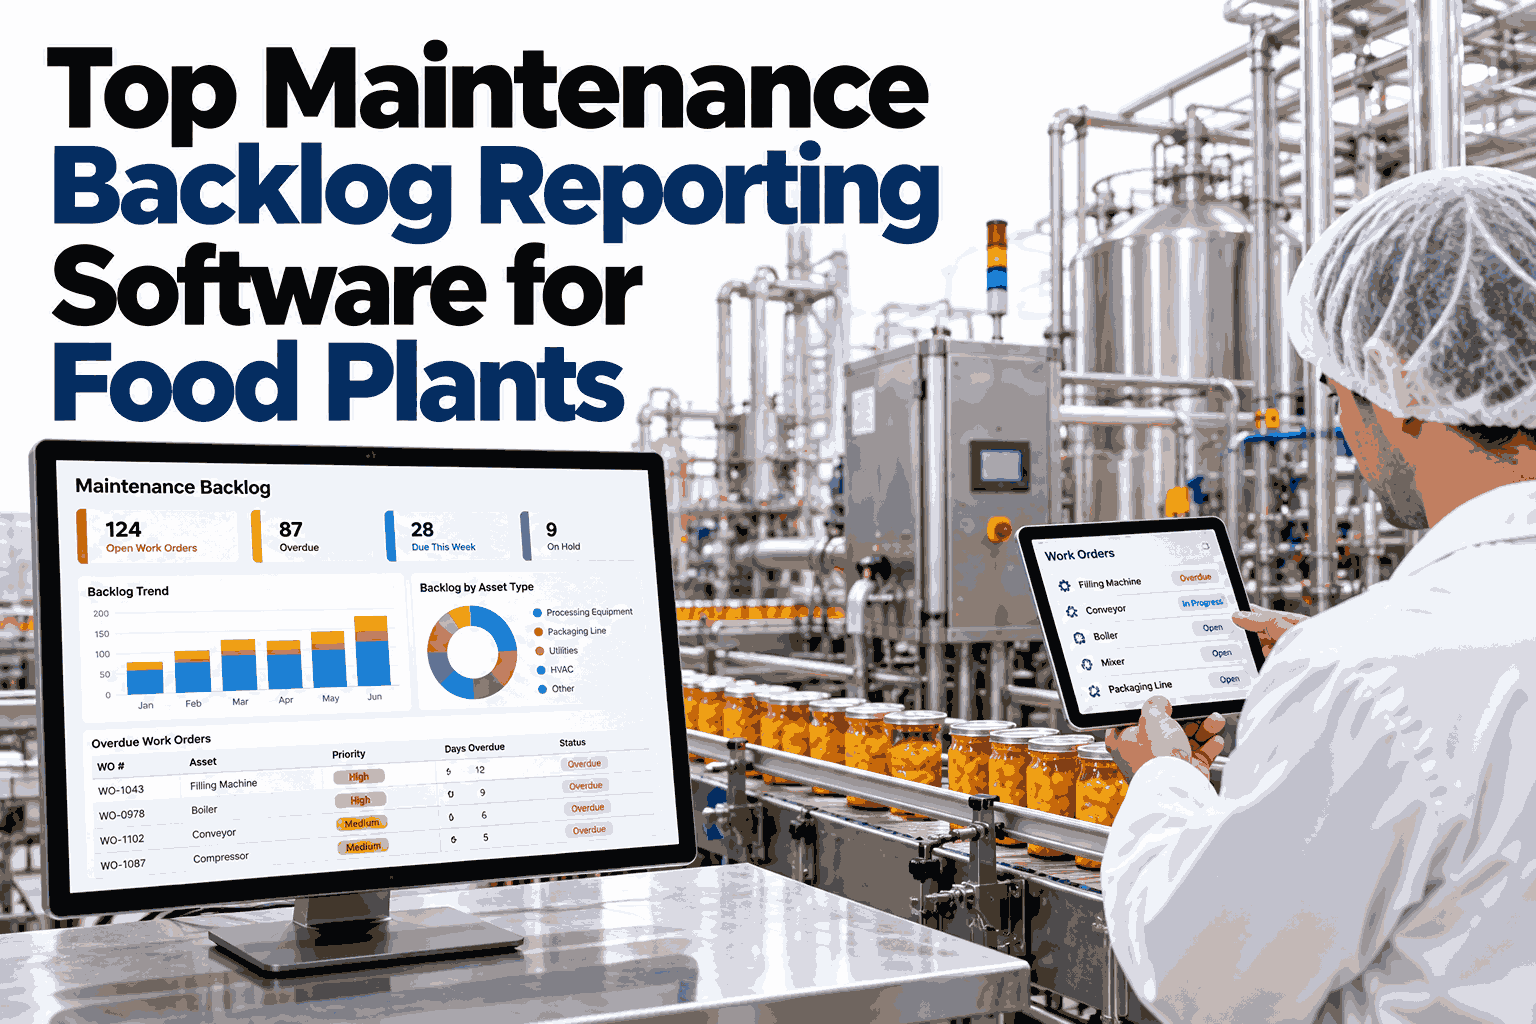
Top Maintenance Backlog Reporting Software for Food Plants
A living view of overdue work orders, absorbing assets, and the places where the next failure is most likely to start.
THE CORE METRIC
Measure Backlog in Weeks, Not Work Orders
A count of open orders hides the real load. Hours against crew capacity tells the truth.
Open planned hours
÷
Weekly crew capacity
=
Weeks of backlog
Thin
Healthy
Growing
Overloaded
A commonly cited rule of thumb for a healthy planned backlog is a few weeks of crew capacity. Set your own range from your plant's history.
AGING BUCKETS
How Old Is the Work Waiting to Be Done?
Illustrative distribution of open work orders by age. The oldest bucket deserves the hardest look.
ABSORBING ASSETS
The Heat Map That Shows Where Work Piles Up
Darker cells mean more overdue work. Illustrative layout only.
0 to 7
8 to 30
31 to 90
90+
Filler line
Boiler
Conveyors
Refrigeration
Packaging
WHAT A LIVING REPORT SHOWS
Four Views Every Backlog Report Should Have
Overdue by asset
Which machines carry the most deferred work.
PM compliance
Whether preventive tasks are finished on time.
Priority mix
How much of the backlog is truly safety or food safety work.
Trend over time
Whether the backlog is shrinking, flat, or growing.
STATIC VS LIVING
Why the Monthly Spreadsheet Is Not Enough
| Question | Monthly Export | Living Backlog Report |
|---|
| Freshness | Out of date within days | Updates as orders open and close |
| Stale orders | Buried in long lists | Flagged by age automatically |
| Risk view | Count of open items | Ranked by asset criticality |
| Link to failures | None | Compared with breakdown history |
CUTTING THE BACKLOG
Four Moves That Shrink It Without Burning Out the Crew
1
Clean it
Close duplicates and work that no longer applies.
2
Rank it
Sort what remains by asset criticality and risk.
3
Bundle it
Group jobs by asset and planned shutdown window.
4
Prevent it
Use condition data so fewer urgent jobs are created.
FREQUENTLY ASKED QUESTIONS
What Food Plant Teams Ask About Backlog Reporting
How big should a healthy maintenance backlog be?
A common guideline is a few weeks of crew capacity, enough to keep planners busy without letting work go stale. The right figure depends on your crew size, shutdown pattern, and asset risk. Trend and age matter more than the single number.
Set your target range with our team.
What should we do with very old work orders?
Review each one and either schedule it, convert it into a condition check, or close it with a reason. Many old orders describe problems that were fixed another way. Clearing them makes the true backlog visible.
Walk through a stale order review live.
Can the report connect backlog to failures?
Yes, when work orders and breakdown records share the same asset list. The report can then show which assets had deferred work before they failed. This turns backlog into an early risk signal.
Ask support how asset records are linked.
Does it work with our existing maintenance system?
Reporting layers usually read from the maintenance system you already use, so no migration is needed to begin. Data quality such as consistent asset names does affect results, and early cleanup pays off.
Check compatibility in a demo session.
How quickly can we see results?
The aging view and asset heat map are available as soon as work order data is connected. Reducing the backlog itself takes longer and depends on crew capacity and planning discipline. Early wins usually come from cleanup and bundling.
Plan a first backlog review with us.
SEE THE BACKLOG BEFORE IT BECOMES A BREAKDOWN
Turn an Old Work Order List Into a Risk Map
See how iFactory ages, ranks, and links your overdue work to the assets most likely to fail next.