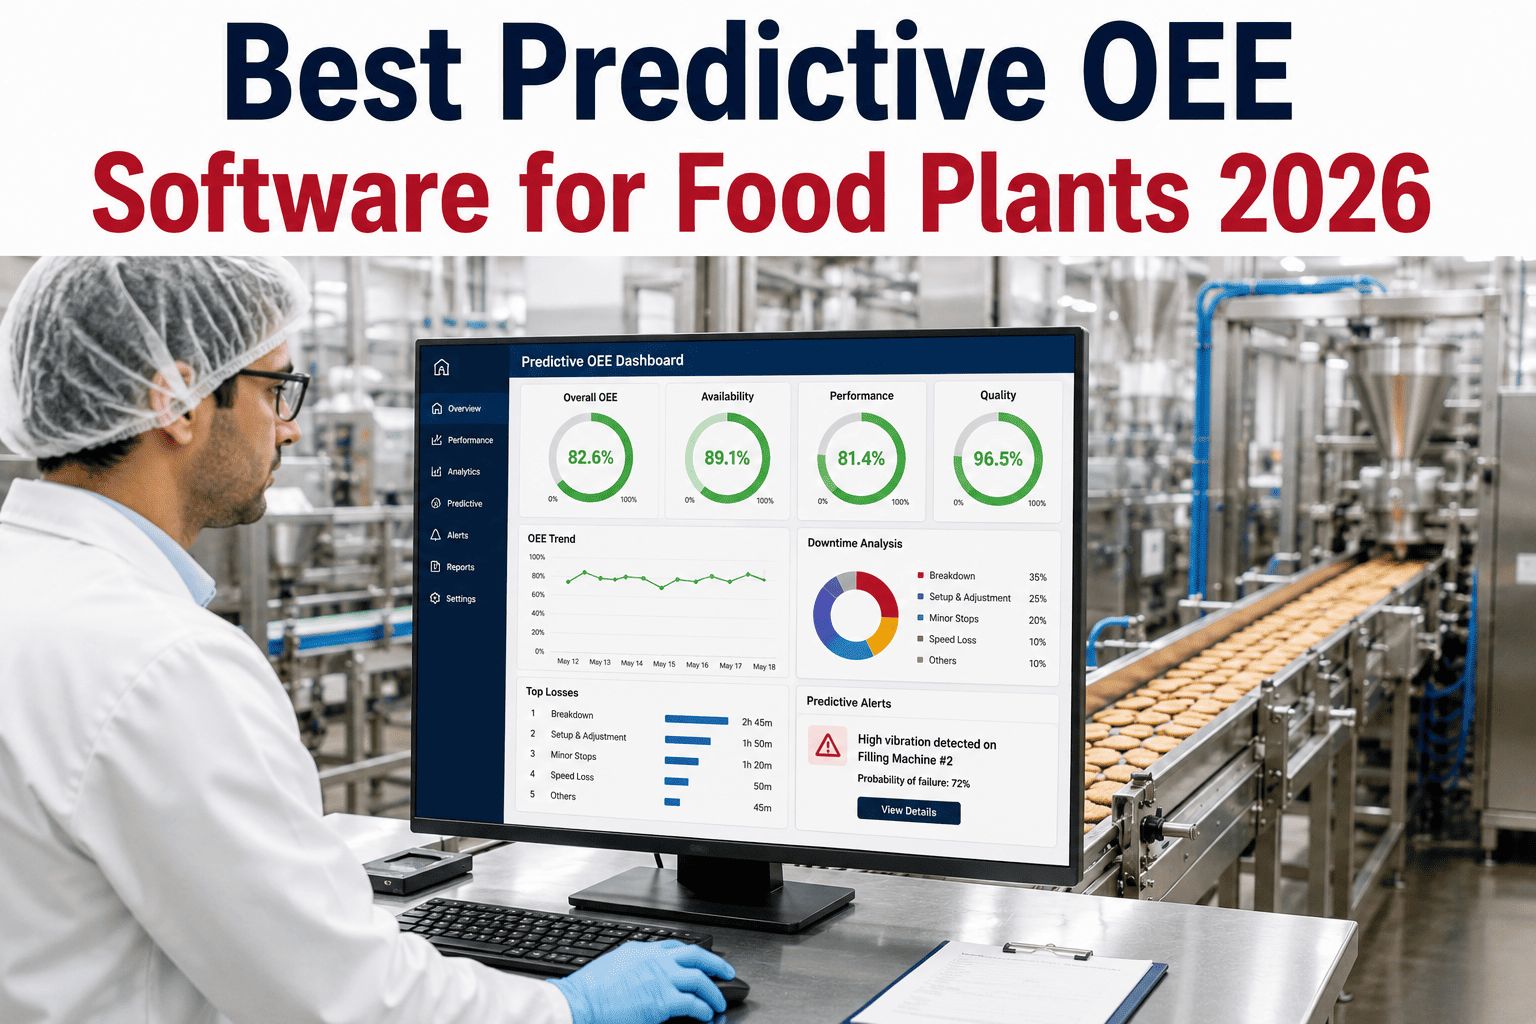
Most food plants can already tell you what their OEE was last week. Far fewer can tell you what it will be next Tuesday on the second shift, or which line is about to slide below target before it actually happens. That gap between reporting the past and anticipating the future is the difference between descriptive OEE and predictive OEE, and it is where the real cost savings live. A dashboard that refreshes every morning with yesterday's number is useful for accountability, but it cannot stop a changeover from running long or a filler from drifting out of micro-stop territory while there is still time to intervene. iFactory was built to close that gap by moving food plants through a structured maturity path, from descriptive reporting to predictive forecasting to prescriptive recommendations that tell operators what to do next, not just what already went wrong. You can book a demo to see where your own plant currently sits on that ladder.
OEE MATURITY · PREDICTIVE ANALYTICS · FOOD & BEVERAGE
From Yesterday's OEE Report To Tomorrow's Prevented Loss
iFactory tracks where your plant sits on the OEE maturity curve, forecasts shift-level performance before it happens, and recommends the specific action that keeps a line on target.
THE THREE RUNGS OF OEE MATURITY
1
Descriptive
What happened yesterday, reported after the shift ends
2
Predictive
What is likely to happen this shift, forecast in real time
3
Prescriptive
What action to take right now to hold the target
WHY MOST FOOD PLANTS STALL AT DESCRIPTIVE
A Number From Yesterday Cannot Change Today's Outcome
Descriptive OEE answers a backward-looking question well: it tells a plant manager exactly how a line performed across availability, performance, and quality for a shift that has already ended. The trouble is that the decision window for most of the losses buried in that number closed hours earlier, so the report becomes a scorecard rather than a lever. Food plants in particular run tight changeover schedules, frequent SKU switches, and CIP cycles that eat into run time in ways a monthly or even daily rollup smooths over rather than exposes.
60-70%
Share of food plants still operating with descriptive-only OEE reporting today
3-5 pts
Typical OEE gain reported after moving from descriptive to predictive monitoring
24 hrs
Common lag between a developing issue and its appearance on a standard daily report
WHAT PREDICTIVE OEE ACTUALLY REQUIRES
The Data And Models Behind A Real Forecast
Predictive OEE is not a faster dashboard; it depends on a specific stack of data and modeling that most descriptive systems were never built to support. Skipping any of these layers usually produces a forecast that looks impressive in a demo but falls apart against real production variability.
01
Continuous Signal Capture
High-frequency data from PLCs, sensors, or vision systems, not periodic manual entries, so the model has enough resolution to learn real patterns.
02
Historical Pattern Library
Enough shift, SKU, and changeover history for the model to recognize what a normal run looks like versus an early warning sign.
03
Shift-Level Forecasting Model
A model that projects likely availability, performance, and quality for the remainder of the current shift, updated as new data arrives.
04
Prescriptive Recommendation Layer
A translation of the forecast into a specific, actionable step an operator or supervisor can take before the loss actually occurs.
See Your Line's OEE Forecast Before The Shift Ends
iFactory connects to your existing PLCs and historians to build a forecasting model tuned to your own product mix and changeover patterns. Book a demo and bring a recent shift's data.
DESCRIPTIVE VS PREDICTIVE VS PRESCRIPTIVE
What Each Layer Actually Delivers On The Floor
The three layers are not interchangeable, and a plant does not need to choose only one; each builds on the one before it, and most gains only appear once all three are working together.
| Capability |
Descriptive |
Predictive |
Prescriptive |
| Timing |
After shift ends |
During the shift |
Before the loss occurs |
| Primary Question |
What happened? |
What is likely to happen? |
What should we do now? |
| Typical User |
Plant manager, weekly review |
Shift supervisor, live floor |
Line operator, real time |
| Data Need |
End of shift totals |
Continuous signal stream |
Forecast plus reason history |
WHERE THE PRESCRIPTIVE LAYER PAYS OFF
Recommendations That Change What Happens Next
Once a plant has a working forecast, the next question is what to do with it, and this is where most descriptive-only tools stop short. iFactory's prescriptive layer turns a forecasted dip into a specific recommendation tied to the reason history behind similar past events.
Changeover Sequencing
Recommends the changeover order that minimizes total downtime when multiple SKU switches are queued for a shift.
Micro-Stop Early Warning
Flags a filler or packaging line trending toward a stoppage pattern before the actual stop registers.
Staffing And Break Timing
Suggests break windows that avoid overlapping with the highest-risk period in the forecasted shift curve.
Quality Drift Alerts
Surfaces early quality signal drift tied to speed or temperature settings before reject rates climb.
WHO BENEFITS MOST
Built For Multi-Line, Multi-Shift Food Operations
Predictive OEE earns its value fastest in operations with enough shift and SKU variability that patterns are hard for a person to track manually across every line at once.
High-Mix Packaging Lines
Frequent changeovers create the richest pattern data for a forecasting model to learn from.
Multi-Shift Bakeries And Dairies
Shift-to-shift variance is often the single largest lever available without new equipment.
Beverage Filling Operations
High-speed lines where micro-stops accumulate quickly benefit most from early warning.
Multi-Plant Food Groups
Consistent forecasting logic across sites supports fair benchmarking and capital prioritization.
FREQUENTLY ASKED QUESTIONS
Questions Food Plant Teams Ask About Predictive OEE
How much historical data do we need before the forecast becomes reliable?
Most lines with consistent SKU patterns produce a usable early forecast within a few weeks of connected data, though accuracy keeps improving as the model sees more shift and seasonal variation. High-mix lines with many SKUs typically need a slightly longer window to capture every changeover pattern.
Book a demo to review a realistic timeline for your product mix.
Do we need to replace our existing OEE dashboard to get predictive forecasting?
No, predictive forecasting is designed to sit alongside existing reporting rather than force a full replacement, since many plants still need the descriptive rollup for compliance and shift handoff records. The forecast and recommendation layers simply add a forward-looking view on top of the data you already collect.
Contact our support team to discuss integrating with your current setup.
What happens when the forecast is wrong?
Every forecast is a probability, not a guarantee, and the model is continuously retrained against actual outcomes so its accuracy improves over time rather than staying static. Supervisors also see a confidence range alongside each forecast so they can weigh how much to act on a given prediction.
Book a demo to see how forecast accuracy is tracked and reported.
Can prescriptive recommendations be tuned to our own operating rules?
Yes, recommendation logic can be configured around constraints specific to your plant, such as required CIP windows, allergen changeover sequences, or minimum staffing levels, so suggestions stay realistic rather than theoretical. This configuration is typically set up during onboarding alongside your reason code library.
Contact our support team to discuss configuring recommendations for your floor.
Is this only useful for large plants with dedicated data teams?
No, the platform is built to be usable by shift supervisors and line leads directly, without requiring a data science team to interpret the output, since recommendations are delivered in plain operational language rather than raw model scores. Smaller multi-line plants often see the fastest relative gains because they previously had no way to track this level of detail manually.
Book a demo to see the operator-facing view.
Move Your Plant From Reporting To Prevention
iFactory forecasts shift-level OEE and recommends the specific action that keeps a line on target, built on your own production data. Book a demo and see it running on your own lines.