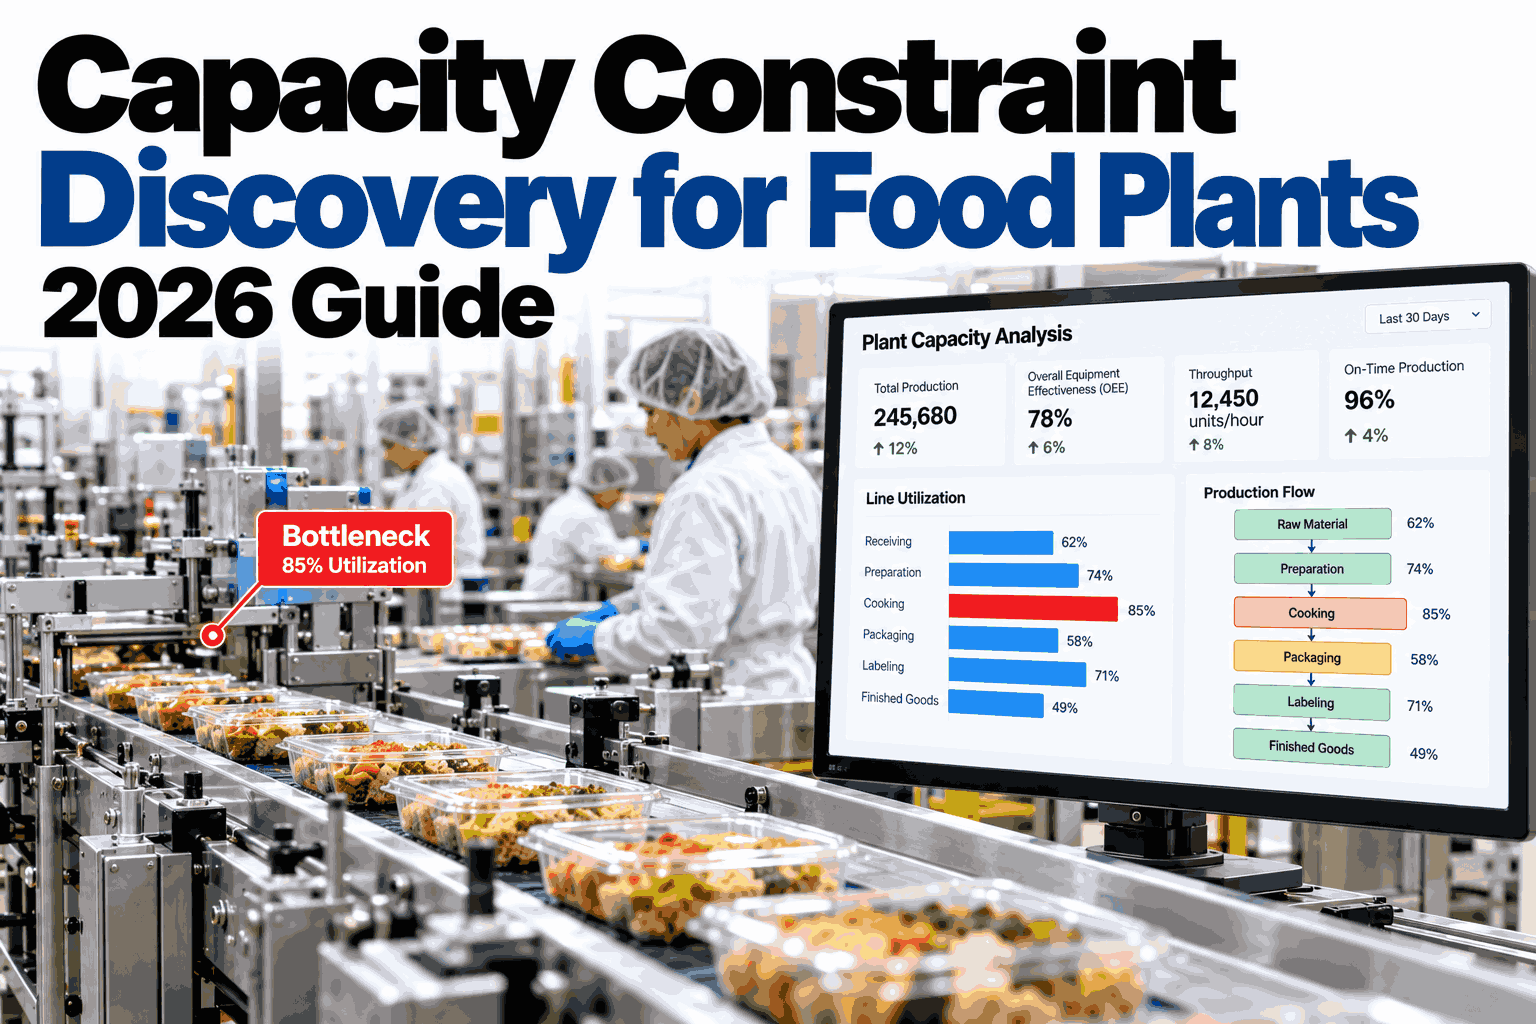
Food plant managers often celebrate fixing a bottleneck only to discover that the very next step in the process has now become the new constraint, stealing back the capacity they just fought to recover. This whack-a-mole cycle happens because most capacity plans identify the current bottleneck in isolation without asking the critical follow-up question: what becomes the constraint after this fix, and then what after the next fix. A capacity constraint discovery audit designed for 2026 must map the entire cascade of dependent constraints, from thermal recovery limits to CIP cycle durations, so you can sequence capital and operational improvements for maximum throughput gain. Without this roadmap, plants waste budget elevating non-constraints that yield zero capacity improvement. To map the complete constraint cascade for your own production line, you can schedule a capacity discovery audit with our team.
Capacity Constraint Discovery for Food Plants
Stop fixing one bottleneck just to hit the next one. Learn how to audit your current constraint, predict what becomes the constraint next, and build a capacity roadmap that compounds throughput gains.
Current
Next
Then
Final
Why Fixing One Bottleneck Rarely Increases Plant Output
The Theory of Constraints dictates that a plant's output is governed by its slowest step. When you increase the speed of the current bottleneck without understanding the dependent capacity of the rest of the line, you simply build inventory in front of the next slowest step.
A capacity constraint discovery audit prevents this trap by calculating the dependent capacity of every step before you invest in elevating the current constraint. discuss your current= current capacity trap with our support team.
The Three Questions Every 2026 Capacity Audit Must Answer
A meaningful capacity audit goes beyond finding the current bottleneck. It models the future state of the line after the bottleneck is elevated, revealing the next constraint before you spend a dollar on fixes.
How to Identify the True Pinch Point on a Food Line
In food manufacturing, the true constraint is often disguised by buffer capacity. A surge bin between the cooker and the freezer can mask a slower cooker for hours before the freezer finally starves.
| Constraint type | How it manifests on the floor | Common misdiagnosis | Correct discovery method |
|---|---|---|---|
| Speed constraint | Machine runs slower than line demand | Blamed on downstream downtime | Compare maximum sustained rate to line target rate |
| Starvation constraint | Machine runs slow because it waits on upstream | Blamed on the machine itself | Track upstream buffer levels and supply rate |
| Blockage constraint | Machine runs slow because downstream is full | Blamed on the machine itself | Track downstream buffer capacity and discharge rate |
| Thermal constraint | Cook or cool time limits batch release | Accepted as fixed process time | Model thermal recovery against load variations |
| CIP constraint | Sanitation cycle limits available run time | Accepted as hygiene requirement | Benchmark CIP cycle against sub-sector world-class |
Without distinguishing between these five types, plants frequently spend capital on the wrong step. Buying a faster filler when the constraint is a CIP cycle limitation yields zero additional throughput. run a constraint type analysis on your highest-volume line.
Calculating Dependent Capacity After Elevation
Once you know the current constraint, predicting the next one requires a simple but rigorous comparison of maximum effective rates across the entire line, adjusted for yield losses and changeover times.
Map Your Line's Constraint Cascade
Book a demo of iFactory AI and we will build a live capacity model showing your current constraint and the next two constraints in the sequence.
Thermal, CIP, and Labor Limits That Override Machine Speed
Food plants face three constraint categories that do not appear on machine spec sheets but dominate real-world capacity. Any 2026 audit must model these explicitly to avoid expensive surprises.
Ignoring these hidden constraints is the most common reason food capacity plans fail. Machine speed is irrelevant if the line cannot be cleaned, cooled, or packed fast enough to sustain it. audit your hidden constraints with iFactory AI.
Sequencing Capital to Follow the Moving Constraint
A constraint cascade roadmap tells you exactly where to invest first, second, and third, and how much throughput gain to expect at each stage before the next constraint binds the system.
This phased approach guarantees that every dollar spent releases actual throughput, because you are always elevating the active constraint, not a step that is already faster than the line speed. build your capital sequence roadmap with our specialists.
Why Static Spreadsheets Cannot Model Constraint Cascades
Capacity planning in most food plants lives in spreadsheets with fixed run rates and no time-based buffer modeling. These models fail the moment the line starts running because they cannot represent dynamic starvation and blockage.
| Capability | Static spreadsheet | Generic OEE tool | iFactory AI |
|---|---|---|---|
| Identifies current constraint type | Manual guess | Partial | Automatic classification |
| Predicts next constraint | No | No | Yes, via dependent capacity model |
| Models thermal and CIP limits | Manual override | No | Native process modeling |
| Simulates SKU mix impact | No | No | Dynamic scheduling integration |
| Generates capital sequence roadmap | No | No | Yes, ranked by ROI |
How iFactory AI Automates Constraint Discovery
iFactory AI applies the Theory of Constraints dynamically. Our software continuously calculates the dependent capacity of every step on your food line and updates the constraint cascade in real time as conditions change.
What Food Plant Managers Ask About Capacity Audits
Run a Constraint Discovery Audit on Your Food Line
Book a free demo of iFactory AI and see your current constraint, your next constraint, and the capital sequence to unlock maximum plant throughput in 2026.