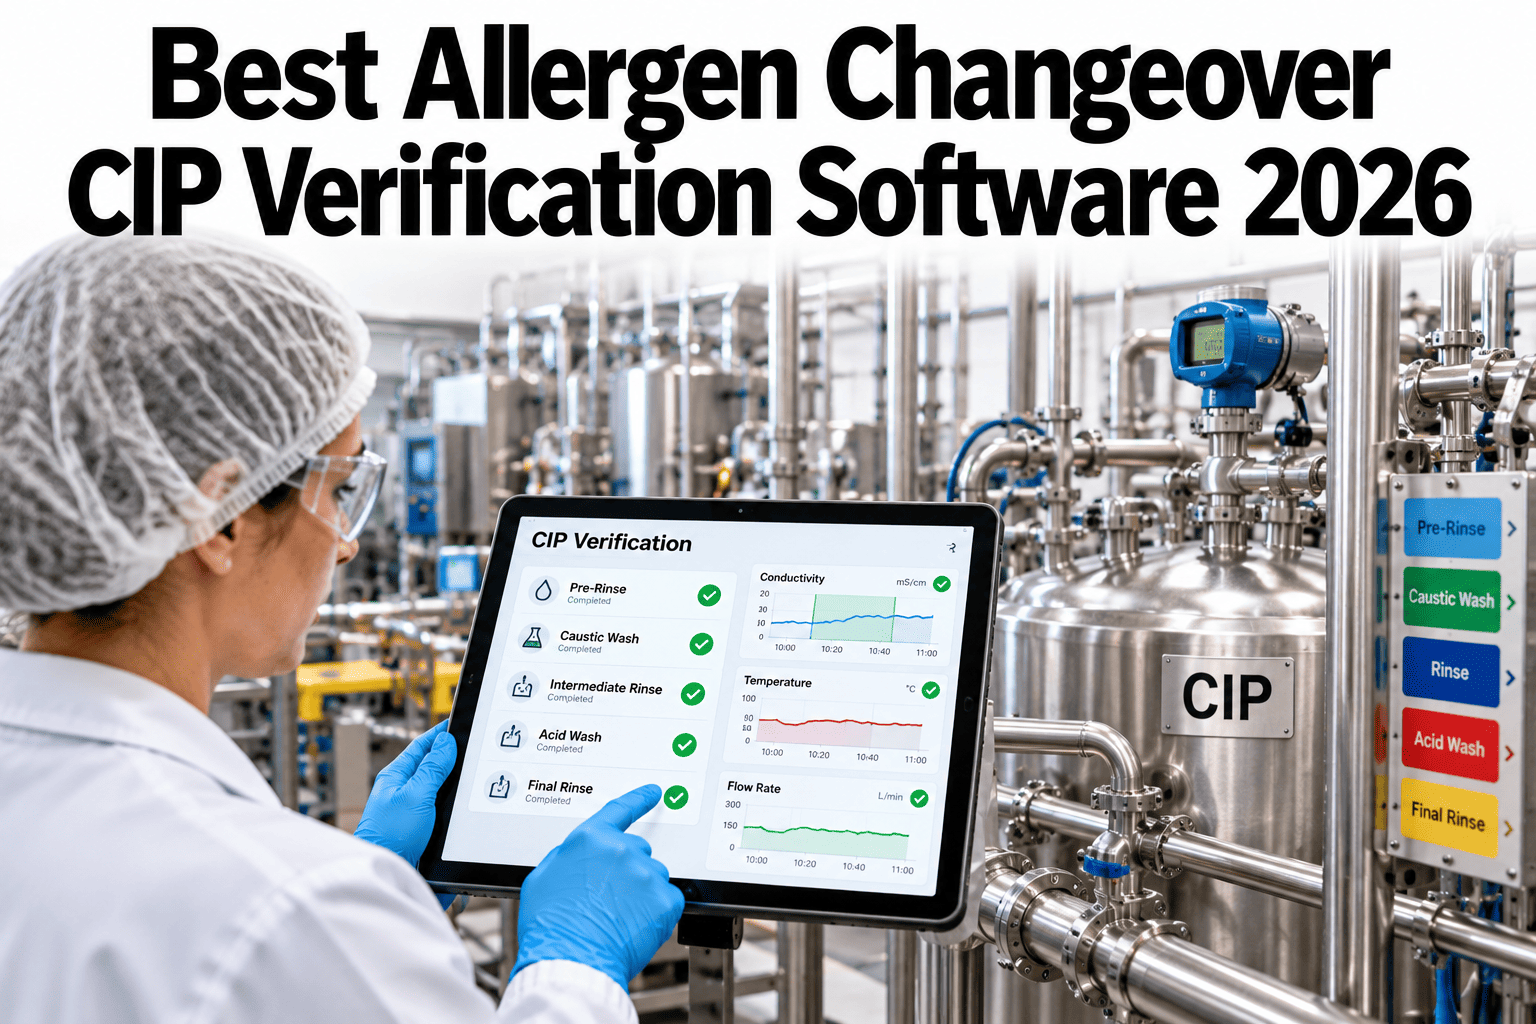
Allergen changeovers decide whether a clean line proves itself or hides a risk. A photo, a swab result and a signature mean little if they sit in three places, or on paper nobody can find during an audit. Plants can see one evidence record for each changeover with iFactory AI.
Release the Line Only When the Evidence Is Complete
iFactory AI attaches photos, swab results, lab references and sign-offs to each changeover, so release is a decision backed by a record.
What “Best” Means for Allergen Verification Software
There is no single best tool for every plant. The right choice is the one that makes each changeover provable, quick and hard to skip. This guide shows the criteria to judge any platform, without naming winners.
Prove
Every changeover has a record that shows what was done, by whom, and with what result.
Hold
The line stays blocked until the required evidence is in, not until someone remembers.
Find
An auditor can pull any changeover in seconds, with photos and results attached.
Learn
Failures and re-cleans feed trends, so weak points get fixed instead of repeated.
Validation and Verification Are Not the Same Job
Plants often mix the two terms, and then a daily check is asked to do the work of a study. Keep them separate in the procedure and in the software.
Know What Each Test Can and Cannot Say
Different tests answer different questions. A pass on the wrong test gives false comfort, which is worse than no test.
| Method | Speed | What it tells you | Best role |
|---|---|---|---|
| Visual inspection | Immediate | Whether soil is still visible | First gate, always documented with a photo |
| ATP bioluminescence | About 15 seconds | General organic cleanliness, not a specific allergen | Fast first-pass check before allergen tests |
| Lateral flow device | About 10 to 20 minutes | Presence of a specific allergen protein at low ppm levels | Daily verification at swab points |
| ELISA | Hours to next day | Quantitative level of a specific allergen protein | Validation studies and confirming rapid test fails |
| PCR | Several hours | DNA of a specific allergen source | Confirming species in cases in which protein tests fall short |
Set the Limit With Arithmetic, Not Guesswork
Acceptance limits often rest on a reference dose divided by a serving size. Reference-dose frameworks such as VITAL give an amount of allergen protein that very few allergic people react to, and that amount sets a safe concentration in the next product.
Smaller serving
A 15 g serving doubles the limit to about 13.3 ppm, because less product means less allergen per portion.
Larger serving
A 60 g serving halves the limit to about 3.3 ppm, so the cleaning must be tighter.
Different allergen
Each allergen has its own reference dose, so milk, egg, peanut and sesame limits differ.
Different assay
Test kits report in different units, so convert carefully and note the kit's limits.
The Rules Behind the Record
In the United States, allergen control sits inside current good manufacturing practice and the preventive controls rules for human food. Mills in other regions follow their own laws, but the logic is similar.
Major allergens
Sesame became the ninth major food allergen on January 1, 2023, under the FASTER Act.
FDA draft, 2023
A revised draft guidance adds a food allergen program chapter on cross-contact and label accuracy.
Declarations matter
The guidance notes that labeling errors cause most FDA allergen recalls, so label checks belong in the program.
No shortcut
The FDA does not support adding sesame on purpose just to avoid cross-contact control.
Classify Every Changeover
Not every product switch carries the same risk. Classify the move first, then let the software demand the right evidence for that class.
| Changeover type | Risk | Typical evidence required |
|---|---|---|
| Allergen to allergen-free | Highest | Full clean, photos, ATP gate, rapid test at every defined point, QA release |
| Allergen A to allergen B | High | Full clean, test for the outgoing allergen, label and recipe check |
| Same allergen profile | Lower | Standard clean, photos and a supervisor check |
| Allergen-free to allergen-free | Lower | Standard clean and routine hygiene verification |
| After repair or new equipment | Special | Revalidate the clean, then verify on the first changeover |
Choose the Worst Case for Validation
The one that clings, spreads or dissolves least, such as pastes and powders.
High-fat, high-protein or baked-on residues that resist the cleaning chemistry.
The longest dwell time and the most complex route with valves, dead legs and gaskets.
See One Record Hold the Whole Changeover
Book a 30-minute session and iFactory AI will walk through a changeover record with photos, swab points, test results and release logic on your own lines.
Anatomy of a Strong Changeover Record
A good record tells the whole story without anyone being asked. Eight items cover what most auditors look for.
Context
Line, date, outgoing and incoming product, allergen profile and the changeover type.
Before photos
Pictures of the defined inspection points before cleaning, tagged to each point.
CIP data
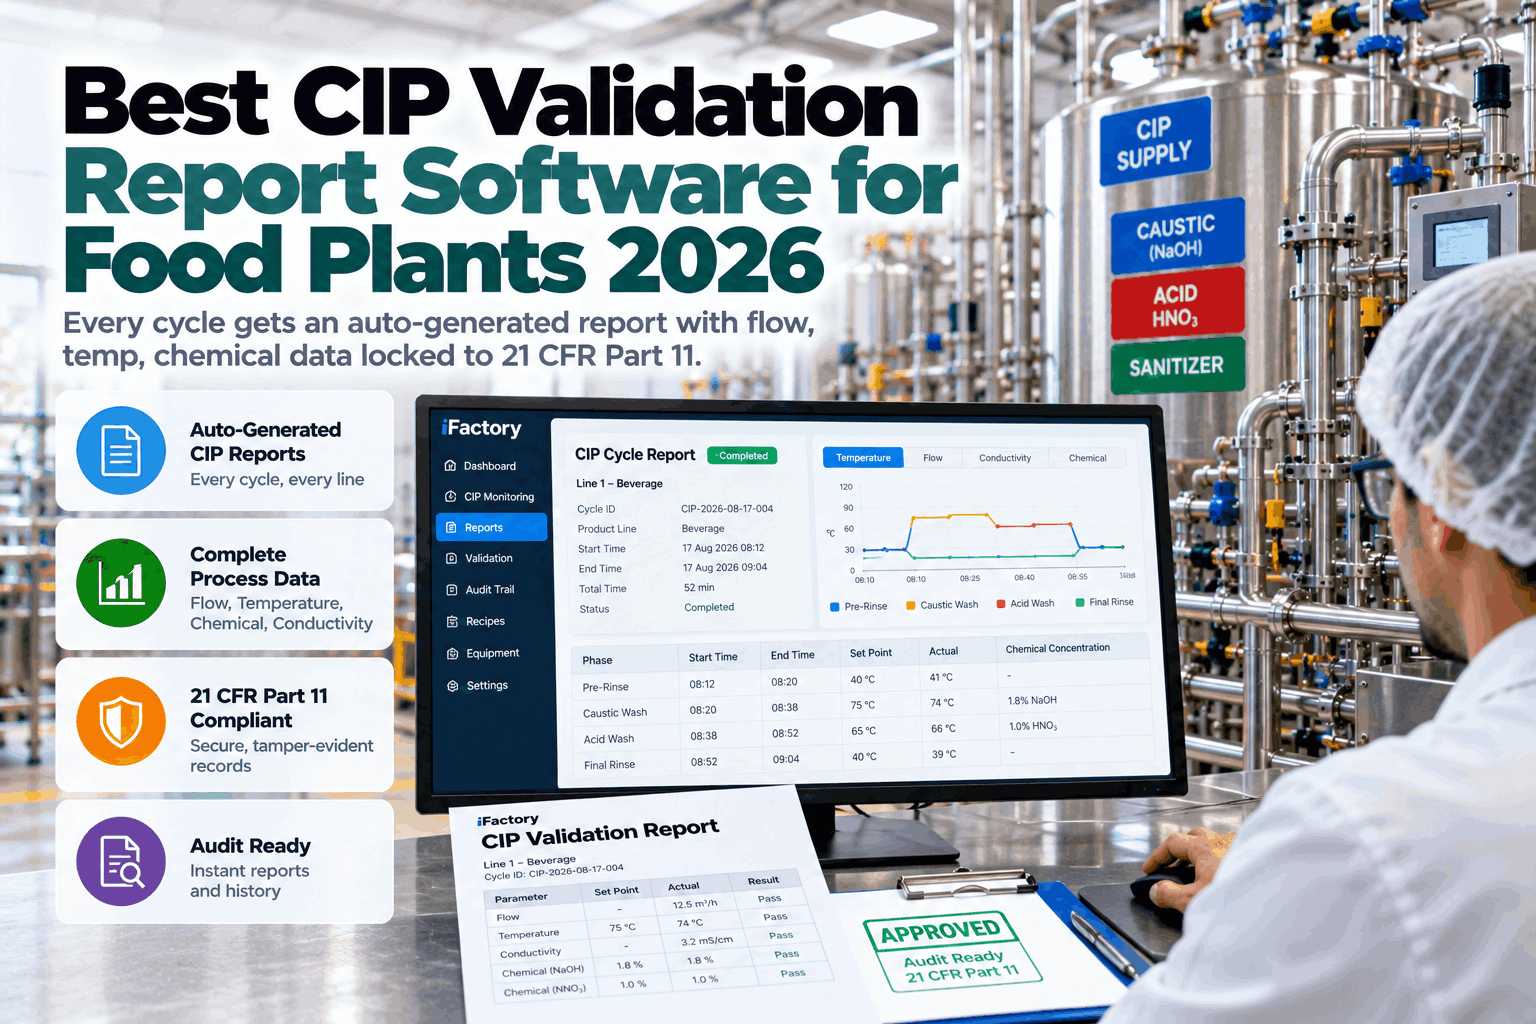
Time, temperature, flow and chemical strength for the cycle that ran, linked to the record.
After photos
Pictures of the same points after cleaning, matched to the earlier ones.
Swab map
A drawing of the line with each swab point, number and result in one view.
Test results
Rapid test outcomes with a photo of each device, plus any lab reference result.
People
Who cleaned, who swabbed, who checked and who released, with time stamps.
Decision
Release, re-clean or hold, with the reason, and any actions raised after a failure.
The Hold-and-Release Flow
Software earns its place when it enforces the order of work. These six steps show a flow that leaves little room for shortcuts.
The planned product switch sets the changeover type and the evidence needed.
The validated cycle runs, and its data attaches to the record automatically.
The inspector photographs each defined point and logs pass or fail.
Swabs go through the rapid test, with results and photos entered at the line.
A failure sends the line back to re-clean. A full pass opens the QA sign-off.
QA releases the line, and the first batch can be held or tested as the plan demands.
Your Buyer Scorecard
Use these questions in every demo. A good platform answers each one with a live screen, not a slide. Teams can ask support for a one-page version of this scorecard to take into vendor reviews.
| Criterion | Why it matters | Ask the vendor |
|---|---|---|
| Swab-point maps per line | Points must be fixed, numbered and easy to find | Can we draw each line and tag its points? |
| Photo evidence per point | Pictures prove state, not just a tick | Are photos linked to a point and time stamped? |
| Rapid test and lab results | Both belong in one record | Can we log device photos and attach lab files? |
| CIP data link | The cycle that ran must be the cycle on the record | Does cycle data attach by itself? |
| Hold and release logic | Stops the line when evidence is missing | Can release be blocked until all items close? |
| Changeover classes | Different moves need different evidence | Can rules change by allergen profile? |
| Revalidation triggers | New equipment and recipes reopen the study | Does the system flag a change that needs revalidation? |
| Roles and e-signatures | Sign-offs need identity and time | How are roles and signature rules set? |
| Audit export | Inspectors want a clean packet fast | Can one changeover export in a single file? |
| Offline use | Washdown zones often lack signal | Do swabs and photos save without a network? |
Demo Day Checklist
Photo Evidence That Holds Up
Photos are the cheapest strong evidence in a changeover. They only help when taken the same way every time.
Same point, same angle
Mark each point on the machine and show a reference photo, so inspectors repeat the shot.
Good lighting
Use a torch or a clip light for hidden areas, since shadows hide soil in seals and joints.
Before and after
Pair each cleaned point with its earlier photo, so the change is clear at a glance.
Time and person
Every image carries who took it and when, which stops late or borrowed pictures.
What to Do When a Swab Fails
A failed swab is not a disaster. It is the system working. What matters is a quick, recorded response that follows the same steps each time.
Hold the line
Release stays blocked, and anything made since the last pass is isolated per the plan.
Locate the source
Inspect the failed point and its neighbors, and look for hidden soil or missed steps.
Re-clean and retest
Repeat the targeted clean, photograph the point and swab again with a new device.
Raise an action
Log the cause and fix, such as a new tool, a longer step or a gasket change.
Who Does What
Clear roles stop the classic gap in which sanitation thinks QA checks, and QA thinks sanitation checked.
Sanitation Crew
Runs the validated clean, takes the photos and records the cycle.
Line Inspector
Swabs the defined points and logs the rapid test outcomes with device photos.
QA Specialist
Reviews the record, sets limits and signs off on release or re-clean.
Production Supervisor
Owns timing, keeps the line blocked when needed and plans the next run.
Maintenance
Fixes gaskets, dead legs and tools that keep failing, and records the fix.
Plant Manager
Backs the hold rule, reviews trends monthly and funds the fixes.
Train Before You Trust
Even the best record is only as good as the person filling it. Train inspectors to swab the same way each time, to avoid touching the swab tip and to read a rapid test at the stated time, not earlier or later. Short refreshers after every audit or failed swab keep habits sharp. Keep training dates in the same system, so a supervisor sees who is current before assigning a changeover, and nobody learns on a high-risk line alone.
Failure Patterns Audits Keep Finding
Measure the Program
| Measure | What it shows | Owner | Review rhythm |
|---|---|---|---|
| Changeovers with a complete record | Share of changeovers with every required item attached | QA manager | Weekly |
| First-pass swab rate | Share of swab points that pass at the first test | Sanitation lead | Weekly |
| Re-cleans per hundred changeovers | How often the first clean falls short | Sanitation lead | Weekly |
| Time between clean end and release | Waiting time added by testing and approval | Production manager | Monthly |
| Records ready for audit | Changeovers that export without extra searching | QA manager | Quarterly |
| Open actions after failures | Corrective actions still waiting to close | QA manager | Weekly |
A Simple Business Case
Finance and quality teams can request a worksheet through support to test their own figures. The example uses round numbers for one line.
How iFactory AI Fits
iFactory AI builds one record around each changeover. Photos at defined points, swab and test results, CIP cycle data and sign-offs attach to the same line and product, and the system holds release until the plan's evidence is in. It works with existing sensors, CIP controls and quality systems. Scope and timing are confirmed in a line review.
Changeover Record
One packet per switch, with every required item in order.
Photo Evidence
Tagged pictures for each inspection and swab point.
Swab and Test Results
Rapid test outcomes and lab references in one view.
Hold Logic
Block release until every needed item is closed and signed.
CIP Data Link
Attach cycle time, temperature, flow and chemical data to the record.
Failure Trends
See which points fail most, by line, product and shift.
A 90-Day Starting Plan
Map the risk
List allergen profiles, changeover types and swab points for one pilot line.
Set the evidence
Define photo points, test methods, limits and the sign-off path for each class.
Run in parallel
Use the digital record beside the paper one and compare completeness and time.
Switch and widen
Retire the paper form on the pilot line and plan the next line.
Frequently Asked Questions
Is ATP enough to confirm allergen removal?
No. ATP measures general organic residue and is not allergen-specific, so a clean result can still hide allergen protein. Use it as a quick first gate, then confirm with an allergen-specific test such as a lateral flow device, and use ELISA for validation and for confirming failures.
How often must we validate versus verify?
Validation is a periodic study, repeated after changes to equipment, recipe or cleaning method. Verification happens at every allergen changeover. Your food safety plan and certification scheme set the exact rules. Book a session to map both onto one workflow for your lines.
What swab points should we define?
Start with the hardest places to clean: gaskets, valve seats, dead legs, augers, blades and low-flow zones, plus final rinse water when relevant. Fix the number of swabs, the area, the method and the pass criteria in your protocol, then keep them the same across changeovers.
Can software replace lab testing?
No. Software records and enforces the process, while tests and labs produce the results. It makes sure each test happens, each result is attached and each release is signed. Support can explain how lab files are attached to a changeover record.
Which line comes first in a plant with many lines?
Begin with the line that has the most allergen-to-allergen-free changeovers, since it carries the highest risk and the most records. Prove the flow there, tune the swab maps and rules, and then roll the same pattern to other lines with line-specific points and limits.
Make Every Allergen Changeover Provable
iFactory AI gives food plants one record per changeover, with the evidence in place before the line runs. Book a walkthrough on your own lines.