Most food plants investigate a failure the same way twice in a row and still land on a different root cause each time, because the investigation follows whoever is loudest in the room rather than a structure that forces the logic to hold together. Fault tree analysis fixes that by starting from the one thing everyone already agrees on — the failure itself — and working backward through the combinations of conditions that had to be true for it to happen. It's a slower first pass than a five-whys conversation, but it survives being checked, which a hallway conversation rarely does. iFactory's reliability team builds these trees directly from plant data rather than from memory.
Trace Equipment Failures Back to Their Actual Cause, Not the First Plausible One
A structured, gate-by-gate breakdown of the conditions that combine to cause a failure — built from real sensor and maintenance data instead of a whiteboard guess after the fact.
What a Fault Tree Actually Is
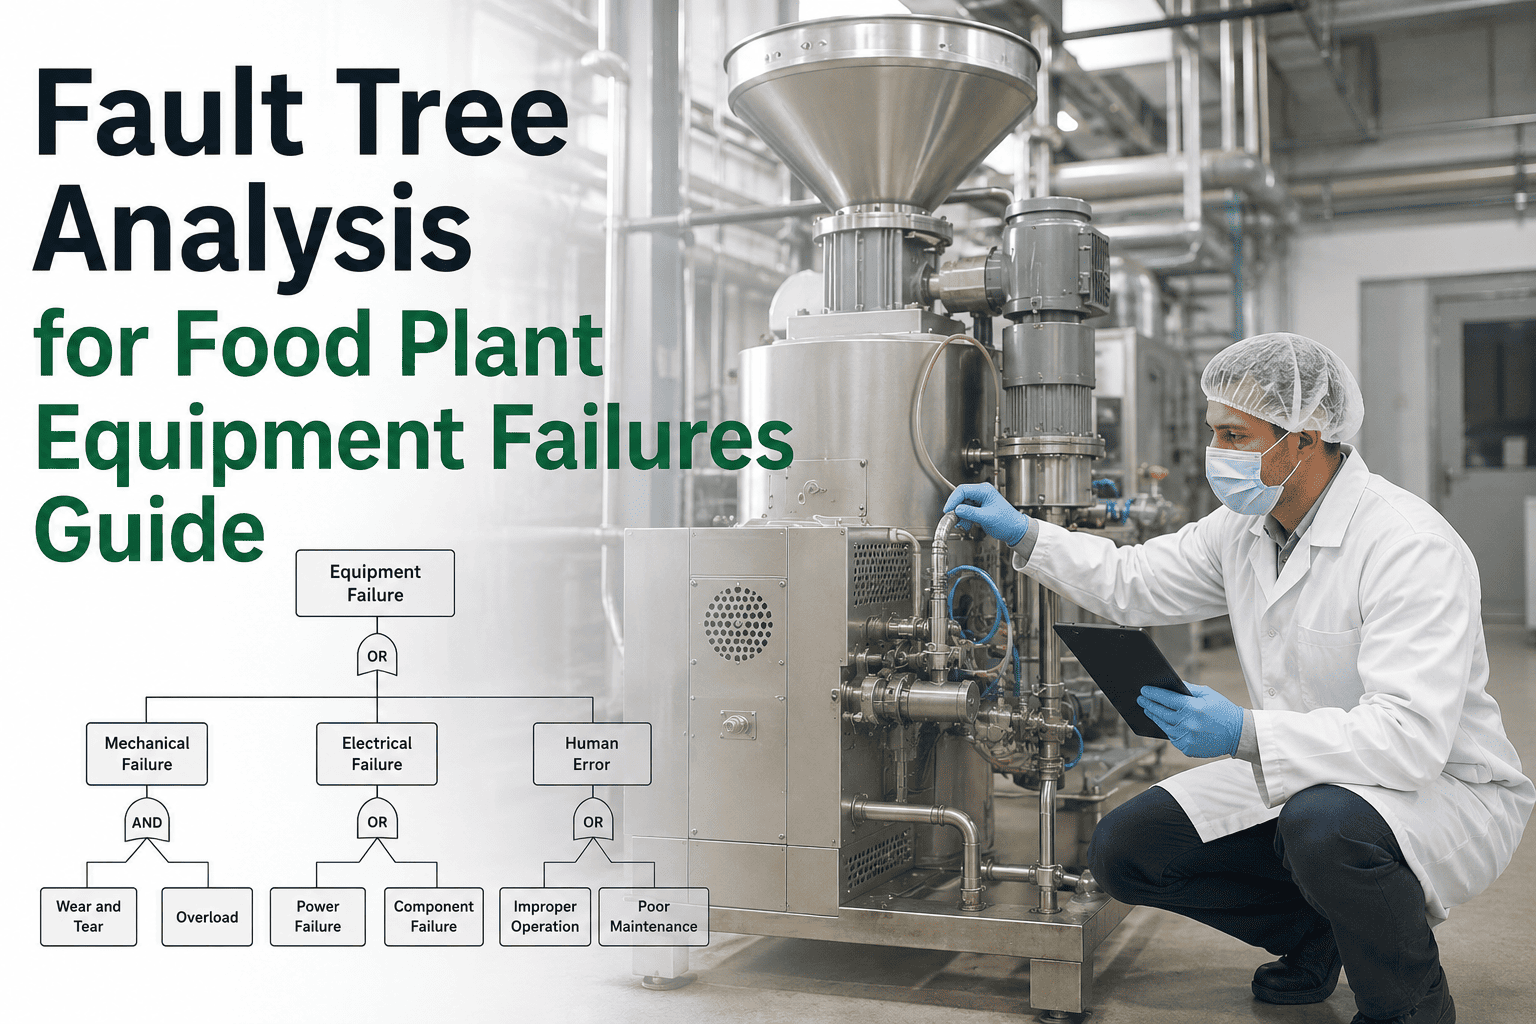
A fault tree starts at the top with a single, precisely defined failure — not "the filler broke" but "the filler stopped producing acceptable seals for more than ninety seconds." Everything below that top event is built from logic gates, mainly AND and OR, that describe how lower-level conditions combine to cause it. An OR gate means any one of the conditions beneath it is sufficient on its own. An AND gate means every condition beneath it has to occur together. Getting this structure right is most of the value of the method, because it forces the team to be explicit about whether a failure needs one bad thing to happen or several bad things at once.
Why This Matters More on Food Lines Than Anywhere Else
Food and beverage equipment fails inside tight sanitation and changeover windows, which means the pressure to accept the first plausible explanation is higher than in almost any other industry. A team under time pressure to restart the line will happily accept "the sensor was probably dirty" and move on, even when a fault tree built from the same event history would show that dirty sensors alone have never caused this failure without a second condition present at the same time. Skipping the structure doesn't save time — it just moves the cost of the mistake to the next occurrence of the same failure a few weeks later.
Have Us Build a Tree From Your Own Failure History
Send over the sensor tags and maintenance logs for one recurring failure, and we'll show you what the actual gate structure looks like once the events are laid out in order.
Where the Probability Numbers Come From
Once the tree structure is agreed, each basic event gets a probability, usually derived from historical failure rate data for that specific component or condition. Those probabilities propagate up through the gates using standard probability math — multiplied together under an AND gate, combined under an OR gate — until the top event itself carries a calculated probability. That number is what turns the tree from a diagram into a prioritization tool, because it tells the team exactly which branch contributes the most risk, rather than which branch happens to be the most recently discussed in a meeting.
| Basic Event Type | Typical Data Source | Update Frequency |
|---|---|---|
| Sensor drift or miscalibration | Calibration logs, historian tags | Per calibration cycle |
| Mechanical component wear | CMMS work order history | Continuous, per failure event |
| Operator-related conditions | Shift logs, MES event records | Per shift |
| Environmental conditions | Plant sensors (humidity, temp) | Continuous |
Building the Tree in Practice
A fault tree is only as good as the honesty of the team that builds it, and the biggest practical risk is stopping too early because a plausible-sounding basic event has been reached. The discipline is to keep asking what specifically has to be true for that condition to occur, until the answer is something that could be directly measured or verified, not just asserted.
Not sure which gates apply to a specific recurring failure on your line? Ask our reliability team to review it with you before you commit the structure to paper.
What Changes Once the Tree Is Automated
Building a fault tree by hand for every recurring failure doesn't scale past a handful of critical assets, which is why most plants that rely on manual fault trees only ever build them for the two or three failures that have already caused a major incident. An AI-assisted platform can construct and update these trees continuously from live sensor and maintenance data, surfacing the highest-probability branch automatically the moment a failure pattern starts repeating, rather than waiting for a formal investigation to be scheduled after the fact.
Mistakes That Undermine a Fault Tree
The most common mistake is building the tree from memory in a meeting room instead of from the actual event log, which reintroduces exactly the bias the method is supposed to remove. A second mistake is mixing levels of specificity within the same branch — pairing a precise, measurable basic event next to a vague one that nobody has actually verified — which makes the propagated probability meaningless even though the diagram looks complete. A third mistake is treating the finished tree as permanent rather than revisiting it as new failures occur, since a tree built from six months of data can miss a failure mode that only shows up in a ninth month with a different raw material supplier.
Frequently Asked Questions
Build Fault Trees From Real Plant Data, Not Meeting-Room Memory
Bring one recurring failure to the call. We'll show you what the fault tree looks like once it's built from your actual sensor and maintenance history.