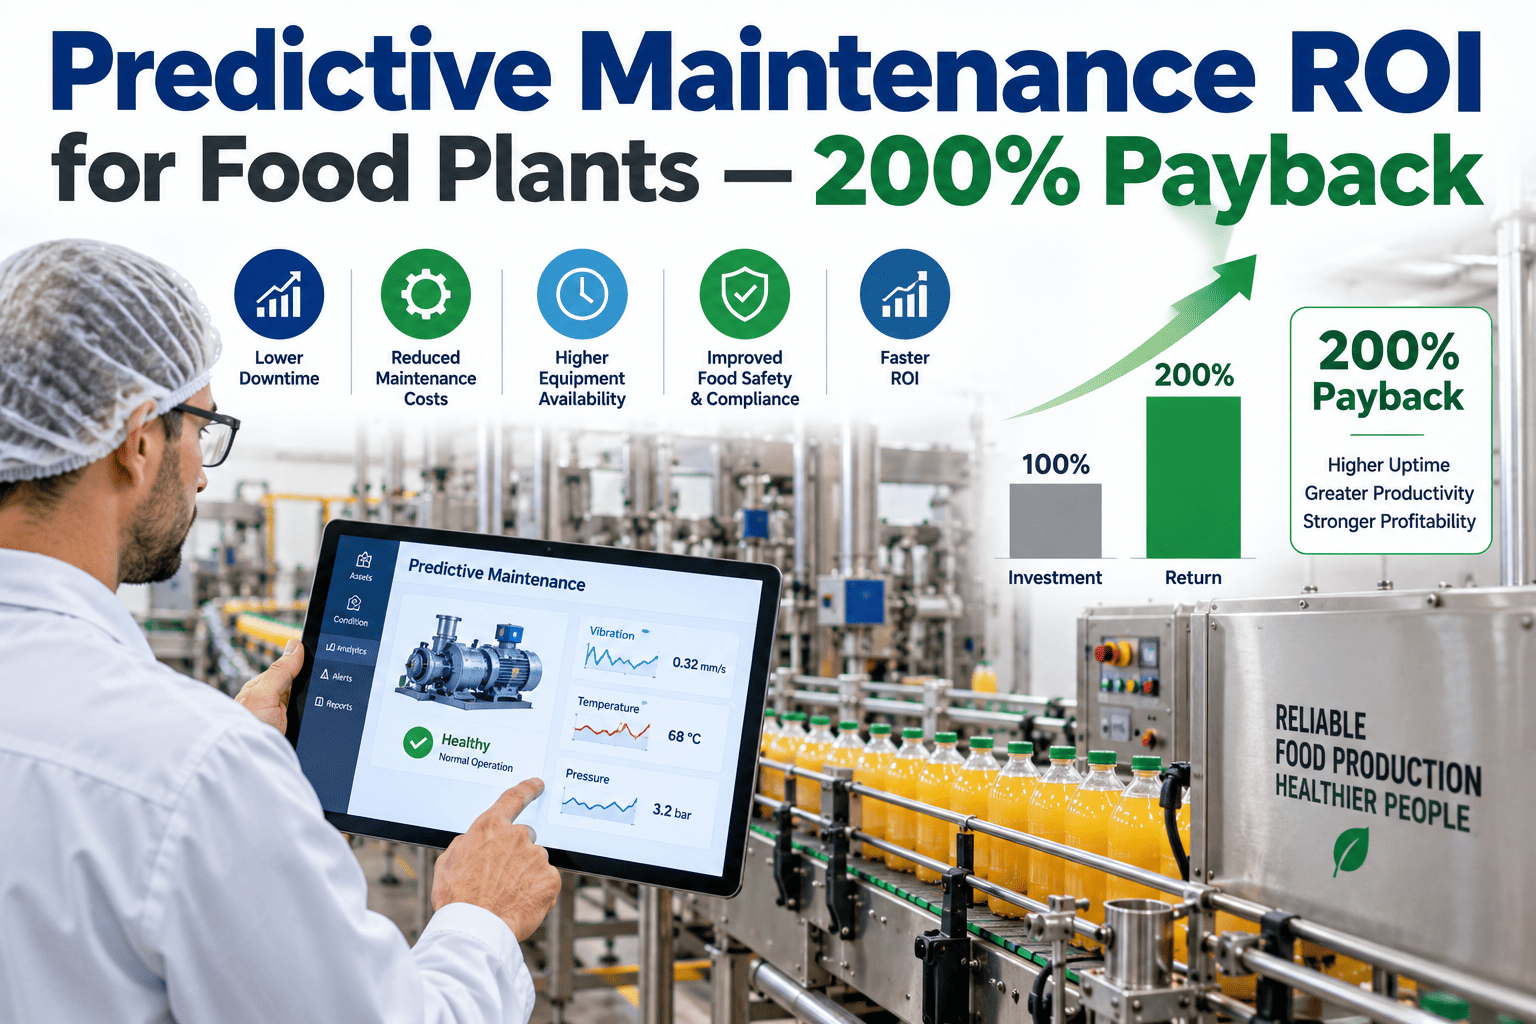
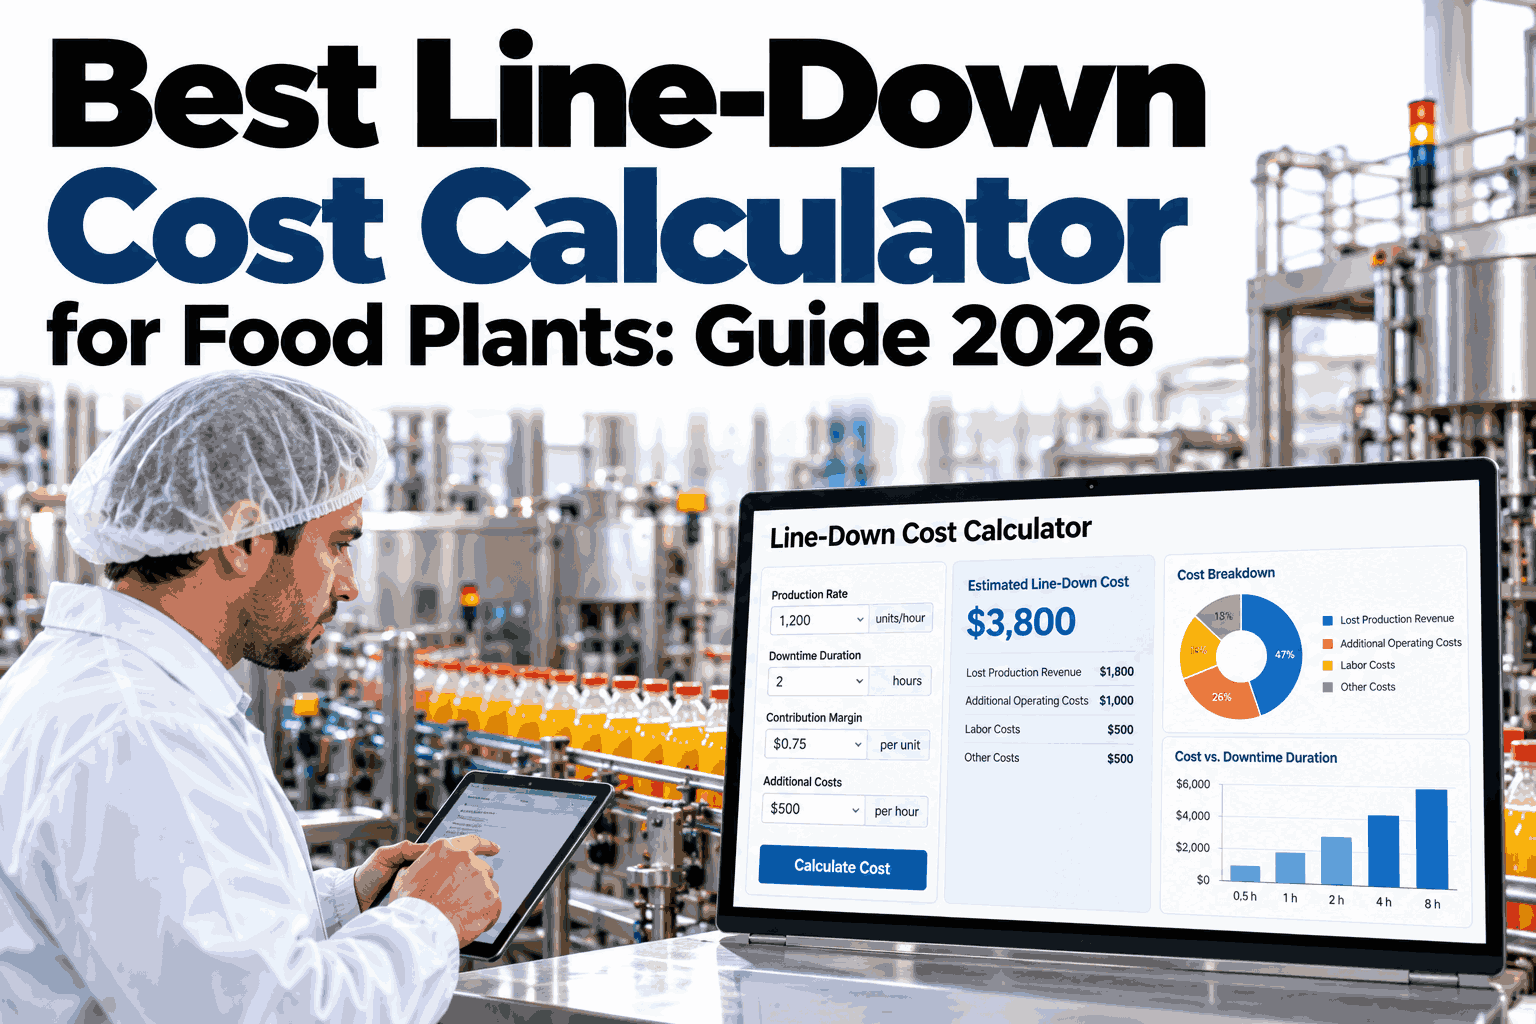
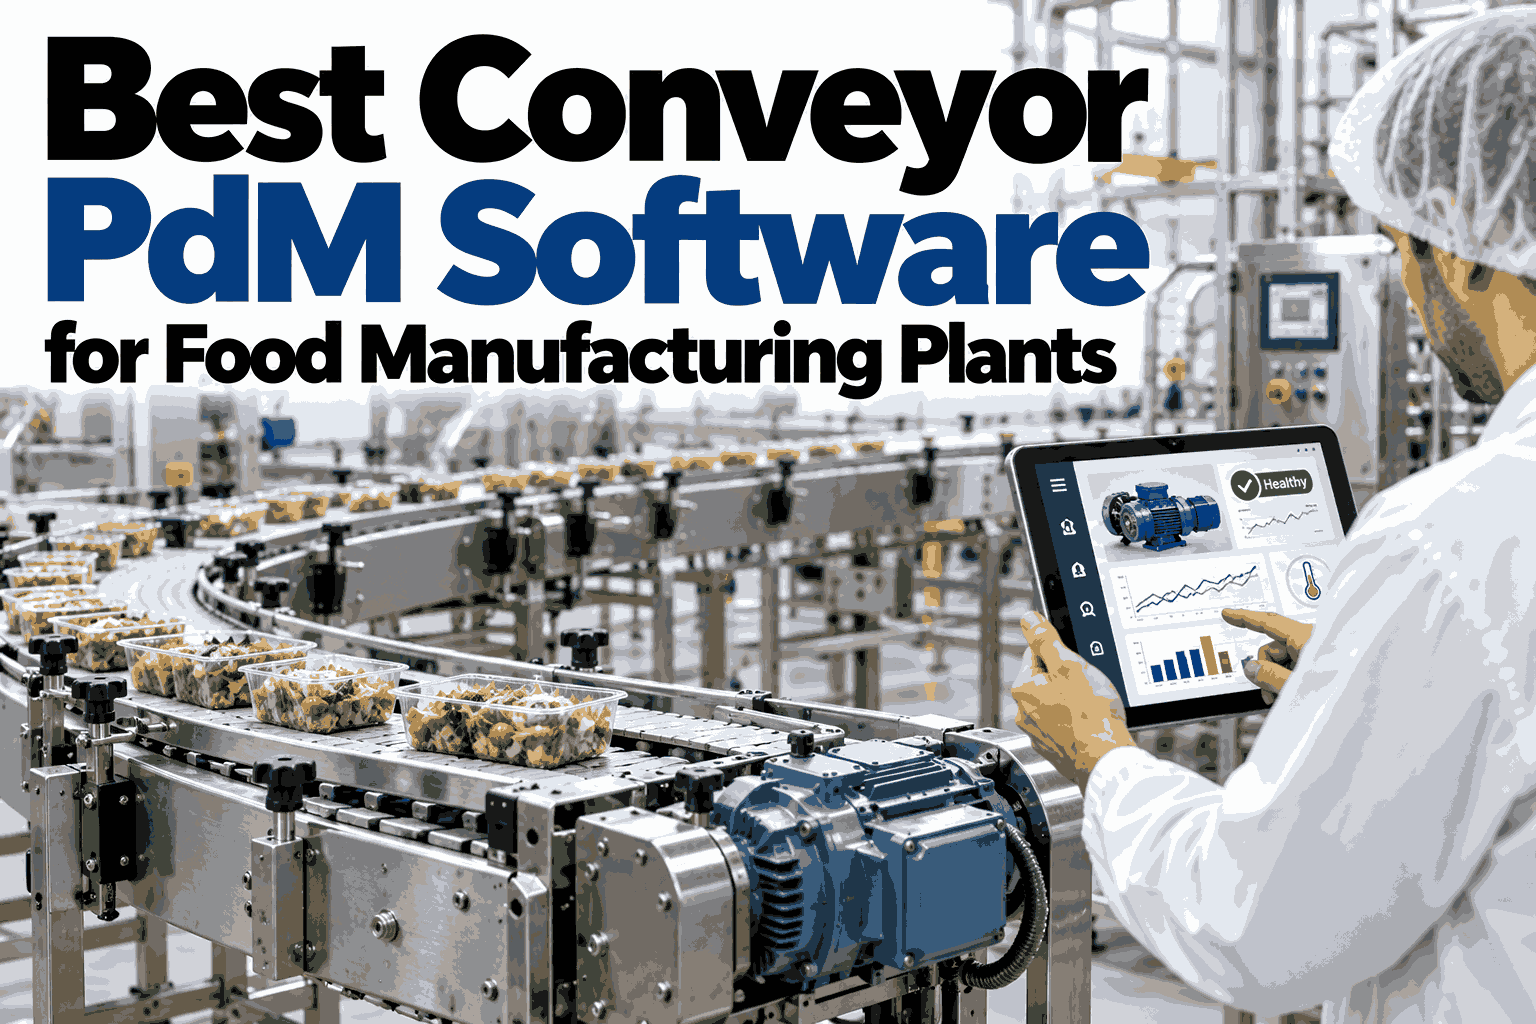
A capex request for predictive maintenance usually dies in the same meeting for the same reason: someone asks "what do we get back, and when," and the answer on offer is a vague promise about "fewer breakdowns" rather than a number a CFO can actually underwrite. That's a framing problem, not a value problem, because the real financial case for predictive maintenance in a food plant is unusually strong and unusually calculable once you break it into its actual components, downtime avoided, emergency repair premiums eliminated, scrap and quality losses prevented, and labor hours recovered. Most food and beverage plants that build this case properly land well north of 200% return within the first three years, and the plants that get funded fastest are the ones that walk in with that math already done. If you're building a business case right now, book a demo to get an ROI model built against your own line data.
FOOD & BEVERAGE · PREDICTIVE MAINTENANCE ROI
The Business Case CFOs Actually Approve
iFactory builds a defensible, four-driver ROI model against your own plant data, the same model food and beverage manufacturers use to clear capex approval in a single meeting instead of eight months of back and forth.
THE FOUR VALUE DRIVERS
Where the Return Actually Comes From
Predictive maintenance ROI isn't one number, it's four separate financial layers that stack on top of each other, and most plants underestimate their combined value because they only ever count the most obvious one.
01
Downtime Avoided
Usually the single largest layer: hourly margin lost during an unplanned stoppage, multiplied by the hours a caught failure prevents. Most plants understate this by measuring lost revenue instead of lost margin.
02
Emergency Repair Premium Eliminated
A planned intervention typically costs a fraction of an emergency repair, no overtime, no expedited parts shipping, no secondary damage from a component that failed catastrophically instead of being caught early.
03
Quality & Scrap Reduction
Degrading equipment produces out-of-spec product well before it fails completely, a cost category that's unique to food and beverage and easy to miss if you're only tracking downtime.
04
Labor Efficiency
A planned two-hour replacement beats a six-hour emergency diagnosis at burdened labor rates, savings that show up independent of any production impact at all.
A WORKED EXAMPLE
What the Math Looks Like on a Real Line
Take a mid-sized bottling line running roughly $8,000 an hour in gross margin, with a documented history of six unplanned stoppages a year averaging four hours each. That's the starting point most plants can pull straight from their own downtime logs.
Annual downtime avoided (24 hrs × $8K margin/hr)$192,000
Emergency repair premium eliminated (est.)$65,000
Quality & scrap reduction (est.)$40,000
Labor efficiency gained (est.)$28,000
Total annual value$325,000
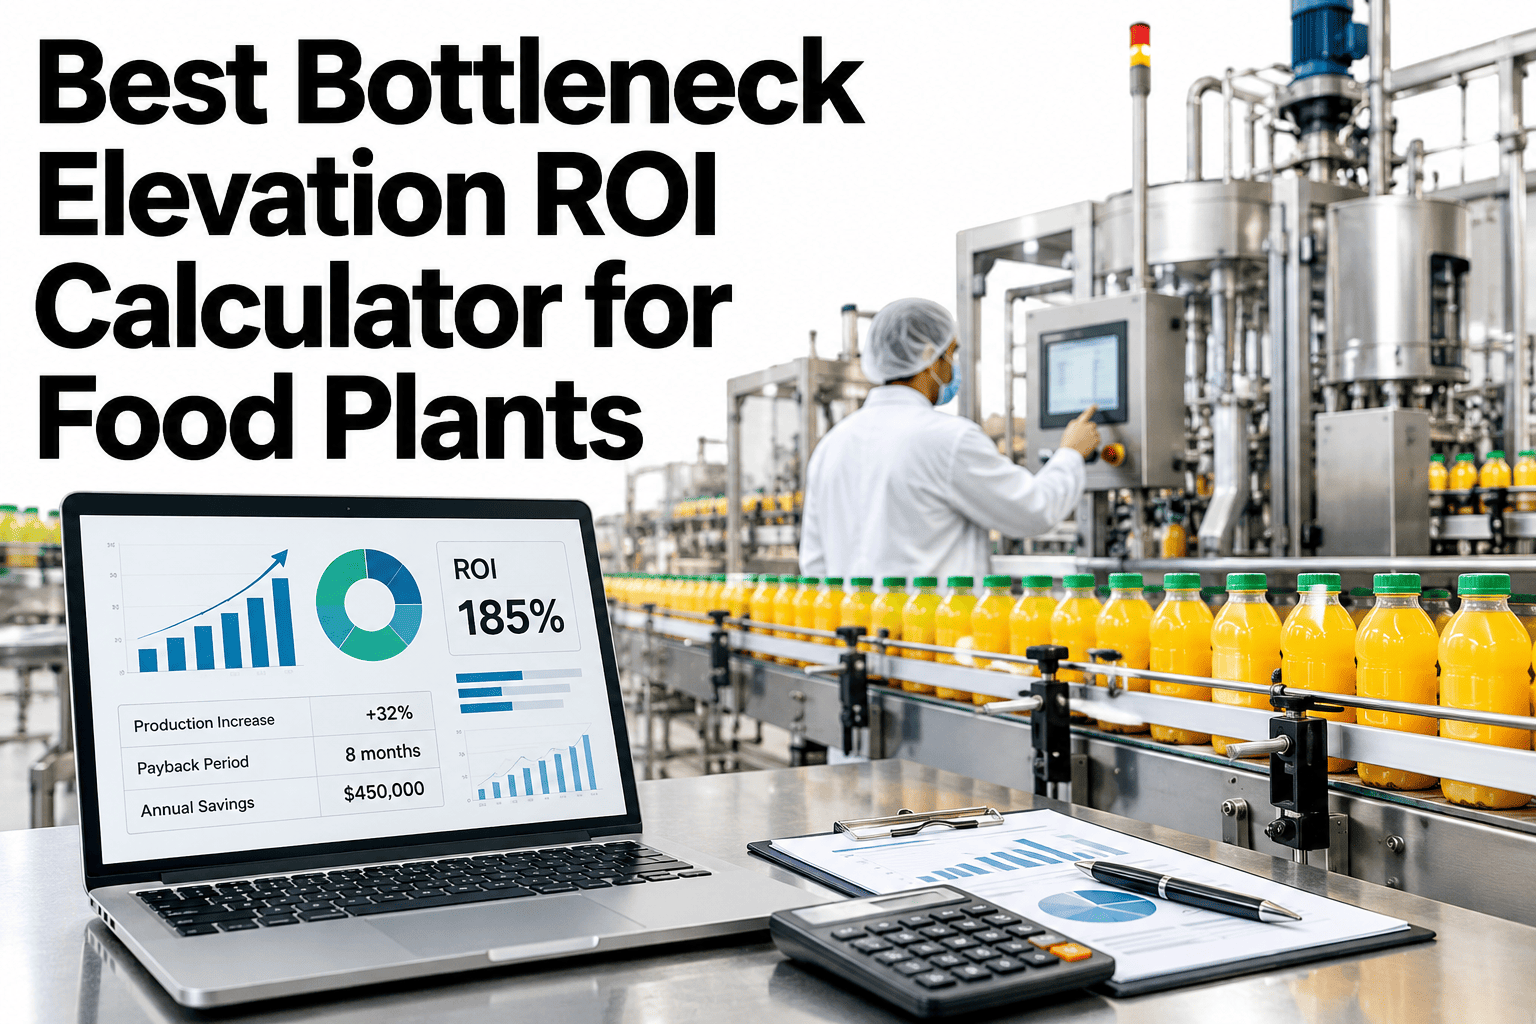
Against a typical annual program cost in the range of $90,000-$120,000 for a deployment of this scale, that example clears a positive return within the first year and comfortably exceeds 200% cumulative ROI by year three, before accounting for extended asset life or avoided capital replacement.
Build this model against your own numbers
iFactory can plug your actual downtime history and hourly margin into this same model and hand you a number your CFO can underwrite.
THE COST OF STAYING REACTIVE
What "Doing Nothing" Actually Costs
25-40%
typical reduction in total maintenance cost after moving from reactive to predictive strategy
3-5x
cost multiple of an emergency repair compared to the same job done as a planned intervention
4-12 mo
typical payback period reported across food and beverage predictive maintenance deployments
30-40%
how much most plants underestimate their true downtime cost by measuring revenue instead of margin
REACTIVE VS PREDICTIVE INVESTMENT
What Actually Changes on the Balance Sheet
| Factor |
Reactive Maintenance |
Predictive Maintenance |
| Repair cost per event |
Emergency rate, overtime and expedited parts |
Planned rate, standard scheduling and pricing |
| Downtime exposure |
Full stoppage until diagnosis and repair complete |
Scheduled window, production impact minimized |
| Quality risk |
Out-of-spec product often runs before failure is caught |
Degradation caught before product quality is affected |
| Spare parts strategy |
Deep safety stock required for unpredictable failures |
Lead time to failure allows lean inventory planning |
| Typical 3-year ROI |
Baseline, ongoing unplanned cost |
200%+ across the four value drivers combined |
TURNKEY DEPLOYMENT
How iFactory Builds Your ROI Model
What Gets Delivered
A four-driver ROI model built against your actual downtime and cost history
Margin-based downtime cost calculation, not revenue-based
A capex-ready business case document for leadership review
Ongoing tracking against the model once deployment begins
Quarterly ROI reporting validated against real outcomes
Modeling Timeline
Week 1: Downtime history and cost data collection
Week 2: Four-driver model built and reviewed with your team
Week 3: Capex-ready business case finalized for leadership
FREQUENTLY ASKED QUESTIONS
What Finance and Operations Ask About PdM ROI
Why do you calculate downtime cost using margin instead of revenue?
Revenue lost during downtime overstates the true cost, since it ignores the variable costs, raw materials, packaging, and direct labor, that also don't get incurred when the line isn't running, while margin lost captures the actual profit impact more accurately. Most plants that build their business case around revenue rather than margin end up with a number that's either significantly inflated in a way finance teams quickly discount, or in some cases understated if fixed overhead allocation is handled inconsistently, which is why a properly built model always starts from gross margin per hour of production.
Book a demo to see this calculation built correctly against your own line's actual margin.
How confident can we really be in a projected ROI before the program even starts?
The model is built entirely from your own historical downtime, repair cost, and quality data rather than industry averages pulled from someone else's plant, which is what makes the projection defensible rather than aspirational. That said, it's still a projection until real outcomes validate it, which is exactly why the engagement includes ongoing tracking against the model once deployment begins, with quarterly reporting that shows how actual results compare to the original projection rather than treating the initial number as the final word.
Contact our support team to review how projection accuracy is tracked and reported over time.
What if we don't have clean historical downtime data to build the model from?
Even partial or imperfect historical data, a rough downtime log, general maintenance spend figures, an estimate of your hourly line margin, is usually enough to build a reasonably conservative first-pass model, and the model can be refined and tightened as better data becomes available once monitoring begins. Waiting for perfect historical records before building a business case would mean waiting indefinitely, so the practical approach starts with what you have and builds in appropriate conservatism where data is sparse rather than blocking the process entirely.
Book a demo to see what's achievable with the data you currently have on hand.
How does quality and scrap reduction actually get quantified, since it seems harder to measure than downtime?
This layer is calculated from your existing quality hold and rework records correlated against equipment condition data once it becomes available, looking specifically at instances where degrading equipment, not a process or raw material issue, was the root cause of an out-of-spec batch. It's genuinely a smaller and less precise layer than downtime avoidance in most models, which is exactly why it's presented as a distinct, separately estimated line rather than blended into a single vague number, so your team can weight confidence in each driver independently.
Contact our support team to review how this layer would be estimated against your specific quality hold history.
Does the ROI model account for the ongoing cost of running the program, not just the upfront investment?
Yes, the model nets the full annual program cost, including ongoing platform and monitoring costs, not just the initial hardware and setup investment, against the four value drivers to arrive at a genuine net return rather than a gross figure that overstates the case. This is a common shortcut in less rigorous ROI pitches, presenting only the value side without netting the full ongoing cost, and it's specifically what makes a finance team distrust a projection on sight, so the model is built from the start to survive that scrutiny.
Book a demo to see the full net calculation, cost included, built against your own numbers.
A NUMBER YOUR CFO CAN ACTUALLY UNDERWRITE
Walk Into the Capex Meeting With the Math Already Done
iFactory builds a defensible, four-driver ROI model against your own plant data, the same math food and beverage manufacturers use to get predictive maintenance approved in a single meeting.