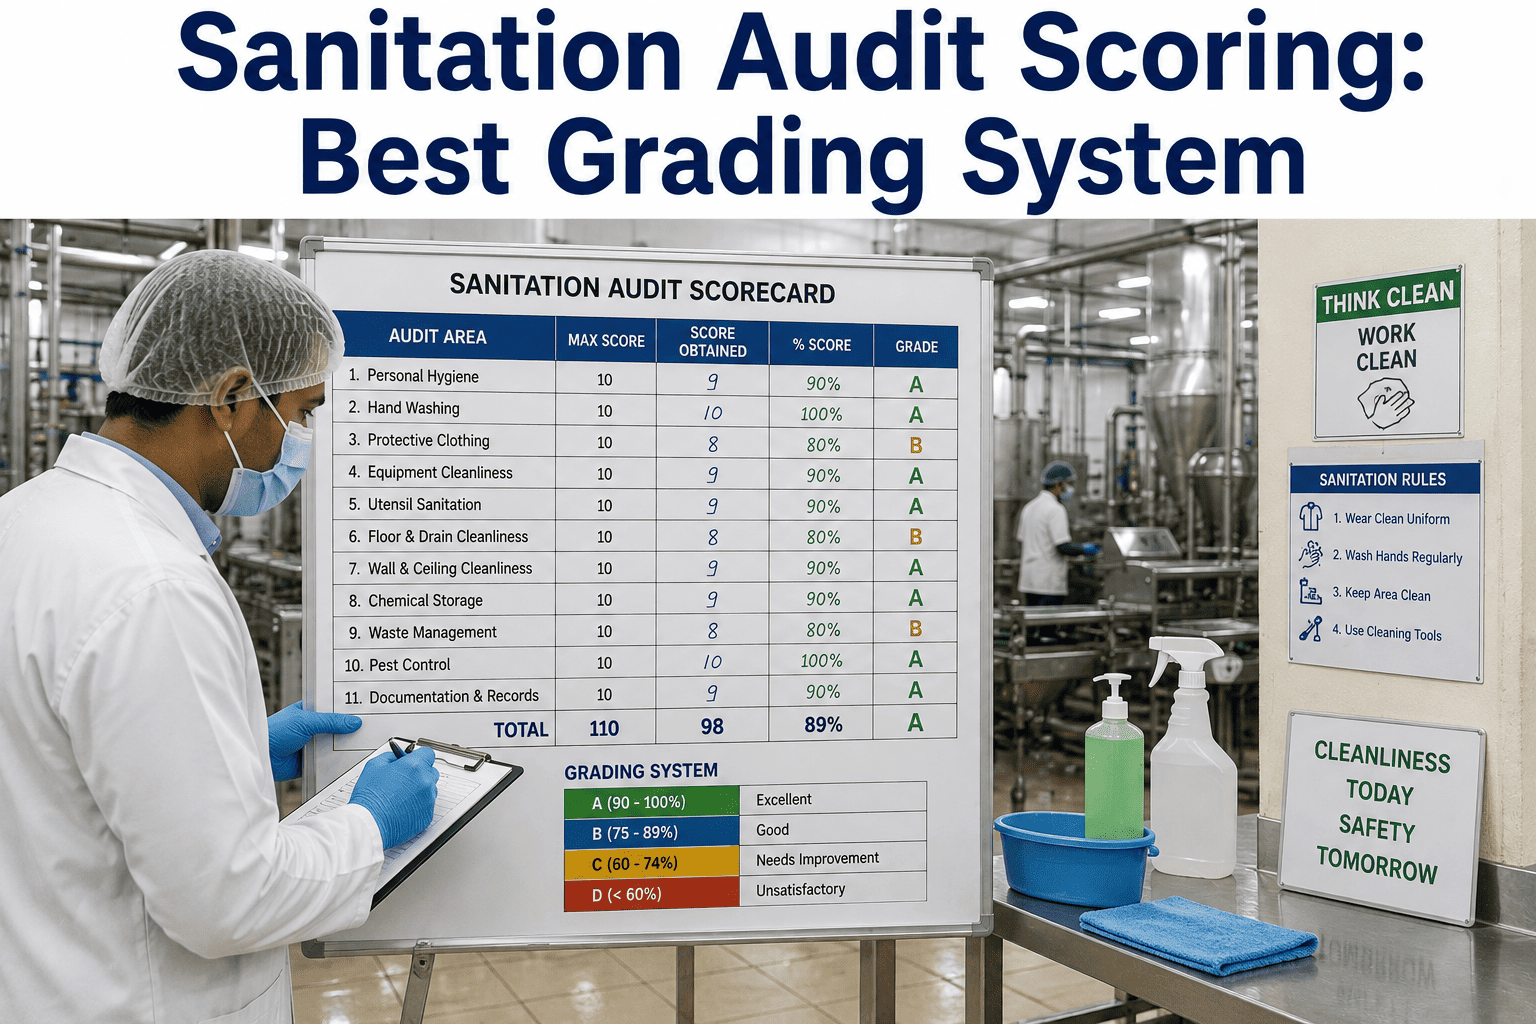
A sanitation audit that ends with "pass" or "fail" tells a plant almost nothing useful. Two facilities can both technically pass while one is trending toward a serious lapse and the other is steadily improving — a binary result hides that difference completely. A proper scoring system converts subjective walkthrough impressions into a weighted, comparable number that can be tracked over time, benchmarked across shifts or lines, and tied directly to specific improvement targets. Plants that build a real scoring system stop reacting to sanitation problems after they appear and start catching the slow decline that precedes them. This guide walks through how to design weighted criteria, a defensible grading scale, and a trending process that actually drives improvement, with tooling details available on our support page.
Why Weighted Scoring Beats Pass/Fail Checklists
A checklist marks each item as compliant or non-compliant with no sense of relative importance — a missing hairnet and a contaminated food-contact surface can score identically even though the risk they represent is nowhere close. Weighted scoring assigns point values based on actual risk severity, so a single critical finding can pull an otherwise strong audit down significantly, while a handful of minor housekeeping items only shave a few points. This mirrors how real risk works on a production floor and gives leadership a number that reflects true food safety exposure, not just a count of checked boxes.
Food Contact Surfaces
Cleanliness and sanitizer verification on any surface that directly touches product.
Environmental Zones
Floors, drains, walls, and overhead structures within production areas.
Equipment & Utensils
Teardown quality, hard-to-reach component cleaning, and storage practices.
Chemical Control
Correct concentration, labeling, and storage of sanitation chemicals.
Documentation
Completed sanitation logs, verification records, and sign-offs.
Curious what your current checklist would score under a weighted model? Book a demo and we'll map your existing criteria to a weighted scorecard.
Building a Defensible Grading Scale
A grading scale only works if every auditor interprets the boundaries the same way. The scale below is a common starting structure that most food plants adapt to their own risk tolerance and regulatory requirements.
| Score Range | Grade | Meaning | Required Action |
|---|---|---|---|
| 95-100 | A | Excellent, minimal or no findings | Maintain current practices |
| 85-94 | B | Good, minor non-critical findings | Close findings within 2 weeks |
| 70-84 | C | Marginal, multiple or moderate findings | Re-audit within 30 days |
| 50-69 | D | Poor, significant risk exposure | Immediate corrective action plan |
| Below 50 | F | Critical failure, food safety risk | Production hold consideration |
Turn Sanitation Scores Into a Live Trend Line
iFactory calculates weighted scores automatically from digital audit data and tracks them by line, shift, and facility over time. Book a demo to see the trending dashboard in action.
Trending Analysis: What a Score Alone Won't Tell You
A single score is a snapshot. The real value of a scoring system emerges once scores are plotted over time and compared across lines, shifts, and sanitation crews, revealing patterns a one-off audit could never expose.
A pattern like the one above — one shift consistently scoring lower than others on the same equipment — points directly at a training or staffing gap rather than an equipment issue, something a single audit report would never reveal on its own.
Setting Improvement Targets That Stick
Establish a Baseline
Run at least three audit cycles before setting any target, so the starting point reflects reality, not a lucky or unlucky single audit.
Set Category-Specific Goals
A single overall target hides which category needs the most attention — set improvement goals per weighted category instead.
Review Monthly With Owners
Share trend data with line supervisors and sanitation leads directly, not just plant management, so the people closest to the work see the numbers.
Recalibrate Annually
Revisit category weightings and thresholds once a year to reflect new equipment, new products, or changes in regulatory expectations.
Ready to replace manual scoring spreadsheets with automated trend tracking? Schedule a demo or talk to support about your current grading criteria.
Frequently Asked Questions
Score, Track, and Improve Sanitation Automatically
iFactory converts your audit criteria into a weighted digital scorecard, tracks trends by line and shift, and flags declining scores before they become findings.




-system-analytics-best-practices-for-food-and-beverage.png)